
In situ calibration of fura- and BCECF fluorescence in adult
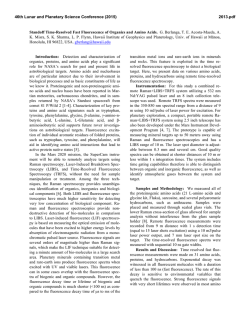
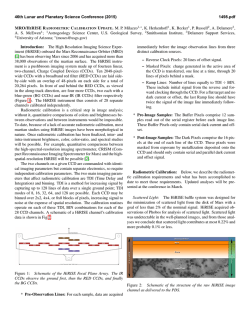
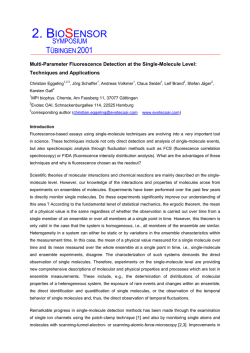
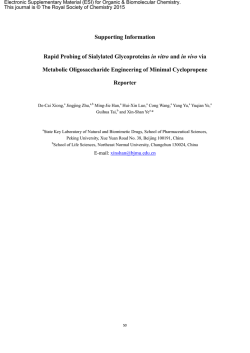
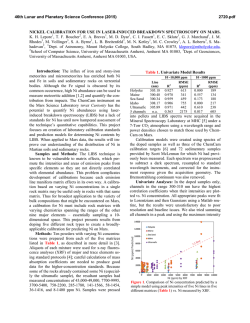
In situ calibration
of fura- and BCECF
fluorescence in adult rat ventricular
myocytes
STEVEN
BORZAK,
RALPH
A. KELLY,
BERNHARD
K. KRAMER,
YOSHIKI
MATOBA,
JAMES
D. MARSH,
AND MARTIN
REERS
Cardiology Division, Departments
of Medicine, Brigham and Women’s Hospital
and Harvard Medical School, Boston, Massachusetts
02115
BORZAK, STEVEN, RALPH A. KELLY, BERNHARD K. KR&
MER, YOSHIKI MATOBA, JAMES D. MARSH, AND MARTIN
REERS. In situ calibration of fura- and BCECF fluorescence in
adult rat ventricular myocytes. Am. J. Physiol. 259 (Heart Circ.
Physiol. 28): H973-H981,
1990.-Quantitation
of Ca’ and H’
activities
within
cells using presently
available fluorescent
probes is optimal when the fluorescence signal is calibrated in
situ after each experiment.
Furaand 2’,7’-bis(2-carboxyethyl) -5,6-carboxyfluoroscein
(BCECF)
are difficult
to calibrate in freshly dissociated
adult cardiac myocytes because
calibration
procedures
produce cellular hypercontracture.
In
situ calibration
was accomplished
in rat ventricular
cells by
saturating fura- with La3’, an agent known to produce myocardial relaxation. Since fura- has different spectral properties
when complexed with La3+ than with Ca”+, scaling factors were
defined in vitro and then verified by experiments
in cultured
neonatal
myocytes. In adult rat myocytes using the La3’
method, intracellular
Ca2+ concentration
([Ca”‘];) was 131 t
47 nM (n = 14) in quiescent cells; diastolic [Ca”+]i and systolic
[Ca2+]; in myocytes stimulated at 1 Hz were 140 t 56 and 1,088
t 211 nM (n = 5)) respectively.
BCECF fluorescence
was
calibrated in situ by a method that prevented cellular hypercontracture
and reported a pH value of 7.10 t 0.10 in cells
stimulated at 1.5 Hz. An additional
advantage of both methods
is that the buffers employed prevented large changes in the
redox state of intracellular
pyridine nucleotides, thus preventing a change in cellular autofluorescence
during the calibration
procedure.
indo-I) (12) and H+ concentrations [2’,7’-bis(2-carboxyethyl)-5, 6-carboxyfluorescein (BCECF)] (6), calibration of their fluorescent signals in cells have been hampered by many methodological limitations (21). Despite
the advantages of ratio spectroscopy (6), problems such
as photobleaching (6, 24) and uncertainty about dye ion
binding and spectral behavior in the intracellular environment (15) have prohibited confident assignment of
[ Ca2+]i values to fluorescence signals. Although introduction of dye into cells in membrane-permeant [acetoxymethylester (AM) form] obviates the need for cell impalement, the additional problems of compartmentation
of dye into intracellular organelles (21, 28, 29) and incomplete hydrolysis of ester groups leaving fluorescent
but Ca2+-insensitive intermediates (20, 25) have further
confounded calibration.
Additional problems are encountered when calibration
of Ca2+-sensitive dyes in heart cells is attempted (10).
Spectral interference by fluorescent cellular components
such as NAD(P)H (16; K. Esumi, T. W. Smith, and J.
D. Marsh, unpublished observations) can occur. If pyridine nucleotide fluorescence changes during the course
of an experiment, incorrect estimates of the cellular
contribution to autofluorescence could lead to errors in
assigning Ca2+ values to fluorescence signals. Furthermore, freshly dissociated adult cells hypercontract when
[ Ca2+]i approaches levels sufficient to saturate fura2 ’ ,7 ’ -bis (2 -carboxyethyl)-5,6-carboxyfluoroscein;
lanthanum;
during calibration procedures (18). Hypercontracture
calcium
can, among other problems, lead to altered fluorescence
due to the cell changing shape and losing membrane
integrity (9) and has thus been a major impediment to
ACCURATE METHODS
for measuring intracellular Ca2+ reliable in situ calibration.
concentration ([Ca”‘];) and intracellular pH (pHi) in
We report a novel approach for calibrating the Ca2’living cells have long been sought. Among the many sensitive dye fura- and the pH-sensitive dye BCECF in
requirements for an ideal technique is the precise and adult rat ventricular cells using methods that prevent
reproducible calibration of the measurement device, prefthe hypercontracture into square and round forms freerably in the cell or system being measured and under quently seen with this model. For fura-2, the ability of
the same conditions as the preceding experiment. FluLa”+ to relax cardiac myocytes and produce fluorescence
orescent ion-selective dyes introduced into living cells changes in Ca2’ -sensitive indicators (22) has been exand calibrated in situ offer this potential advantage.
ploited. The in vitro spectra of Ca”+- and La3’-bound
However, since the advent of second-generation fluores- fura- were compared to define the relationship between
cent dyes for measuring cytosolic free Ca2+ (fura- and fluorescence intensity and each ion concentration. La3+
0363-6135/90
$1.50 Copyright
0 1990 the American
Physiological
Society
H973
H974
CALIBRATION
OF
FURA-
was then substituted for Ca2+ in a calibration
scheme
that allows an accurate determination
of ion-saturated
fura- fluorescence under conditions
where both cell
shape and energy status are preserved. In the case of
BCECF, a buffer that prevents shape change and obviates related artifacts has been devised.
MATERIALS
AND
METHODS
Fluorescence
measurements.
All measurements
were
performed in a Spex CM2 dual excitation spectrofluorimeter (Spex Industries, Edison, NJ). Fura-2-La3+ and
fura-2Ca2’
spectra were obtained in a quartz cuvette
placed in a thermostatically
controlled mount (rightangle mode) that maintained
temperature at 37°C with
continuous stirring. For fluorescence measurements
in
isolated and cultured cells, the cuvette was removed and
excitation light was allowed to pass through the cuvette
chamber into the rear port of an inverted epifluorescence
microscope (Nikon Diaphot-TMD,
Secaucus, NJ) specially fitted for ultraviolet
wavelengths (Nikon CFFluorDL x40, 0.85NA lens). A dichroic mirror suitable
for the specific fluorophore (400-nm cutoff for fura-2,
510-nm cutoff for BCECF) reflected the emission light
toward the side port and into a custom-built
spectral
separator (Rincon Industries, Santa Barbara, CA) that
contained a dichroic mirror (600-nm cutoff), band-pass
filter (500 t 5 nm for fura-2, 530 t 5 nm for BCECF,
Andover, Salem, NH) positioned before a photomultiplier tube (Hamamatsu
R268UH), and a CCD videocamera (Pulnix TM 540/560, Sunnyvale, CA), the light
path of which was at a right angle to the photomultiplier.
The configuration
of the spectral separator allowed red
phase-contrast illumination
of the cell to be separated
from the near-ultraviolet
fluorescence of the fura- or
BCECF, so that the cell image could be monitored continuously throughout
the experiment
on a television
monitor (Panasonic WV 5470, Garden City, NJ) and
recorded on videotape (Sony SL-HF360). The video image was also directed to a motion detector (Crescent
Electronics, Sandy, UT) with time resolution of 16.7 ms
so that the position of the edge of the cell during phasic
or tonic contractions could be recorded on a chart recorder (Gould 2200, Cleveland, OH). An adjustable aperture positioned between the spectral separator and the
microscope allowed adjustment of the field size to just
include a single cell; thus background fluorescence could
vary between experiments.
Cover slips with attached
cells were placed in a water-jacketed
chamber (37 t
0.5”C) on the light-shielded
stage of the microscope. Cells
were continually
superfused with buffer at a rate of 1
ml/min. Cells were field stimulated at variable rates with
a 3-ms square-wave pulse delivered through a platinum
electrode connected to a stimulator
(Grass model S44,
Quincy, MA). Only one experiment per cover slip was
performed.
For experiments in both the cuvette and microscope,
exposure to excitation light was limited to the time of
actual data collection by an electronically
controlled
shutter. In addition, to limit photobleaching,
a neutral
density filter (0.1 transmittance
for BCECF, 0.5 for fura2. Andover) was placed in the excitation
light path.
AND
BCECF
IN
MYOCYTES
Excitation wavelengths were selected from a 450-W xenon lamp by adjustable diffraction gratings and alternated by a four-position
rotating chopper wheel, the
speed of which was controlled by computer and dictated
by the chosen times of data accrual. For fura-2, excitation
wavelengths were 340 and 380 nm, and for BCECF, 490
and 450 nm. The bandwidth in all cases was 3.6 nm.
Fluorescence signals were normalized to lamp intensity
by a rhodamine reference standard.
For recording [ Ca2+]i transients, fluorescence emission
was collected from 340- and 380-nm excitation over 1 ms
at each wavelength, with 1 ms required for repositioning
the chopper. Photon counts from each wavelength were
then assigned to the same time value with an increment
every 3 ms, the effective time resolution. No averaging
of beats or continuous measurements
at single wavelengths were made. [Ca2+]; was determined in situ in each
cell utilizing Eqs. 1-3 below. [Ca2+]i transients were then
low-pass filtered at 100 Hz by data analysis software
(ASYST, Macmillan
Software, New York, NY) to decrease high-frequency noise. For fluorescence recording
during calibration protocols, data were collected every 3
s and not filtered.
Fura- excitation spectra. Excitation
spectra for fura2 and both Ca2+ and La3+ were obtained in a quartz
cuvette with 10 ,uM fura- pentapotassium
salt (Molecular Probes, Eugene, OR) in a buffer consisting of (in
mM) 110 KCl, 20 3-(N-morpholino)propanesulfonic
acid
(MOPS), 1.0 MgC12, and sucrose-mannitol
(3:1) in sufficient quantity to reach an osmolality of 300 mosmol/
kg as determined by an osmometer (Wescor). Buffer was
passed through an anion exchange column (Amberlite
MB-3, Sigma, St. Louis, MO) to reduce [Ca2+]i to -1 PM
as determined by Ca2+ -sensitive electrode (Orion, Cambridge, MA). CaC12 (100 mM standard reference solution,
Orion), MnC12, and LaC13 (Sigma, 100 mM stock solutions) were added directly to the cuvette and spectra
were measured.
2,3-Butanedionemonoxime
(BDM,
Sigma) was added to the cuvette as a solid. pH was
regulated by the addition of KOH or HCl and monitored
between spectra and adjusted when necessary after any
addition to the cuvette.
Preparation and dye loading of adult ventricular
cells.
Ca”+-tolerant
ventricular
cells were enzymatically
isolated from the hearts of adult female Sprague-Dawley
rats (250-350 g, Charles River) by methods previously
described (13). Briefly, hearts were perfused with a
Krebs-Henseleit
bicarbonate
buffer containing
nominally zero Ca2+, collagenase, and hyaluronidase. Ventricles were minced and incubated in the same buffer containing trypsin and 1 mM CaC12, and cells were released
by trituration
and sedimentation
in 2% bovine serum
albumin. Cells were stored at 23°C for up to 4 h in
superfusion buffer with the following composition
(in
mM): 4-N-2-hydroxyethylpiperazine-N’-2-ethanesulfonic acid (HEPES), 137 NaCl, 0.9 CaC12, 0.5 MgC12, and
5.6 glucose, pH 7.4 with NaOH at 37OC.
Cells were loaded with fura-2/AM by incubating 2 ml
of cell suspension (-5 x lo* cells/ml) with 0.1 ml of fura
stock solution (final fura-2/AM
concentration,
4.8 PM)
for 5 min at 23°C and then washed and attached to glass
CALIBRATION
OF
FURA-
cover slips coated with liquid collagen (Vitrogen, Collagen, Palo Alto, CA) and stored in the dark until use.
Furastock solution was prepared by mixing 0.5 ml of
1 mM fura-2/AM
(Molecular
Probes) reconstituted
in
dry dimethyl sulfoxide (DMSO) with 0.1 ml 25% (wt/wt)
Pluronic F127 in DMSO (Molecular
Probes) and 4.4 ml
fetal calf serum (FCS). The mixture was sonicated and
then stored at -70°C in aliquots until ready for use.
Cells were loaded with BCECF by first permitting cell
attachment to collagen-coated cover slips and then incubating the cover slips in superfusion buffer with 2 PM
BCECF/AM
(Molecular Probes) for 30 min at 23°C
followed by washing. BCECF/AM
stock solution was
prepared in dry DMSO at 1 mM concentration and kept
frozen in aliquots until use.
Culture and dye loading of neonatal ventricular cells.
Primary cultures from ventricles of l-day-old SpragueDawley rats (Charles River) were prepared by a modification of previously described methods (4). Briefly, ventricles were removed from ether-anesthetized rats and
minced, and cells were dispersed in 0.25% trypsin
(GIBCO) with 1 mM EDTA. Cell suspensions were
washed in Dulbecco’s modified Eagle’s medium (DMEM)
supplemented with 10% FCS and antibiotics (20 U/ml
penicillin, 20 ,ug/ml streptomycin and gentamicin) and
enriched with myocytes by preplating on loo-mm culture
dishes for 1 h at 37°C. Residual unattached cells were
diluted with the same medium and layered on 12-mm
circular glass cover slips in 24-well clusters at a density
of 4 x lo5 cells/cm2. The medium was changed on day 1
to DMEM with 7% FCS and thymidine (600 pg/ml) and
on day 2 to DMEM with insulin (5 pg/ml), transferrin
(5 pg/ml), and selenium (5 rig/ml) in the absence of FCS.
Cells were used for experiments after 1 or 2 days incubation in serum-free medium.
Cells were loaded with fura-2/AM by replacing incubation medium with 0.1 ml fura- stock solution as
formulated above in 2 ml of HEPES-buffered superfusion
medium for 20 min at 37°C. Cover slips with attached
cells were washed and stored in the dark at 37°C in
superfusion buffer until use.
Fura- calibration in cells. Calibration was performed
in quiescent adult ventricular cells without stimulation
and with stimulation at 1 Hz in cultured neonatal cells.
Adult myocytes were individually calibrated in situ by
sequential exposure to calibration buffers as follows: I,
standard superfusion buffer with substitution of 1 mM
ethylene glycol-bis(P-aminoethyl ether)-N,N,N’,N’-tetraacetic acid (EGTA) for CaC12 and the addition of 5
mM pyruvate for 30 s; II, buffer I with 10 PM ionomycin
for at least 5 min until a stable minimum signal was
achieved; and III, buffer II with the substitution of 1 mM
LaC& for EGTA for 2-3 min or until a stable maximum
was achieved. This process resulted in no change in cell
morphology as observed on the videomonitor.
Cultured neonatal cells were calibrated in situ identically, except that cation-saturated fura- fluorescence
was determined twice, first with buffer 111containing 1
mM CaC12instead of LaC13and then buffer 111containing
LaCIZ. Background fluorescence in both cell systems was
determined by measuring fluorescence from an adjacent
AND
BCECF
IN
H975
MYOCYTES
cell-free area of the cover slip; values for each excitation
wavelength were subtracted from the entire recording.
[Ca2+]; was determined by the equation of Grynkiewicz
et al. (12)
[Ca2+]; =
Kd
X
P(R
-
Rmin)/(Rmax
-
R)
(0
where Kd is the dissociation constant for fura-2-Ca2’ and
taken to be 224 nM (9, 12), p is the “scaling factor”
defined as the ratio of fluorescence at 380 nm with 0
) to saturating Ca2+ (&gomax)conditions, and
Ca2+
(F38Omin
R is the ratio of fluorescence obtained with excitation at
340 and 380 nm, with min and max subscripts denoting
the ratios obtained under Ca2+-free and Ca2+-saturating
conditions, respectively. To account for the fact that in
our system, maximum fluorescence was obtained with
La3+ rather than Ca2+, Eq. 1 was substituted with the
following equations defining two correction factors
R max,Ca
F 380max,Ca
=
Cl
x
Rmax
=
CX
x
F38Omax
, La
(2)
, La
(3)
are the ratios of fluorescence
where
Rmax,Ca
and
Rmax,La
at 340 and 380 nm obtained under saturating conditions
of Ca2+ and La3+, respectively; F380max,Ca
and F380max,La
are
the fluorescence values obtained at 380 nm under saturating conditions of Ca”’ and La3+, respectively; and C1
and C2 are the correction factors obtained from cuvette
experiments as described below.
We compared this calibration approach to two other
published methods for in situ calibration of fura- fluorescence. For the first alternative method, cells were
superfused with nominally Ca2+-free standard HEPES
buffer containing 40 mM BDM, followed by the same
buffer with the addition of 1 mM EGTA and 10 PM
ionomycin, and finally an identical buffer with 1 mM
Ca2+ substituted for EGTA (9). For the second alternative method, cells were “deenergized” by superfusion with
glucose-free HEPES buffer containing 3.3 mM amobarbital (Amytal) and 2 PM carbonyl cyanide m-chlorophenylhydrazone (CCCP) until the cell shortened to 6070% of resting length (-5 min) (18). The cell was then
exposed to buffer containing 0 glucose, 1 mM Ca2+, and
10 PM ionomycin and finally to an identical buffer with
1 mM EGTA substituted for Ca2’.
BCECF calibration in adult ventricular myocytes. Each
cell was individually calibrated in situ (6). Cells were
stimulated at 1.5 Hz until superfusion with EGTA (buffer
1). After 30 s of superfusion with buffer I, II or III
calibration buffers with differing pH were superfused for
2-3 min each until a steady fluorescence signal was
achieved. Background fluorescence was determined from
the blank cover slip and subtracted from fluorescence at
each wavelength. This calibration method produced no
change in cell shape. Calibration buffers differed from
the superfusion medium and contained 4 mM HEPESKOH, 120 mM KCl, 0.5 mM EGTA, 5 mM pyruvate, 5.6
mM glucose, 10 mM ATP-K, and the ionophores 20 PM
nigericin, 4 PM ionomycin, and 0.2 PM CCCP. pH was
adjusted at 37°C with KOH or HCl to 6.54, 7.27, and
7.75. pHi for each cell was then determined from a linear
regression of fluorescence ratio vs. the pH values of the
calibration buffers.
H976
CALIBRATION
OF
FURA-
Compartmentation
studies. Adult myocytes loaded with
fura- or BCECF were chemically skinned by superfusion
with a buffer that permeabilized the sarcolemmal
membrane but left organelles intact and the cell shape well
preserved (2, 28). This buffer was identical to that used
for determination
of Ca” and La3’ spectra with the
addition of 1 mM EGTA, 1 mM KHzP04-KzHP04,
10
mM succinate, 1 ,uM rotenone, 10 mM ATP-K,
and 10
PM digitonin. After release of furafrom the cytosol,
superfusion
was continued with the same buffer plus 1
mM Mn2+ and 10 PM ionomycin to quench fluorescence
from residual fura- within organelles. Calculations
were
made from fluorescence monitored at 359 t 1.8 nm for
fura-2loaded
cells (the isosbestic wavelength)
and at 450
t 1.8 nm in BCECF-loaded
cells (pH insensitive
and
nearly isosbestic).
Statistical analysis. Results are expressed as means t
SD. Linear regression analysis was performed by standard formulas. Means were compared with one-way analysis of variance for repeated measures.
AND
BCECF
IN
MYOCYTES
1. Maximum and minimum fluorescence
ratios (340-to-380 nm excitation)
TABLE
Cells
Cuvette
imin
R max9
R max9
Ca
La
Control
BDM
Adult
180.60
35.8"
82.4
2
0.94
16.6
140.71
In Situ
Neonatal
50.64
2.12
4.92
4.41
Cuvette
values were derived from excitation
spectra as shown in Fig.
2. Values for cells were derived from in situ calibration
experiments
as
described
in the text. Excitation
bandwidth
was 3.6 nm. Emission
was
505 t 3.6 nm for cuvettes
and 500 t 5 nm for cells. R, fluorescence
ratio. * n = 4.
RESULTS
Fura- spectra and calculation of La3+ calibration constants. Figure 1 shows excitation spectra for fura- salt
after additions of Ca2+,Mn2+, and La3+. La3+ fluorescence
was hyperchromic at 340 nm and hypochromic at 380
nm relative to Ca2+; this was observed regardless of
whether La3+ or Ca2+ was first added to the cuvette.
Increasing [La3+] to X0 PM had no effect on fura-2La”+ spectra. The peak fluorescence intensity observed
with La3+ occurred at 332 nm, compared with 338 nm
seen with Ca2+, in accord with a similar observation for
the indo-l-La3+ spectra (22). Mn”+ quenched fura-2-La”+
fluorescence -25% when present in lo-fold molar excess;
equimolar addition of Mn2+ to fura-2-Ca2+ quenched
fluorescence completely.
Analysis of these spectra allowed the calculation of the
ratio of fluorescence at 340 to 380 nm under saturating
[Ca2+] (0.9 mM) and [La3+] (1 mM) conditions (Table
1). The ratios were relatively insensitive to changes in
pH, although fura-2-La3+ spectra were more affected
300
320
340
Wavelength
360
380
400
[nm]
FIG. 1. Excitation
spectra of fura-2-Ca2+
and fura-2-La37
Spectra
were obtained
in MOPS-containing
buffer
in a cuvette
with 10 PM
fura-2.
Sequential
additions
were made with final concentrations
of
first 0.9 mM Ca2+ (solid line) and then 10 ,uM La3+ (dashed
line),
followed
by 1 mM Mn2+ (dotted
line). La3’ additions
up to 1 mM
produced
an identical
spectrum
to that for 10 PM La3+.
0
300
1
320
340
Wavelength
360
380
4:o
[nm]
FIG. 2. Fura-2-Ca2’
spectra with and without
BDM.
Spectra were
obtained before (solid lines) and after (broken
lines) addition
of 40 mM
BDM to cuvette containing
MOPS
buffer and 10 PM fura-2. For both
conditions,
spectra with larger peaks were obtained
with addition
of 1
mM Ca2+, and spectra with smaller peaks and marked
(*) were obtained
after the addition
of 1 mM EGTA.
than fura-2-Ca2’ spectra. Solving Eq. 2, the first derived
constant (Cl) relating the ratio (R,,,) of Ca2+- to La3+saturated fluorescence is 0.434 t 0.033 (n = 4). C2 was
similarly determined from fluorescence at 380 nm in the
presence of saturating Ca2+ and La3+ and found to be
1.99 t 0.09 (n = 4).
The effect of BDM, a compound that uncouples myocyte excitation and contraction, on fura-2-Ca2+ spectra
is shown in Fig. 2. Under both Ca2+-saturated and 0 Ca2+
conditions, BDM decreased fluorescence intensity and,
under Ca2+-saturated conditions, shifted peak fluorescence from 340 to 350 nm. BDM had little effect on the
isosbestic point of fura-2-Ca2+ spectra (362 nm before
and 360 nm after BDM addition). To determine whether
the decrease in fluorescence intensity caused by BDM is
uniform regardless of whether fura- is bound to Ca2+or
free, the 340-to-380 nm ratios for the spectra in Fig. 2
are displayed in Table 1. BDM decreased the 340-to-380
nm ratio to varying degrees as the concentration of Ca2’
and therefore degree of fura-2Ca2+ binding changed.
In situ calibration of fura- fluorescence in adult myocytes. Calibration of fura- fluorescence within adult
myocytes was performed using the three methods designed to prevent hypercontracture
as outlined above.
Fura- fluorescence was first calibrated using BDM to
prevent cellular shortening (Fig. 3A). With the onset of
BDM superfusion, both 340- and 380-nm signals fell in
intensity, representing parallel changes in fluorescence
CALIBRATION
A
OF
FURA-
1
BDM,
“0”
Ca
BDM,
I
EGTA, iono
BDM,
Ca, iono
1
I
380
II
5
0
II
10
Time
II
15
[min]
m
t
0
1
I
2.5
5.0
Time
7.5
[min]
~~
0.0
EGTA
EGTA, iono
I
1
La, ion0
I
2.5
5.0
Time
7.5
10.0
[ min]
FIG. 3. Calibration
of furafluorescence
from adult ventricular
myocytes.
Fluorescence
at 500 t 5 nm is shown for excitation
at 340
and 380 nm (3.6-nm bandwidth).
Background
autofluorescence
of cover
slip and optical
system has been subtracted.
Changes
in superfusion
buffer were made as indicated
at arrows.
A: calibration
using BDM
method.
Cell length
was unchanged
throughout
the course of the
experiment.
I?: calibration
using “deenergization”
scheme showing
fluorescence
signals (top) and length measurement
recorded
simultaneous (bottom).
At 2nd arrow, cell was observed
to shorten
to 61% of
its resting
length.
C: calibration
using La3+ method
is shown for a
typical cell. Cell length was unchanged
throughout
experiment.
that were independent of [Ca2+]i. After the decrease in
both signals, subsequent superfusion with BDM-containing buffers with EGTA-ionomycin
and Ca2+-ionomycin
produced changes directionally opposite in 340- and 380nm signals and were therefore likely to represent changes
in [Ca”‘].
For comparison, intracellular fura- fluorescence was
calibrated with the deenergization method of Li et al.
AND
BCECF
IN
MYOCYTES
H977
(18) (Fig. 3B). [Ca2+]i-independent changes were seen
when the 340- and 380-nm signals rose together (1st
arrows) with the onset of amobarbital-CCCP superfusion. The cell then shortened slightly as the 380-nm
signal fell and 340-nm signal rose, consistent with rising
[Ca2+]i. A second [Ca”‘] -independent change was seen
when the cell shortened to the square form (Fig. 3B, 2nd
arrows); the 380-nm signal dipped slightly before it continued to rise, and the 340-nm signal fell rapidly.
The effect of the La3+ calibration method was examined for [Ca2+]-independent changes in the fura- signal.
When fura- fluorescence was calibrated using La3+ (Fig.
3C), the 340- and 380-nm fluorescence signals changed
simultaneously and in opposite directions when cells
were subjected to the buffers designed to change the
degree of Ca2+ or La3+ binding to the fura- present in
the cytosol. No parallel [Ca”‘] -independent changes in
the two signals were seen. When the minimum and
maximum ratios (Table 1) were used with Eqs. 1-3,
[Ca2+]; in 14 cells was found to be 131 t 47 nM.
To determine whether exposure to the calibration buffers changed cellular autofluorescence, control experiments in cells not loaded with fura- and subjected to
the same sequence of calibration buffers were performed.
Flat signals in both 340- and 380-nm channels with ~5%
variation in fluorescence intensity throughout the course
of the experiment were observed. Other control experiments in fura-2-loaded cells superfused with standard
superfusion buffer rather than the calibration solutions
showed 340- and 380-nm fluorescence to decline slightly
over time required for calibration (about 12 min) without
appreciable change in the 340-to-380-nm fluorescence
ratio.
In situ calibration of fura- fluorescence in cultured
neonatal myocytes. Fura- fluorescence was calibrated in
cultured neonatal cells using first Ca2+- and then La3+containing buffers in sequence in an attempt to verify
the accuracy of the La3+-calibration constants C1 and C2
that were determined in the cuvette (above and Fig. 1).
Perhaps because of their firmer attachment, neonatal
cells exposed to high [Ca2+]i do not hypercontract as
readily as adult myocytes. Figure 4 and Table 1 show the
results of calibration in neonatal cells exposed to EGTA
followed by Ca2+ and then La3+. This protocol allowed
calculation of [Ca2+]i in two ways, using only Eq. 1 and
Ca2+-saturated fluorescence for determination of R,,, ca
and using Eqs. 1-3 plus constants C, and C2 and La’+saturated fluorescence for determination of RmaxLa.In
these cells stimulated at 1 Hz (Fig. 4), the time-averaged
values for [Ca2+]; were 500 nM using Ca2+-saturated
fluorescence for R,,, and 520 nM using La3+-saturated
fluorescence plus C, and C2. In five experiments, calibration with Ca2+-saturated fluorescence yielded 417 t 116
nM, and calibration with La3+-saturated fluorescence
yielded 406 t 90 nM (F = 0.03, P = 0.871) for timeaveraged [Ca2+]; in cells stimulated at 1 Hz.
[Ca2+Ji transients in adult ventricular
myocytes.
[Ca2+]i transients were recorded from a fura-Sloaded
myocyte stimulated at 1 Hz and calibrated by the La3+
method (Fig. 5). In this representative cell, systolic
[Ca2+]i averaged over eight beats was 911 t 86 nM and
H978
CALIBRATION
I
I
OF
FURA-
EGTA, iono
Ca2+
La3+I
t
t
t
AND
BCECF
IN
MYOCYTES
7.95
7.27
8.5
.- 0
-P
t
7.65
340
380
6.75
t washout
01
0
II
II
I
2
4
6
0
3
9
6
12
15
Time [min]
Time
[min]
FIG. 4. Calibration
of furafluorescence
in cultured
neonatal
ventricular
myocytes.
Furafluorescence
was collected
under identical
conditions
as those shown in Fig. 3. Calibration
was performed
by
sequential
superfusion
with ionomycin-containing
buffers
and either
EGTA,
Ca’+, or La3’.
6. Calibration
of a BCECF-loaded
myocyte.
Fluorescence
was
collected
at 530 t 10 nm for excitation
at 490 and 450 nm (3.6-nm
band pass); these signals were divided
after background
subtraction,
and ratio is shown on left ordinate.
Cell was exposed to 10 mM NH&l
at 1st arrow; washout
occurred
at 2nd arrow.
Superfusion
with 3 pHtitrated
calibration
buffers
is shown. pH values determined
by linear
regression
of buffer
pH with fluorescence
ratio are shown on right
ordinate.
FIG.
‘200/
Y
c
I
800
0
Time
[set]
FIG. 5. Ca2+ transients
recorded
from a fura-%loaded
myocyte
stimulated at 1 Hz. Fluorescence
at 500 & 5 nm was collected
from 340and 380-nm
excitation
at 3-ms intervals
and calibrated
in situ using
La3+ method.
After
background
subtraction,
fluorescence
ratio was
converted
to [ Ca2+];, filtered
at 100 Hz, and plotted
with [ Ca2+]; as
ordinate.
end-diastolic [ Ca2+]; was 108 t 8 nM. In five cells identically calibrated, the mean systolic [Ca2+]i was 1,088 t
211 nM and end-diastolic [Ca2+]; was 140 t 56 nM.
In situ calibration of BCECF fluorescence in adult
ventricular myocytes. BCECF fluorescence was calibrated
within BCECF-loaded myocytes. For the cell shown in
Fig. 6, in response to 10 mM NH&l, pHi rose from 7.02
to 7.33, and upon washout, pHi fell to 6.85. The cell was
then exposed to three calibration buffers (pH 6.54, 7.27,
and 7.75), and pHi was determined as described above.
External buffer pH was linearly related to fluorescence
ratio (r = 0.999, P = 0.028) over the range examined.
The cell maintained its rod-shaped morphology throughout the calibration procedure. Control experiments in
cells not loaded with BCECF showed absolute levels of
fluorescence intensity that were ~3% of that present in
loaded cells at both the 490- and 450-nm excitation. In
12 cells calibrated similarly, the pHi of cells stimulated
at 1.5 Hz was determined to be 7.10 t 0.10. We observed
no hysteresis effect of external pH buffers on fluorescence ratio when the order of exposure to high, middle,
and low pH calibration buffers was changed.
Dye compartmentation in adult myocytes. To assessthe
0
5
10
15
20
Time [min]
FIG. 7. Chemical
skinning
of fura-2and BCECF-loaded
myocytes.
Separate
experiments
are shown for fura-2and BCECF-loaded
myocyte. Excitation
is at 359 t 1.8 nm for fura-Zloaded
cell and 450 nm
& 1.8 nm for BCECF-loaded
cell. Ordinate
has been scaled to show
same level of fluorescence
intensity
at beginning
of both experiments.
While both cells were exposed to digitonin
(10 PM; see MATERIALS
AND
METHODS),
only fura-2-loaded
cell was subsequently
exposed to 1 mM
Mn2+ and 10 PM ionomycin.
Background
fluorescence
has been subtracted
from both recordings
as determined
by fluorescence
of cover
slip alone adjacent to cell.
extent of compartmentation of fura- and BCECF within
intracellular organelles, cells were chemically “skinned”
by exposure to digitonin (2, 28). In fura-Sloaded cells,
we identified three components of fluorescence after
subtraction of background (Fig. 7). Fluorescence was
measured with excitation wavelength of 359 nm, which
is the isobestic point for fura- in ventricular cells. The
first and largest component of fluorescence was released
by 10 PM digitonin in a biphasic manner and accounted
for 70.8 t 3.9% (n = 3) of total fluorescence. The second
component was quenched by the addition of 1 mM Mn2+
and 10 PM ionomycin and accounted for 20.8 t 4.7% (n
= 3) of fluorescence. The third component represented
the difference between remaining fluorescence (presumably cellular constituents) and background (from the
cover slip and system) and accounted for 8.4 t 1.0% (n
= 3) of fluorescence.
In BCECF-loaded myocytes, fluorescence measure-
CALIBRATION
OF
FURA-
ments were made at 450 nm, a wavelength
showing little
change with pHi. In contrast
to the release of fura-2,
fluorescence in BCECF-loaded
cells showed only a rapid
decline after exposure to digitonin that accounted for
92.2 t 1.5% (n = 3) of total fluorescence.
A digitonininsensitive component, representing
7.8 t 1.5% (n = 3)
of total fluorescence, was the compartmentalized
dye and
cellular autofluorescence
remaining before background
subtraction.
DISCUSSION
In vitro calibration
of a fluorescent
dye requires the
generation of a standard curve relating fluorescence intensity to the concentration
of the ion studied. An important assumption
is that dye behavior is identical in
calibration buffers and cells (12). Even if ratio spectroscopy is used to minimize the effects of such variables as
variations in path length, motion, nonuniform
dye concentrations,
light scattering,
and variable illumination
(6), buffers cannot be assumed to completely represent
the intracellular
environment.
Moreover,
studies comparing in vitro with in situ standard calibration
curves
in muscle fibers (14), cells (25), and isolated mitochondria (24) have shown different
relationships
between
fluorescence
ratio and ion concentrations
resulting
in
discrepant calculations
of [Ca2+]i and pHi. Several studies have found that properties
of furainjected into
muscle fibers in its salt form are not those expected from
cuvette measurements
with regard to diffusion (15), protein binding (15), and Ca2’ association and dissociation
rates (14). Similarly, when furawas loaded into cells
in its AM form, its fluorescence
was not reliably described by in vitro calibration
buffers
(10, 18), but
[ Ca2+]i could be calculated if calibration
was accomplished in situ (21, 25).
In situ calibration of fura- fluorescence. Several in situ
calibration
methods have been proposed to avoid the
hypercontracture
problem unique to adult ventricular
cells. One method employs BDM, an agent that purportedly uncouples
excitation
from contraction
by direct
interaction with actin and myosin. Cheung et al. (9) have
reported that BDM allowed saturation
of fura- by Ca2+
while rat ventricular
cells were maintained in their rod
shape. However,
we found that BDM altered spectral
properties of fura- by both attenuating the fluorescence
signal and red shifting the peak excitation
wavelength
(Fig. 2, Table 1), possibly by the inner filter effect (17),
and produced
[ Ca2+]i-independent
changes in cellular
fluorescence (Fig. 3A). In the report of Cheung et al. (9),
fluorescence
during calibration
was measured intermittently by digital imaging rather than continuously
by
photon counting as in our system, so the [Ca”‘] -independent changes may have been missed.
A second method of preventing hypercontracture
during in situ calibration
was described by Li et al. (18).
This method involves exposure of the cell to a deenergizing combination
of amobarbital
and CCCP to produce a
partial square form of hypercontracture
that is resistant
to further shortening
into the round form, thereby permitting determination
of Ca2+-saturated
furafluorescence. However,
we found that this protocol changed
AND
BCECF
IN
MYOCYTES
H979
furafluorescence
in a [ Ca2+];-independent
manner
(Fig. 3B), both with the onset of superfusion
with amobarbital and CCCP and after -5 min, when the cell
shortened.
Fura-La3+ fluorescence properties.
The present study
has demonstrated
that the affinity of La3+ for fura- was
higher than that of Ca2+ (Fig. 1), since La3+-saturated
furafluorescence
did not increase for concentrations
of La3+ >lO PM, the same concentration
as fura- present
in the cuvette (Fig. I), whereas, for Ca2+, concentrations
of the cation far in excess of the fluorophore
were required. Furthermore,
although Mn2+ showed a Q-fold
preference over Ca2+ for fura- and quenched its fluorescence (12), Fig. 1 shows that Mn2+ quenched only 25%
of furafluorescence
when present in lo-fold greater
concentration
than La3+, suggesting that furahad a
greater affinity for La3+ than Mn2+. If comparable properties are assumed for furaand indo-l, these findings
are in agreement with those of Peeters et al. (22).
In situ calibration with the La3+ method. After finding
that in situ calibration with the La3+ method prevented
hypercontracture
and avoided the [ Ca2+] -independent
changes seen with other methods (Fig. 3), the applicability of the calibration factors to the intracellular
environment was confirmed in neonatal ventricular
myocytes,
which are resistant to hypercontracture
(Fig. 4). When
[Ca2+]i was calculated with the La3+ method in neonatal
myocytes, the results were quite similar to [Ca2+]; calculated by standard methods (12, 25) in the same cells
using Ca2+ as the saturating
cation: 406 t 90 nM for
La3+ and 417 & 116 nM for Ca2’. Although differences
may exist in the intracellular
environment,
La3+ calibration in adult cells should be similar to neonatal myocytes,
since the La3+-saturated
fluorescence
ratio was comparable in both cell types (Table 1). Maximum fluorescence
ratios in situ were lower than cuvette measurements
in
part because glass cover slips attenuated light at 340 nm
and in part because of alterations
of dye properties
in
the intracellular
environment
(9).
Values for [Ca2+/i using the La”+ calibration method.
The [Ca2+]i values of 131 nM in quiescent cells and in
cells stimulated
at 1 Hz, 1,088 nM systolic/l40
nM
diastolic, are compared with values for adult rat ventricular cells reported by other investigators
(Table 2). Our
measurements
yielded values that are concordant
with
[Ca2+]; determined
by a variety of other approaches.
However, the La3+ calibration
method relies on a value
for the fura-2-Ca2+ equilibrium constant that was experimentally determined under in vitro conditions
(9, 12).
Since the net effect of myoplasm
on the equilibrium
constant in our system at 37°C cannot be determined
due to progressive
shortening
of the cell as [ Ca2+]i is
raised, the calculated values for [ Ca2+]; we report may be
in error to the extent that the value used for &, 224 nM,
is incorrect.
Intracellular
dye compartmentation.
A problem with
any study in which fluorescent
probes are loaded into a
cell by the widely used approach of introducing
dye into
cells by diffusion of its AM form is intracellular
compartmentation.
The La3+ technique can be used in myocytes injected with the salt form of dye, with which
H980
CALIBRATION
OF
FURA-
2. Comparisons
of [Ca’+Ji measurements
in isolated adult rat ventricular cells
TABLE
Ref.
No.
3
7
8
9
Cell
TYPe
Calibration
Method
31
This paper
Single
Single
Single
Single
Single
Single
Single
Single
Single
In
In
In
In
In
In
In
In
In
13
Suspension
In
23
26
Suspension
Suspension
In
In
1
Single
Single
In
In
10
18
19
27
Furavitro
vitro
vitro
vitro
vitro
situ
situ
vitro
situ
Indo-l
vivo
Quin2
vivo
vivo
Aequorin
vivo
vivo
Quiescent
[Ca”‘]i,
nM
-75
90+6-100
90t6
93t12
Systolic
[ Ca”];,
nM
500
213t23
-1,000
112t14
125 (70-200)
134+43
131I47
1,088*211
47t16
137t3
181t18
195t8
-250
(145-259)
Values for [ Ca2+]; are means t SD with ranges in parentheses.
In
vitro refers to calibration
by Ca2’- EGTA buffers and in situ to calibration within an individual
cell or suspension.
For details see text.
compartmentation would not likely be a problem.
Releasing cytosolic contents with low concentrations
of digitonin is well established in cardiac myocytes (2,
11,28). Dye remaining after digitonin treatment presumably represents dye sequestered predominantly in mitochondria; this organelle was found by other investigators
to be the site of sequestration of Ca’+-sensitive dyes in
adult myocytes (28) and in neonatal rat ventricular cells
viewed by digital imaging (11, 29). Spurgeon et al. (28)
recently showed that in indo-l-loaded myocytes, a digitonin treatment similar to ours released 82% of lactate
dehydrogenase, whereas 98% of citrate synthase remained. This suggests that digitonin acts selectively on
the sarcolemma and that an estimate of mitochondrial
dye is conservative, since 18% of cytosolic contents presumably remains after digitonin.
Because fluorescence from mitochondria would not be
expected to oscillate with systole and diastole, this contribution to the fluorescent signal would tend to dampen
the maximum and minimum fluorescence attributable to
Ca2+ interacting with cytosolic fura- throughout the
cardiac cycle. The values that we report for [Ca’+]; in
ventricular myocytes may therefore underrepresent systolic [Ca’+]; and may underestimate or overestimate diastolic and resting [ Ca’+]i, depending on the degree to
which [Ca”‘] in organelles differs from cytoplasm. Nevertheless, introduction of fura- in the AM form to estimate
[Ca’+]; remains a valid approach, subject to these quantitative considerations.
Our estimates of systolic [Ca’+]; may misrepresent the
actual value for two other reasons. First, [Ca’+]; transients have been filtered at 100 Hz, which dampened the
peak systolic values of [Ca’+]; slightly. Second, the kinetics of the fura- and Cazf interaction are not precisely
known and may not sufficiently resolve the rapid release
and reuptake of Ca2+ during a twitch (15).
Another concern with the use of AM forms of dye for
loading into cells is the problem of Ca’+-insensitive but
AND
BCECF
IN
MYOCYTES
fluorescent species of partly hydrolyzed dye. Our approach to account for the possible presence of these forms
in myocytes has been to employ in situ calibration. An
early report using indo-l in endothelial cells showed that
ratio spectroscopy failed to correct for partly hydrolyzed
indo-l/AM
and gave erroneous [Ca’+]; values (20) in
cells loaded for 90 min at 37°C. However, more recent
reports have suggested that the combination of shorter
loading times at room temperature (21), plus in situ
calibration (25), can account for partly hydrolyzed fluorescent dye forms and yield correct [ Ca’+]; values.
Calibration of BCECF fluorescence in ventricular cells.
The method described in this report for calibration of
BCECF fluorescence avoided hypercontracture
of the
cell. NADH fluorescence has less overlap with BCECF
than with fura- and most likely did not contribute
substantially to total fluorescence. In BCECF-loaded
cells, the fluorescence ratio was found to be linearly
related to pHi in the range studied (Fig. 6 and Ref. 9).
The value of 7.10 in myocytes stimulated at 1.5 Hz in
HEPES-buffered medium is slightly lower than the values of 7.16 determined in single rat ventricular cells (11)
and 7.16 in ventricular cells in suspension (30). Neither
of these studies reported mean pHi values for contracting
myocytes, an energy-requiring process which has been
reported to reversibly lower the pH of isolated Purkinje
fibers (5). Furthermore, in the former report (11) shape
change was not discussed, and in the latter, an in vitro
calibration curve was used and the contribution of dead
or rounded cells to average pHi was not determined (30).
With our method of loading BCECF into ventricular
cells, >92% of fluorescence is released by digitonin (Fig.
7) and therefore appears to arise from cytoplasmic
BCECF, making the potential error in pHi measurement
due to compartmentation relatively small.
Summary and conclusions. The methods reported in
this study for calibrating fura- and BCECF fluorescence
in adult ventricular cells allow for reproducible in situ
calibration of the fluorescence signal and avoid several
pitfalls encountered with other calibration methods. The
use of La3+ for fura- fluorescence calibration is a novel
technique permitting in situ calibration of fura- in
individual myocytes while limiting changes in Ca2+-independent fluorescence caused by hypercontracture and
pyridine nucleotides. With this technique, a valid estimate of [ Ca’+]; can therefore be made both in cells loaded
with fura-2/AM and in cells injected with the fura- dye
salt as well.
We thank Mary
O’Neill
and Stephanie
Murphy
for excellent
technical assistance,
Thomas
W. Smith MD for advice and support,
and
Paula McColgan
for typing the manuscript.
This study was supported
in part by National
Heart,
Lung, and
Blood Institute
Grants HL-35781,
HL-26215,
and HL-36141
and grants
from Paul-Martini-Stiftung,
Bonn, FRG (to B. K. Kramer),
the American Heart
Association,
Massachusetts
Affiliate
(to Y. Matoba),
and
the Pharmaceutical
Manufacturers
Association
(to R. A. Kelly).
Address
for reprint
requests:
M. Reers, Cardiology
Div., Brigham
and Women’s
Hospital,
75 Francis
St., Boston,
MA 02115.
Received
2 November
1989; accepted
in final
form
24 April
1990.
CALIBRATION
OF
FURA-
AND
REFERENCES
1. ALLSHIRE,
A., H. M. PIPER, K. S. R. CUTHBERTSON,
AND P. H.
COBBOLD. Cytosolic
free Ca”+ in single rat heart cells during anoxia
and reoxygenation.
&o&em.
J. 244: 381-385,1987.
2. ALTSCHULD,
R. A., W. C. WENGER,
K. G. LAMKA, 0. R. KINDIG,
C. C. CAPEN, V. MIZUHIRA,
R. S. VANDER
HEIDE,
AND G. P.
BRIERLY.
Structural
and functional
properties
of adult rat heart
myocytes
lysed with digitonin.
J. BioZ. Chem. 260: 14325-14334,
1985.
3. BERLIN,
J. R., M. B. CANNELL,
AND W. J. LEDERER.
Cellular
origins of the transient
inward current
in cardiac myocytes:
role of
fluctuations
and waves of elevated
intracellular
calcium.
Circ. Res.
65: 115-126,
1989.
4. BLOCH, K. D., J. G. SEIDMAN,
J. D. NAFTILAN,
J. T. FALLON,
AND
C. F. SEIDMAN.
Neonatal
atria and ventricles
secrete atria1 natriuretic factor via tissue-specific
secretory
pathways.
CelZ 47: 695702, 1986.
5. BOUNTRA,
C., K. KALIA,
AND R. D. VAUGHN-JONES.
Effect of
repetitive
activity
upon intracellular
pH, sodium and contraction
in sheep cardiac Purkinje
fibers. J. Physiol.
Lond. 398: 341-360,
1988.
6. BRIGHT, G. R., G. W. FISHER, J. ROGOWSKA,
AND D. L. TAYLOR.
Fluorescence
ratio imaging microscopy:
temporal
and spatial measurements
of cytoplasmic
pH. J. Cell Biol. 98: 717-724,
1984.
7. CALLEWAERT,
G., L. CLEEMAN,
AND M. MORAD.
Epinephrine
enhances Ca” current-regulated
Ca2+ release and Ca” reuptake
in
rat ventricular
myocytes.
Proc. Natl. Acad. Sci. USA 85: 20092013,1988.
8. CANNEI,L,
M. B., J. R. BERLIN,
AND W. J. LEDERER.
Effect of
membrane
potential
changes on the calcium transient
in single rat
cardiac muscle cells. Science Wash. DC 238: 1419-1423,
1987.
9. CHEUNG,
J. Y., D. L. TILLOTSON,
R. V. YELAMARTY,
AND R. C.
SCADUTO, JR. Cytosolic
free calcium in individual
cardiac myocytes
in primary
culture.
Am. J. Physiol.
256 (Cell Physiol.
25): Cll20Cll30,1989.
10. EISNER, D. A., C. G. NICHOLS,
S. C. O’NEILL,
G. L. SMITH,
AND
M. VALDEOLMILLOS.
The effects of metabolic
inhibition
on intracellular calcium and pH in isolated rat ventricular
cells. J. Physiol.
Lond. 411: 393-418,1989.
11. GORES, G. J., A.-L. NIEMINEN,
J. M. BOND, B. HERMAN,
AND J.
J. LEMASTERS.
Subcellular
compartmentation
of furaand
BCECF
loaded as acetoxymethyl
esters into hepatocytes
and myocytes (Abstract).
Int. Conf. Video Microsc.
Chapel Hill NC 1989.
12. GRYNKIEWICZ,
G., M. POENIE, AND R. Y. TSIEN. A new generation
of Ca2+ indicators
with greatly
improved
fluorescence
properties.
J. Biol. Chem. 260: 3440-3450,
1985.
13. HAWORTH,
R. A., A. B. GOKNUR,
D. R. HUNTER,
J. 0. HEGGE,
AND H. A. BERKOFF.
Inhibition
of calcium influx in isolated adult
rat heart cells by ATP depletion.
Circ. Res. 60: 586-594,
1987.
14. KLEIN,
M. G., B. J. SIMON,
G. Szucs,
AND M. F. SCHNEIDER.
Simultaneous
recording
of calcium
transients
in skeletal
muscle
using high- and low-affinity
calcium
indicators.
Biophys.
J. 53:
971-988,
1988.
15. KONISHI,
M., A. OLSON, S. HOLLINGWORTH,
AND S. M. BAYLOR.
Myoplasmic
binding of furainvestigated
by steady-state
fluores-
16.
17.
18.
19.
20.
21.
22.
23.
24.
25.
26.
27.
28.
29.
30.
31.
BCECF
IN
MYOCYTES
H981
cence and absorbance
measurements.
Biophys.
J. 54: 1089-1104,
1988.
KORETSKY,
A. P., L. A. KATZ, AND R. S. BALABAN. Determination
of pyridine
nucleotide
fluorescence
from the perfused
heart using
an internal
standard.
Am. J. Physiol. 253 (Heart
Circ. Physiol. 22):
H856-H862,
1987.
LAKOWICZ,
J. R. Principles
of Fluorescence
Spectroscopy.
New
York: Plenum,
1983, p. 43-49.
LI Q., R. A. ALTSCHULD,
AND B. T. STOKES. Quantitation
of
intracellular
free calcium
in single adult cardiomyocytes
by furafluorescence
microscopy:
calibration
of furaratios.
Biochem.
Biophys.
Res. Commun.
147: 120-126,
1987.
LI, Q., R. A. ALTSCHULD,
AND B. T. STOKES. Myocyte
deenergization and intracellular
free calcium dynamics.
Am. J. Physiol. 255
(CeZZ Physiol.
24): Cl62-C168,
1988.
LUCKHOFF,
A. Measuring
cytosolic
free calcium
concentration
in
endothelial
cells with indo-1:
the pitfall
of using the ratio of 2
fluorescence
intensities
recorded
at different
wavelengths.
Cell
Calcium 7: 233-248,
1986.
MALGAROLI,
A., D. MILANI,
J. MELDOLESI,
AND T. POZZAN.
Fura2 measurement
of cytosolic
free Ca2+ in monolayers
and suspensions of various types of animal cells. J. Cell. Biol. 105: 2145-2155,
1987.
PEETERS, G. A., 0. KOHMOTO,
AND W. H. BARRY. Detection
of
La”’ influx
in ventricular
cells by indo-l
fluorescence.
Am. J.
Physiol. 256 (Cell Physiol.
25): C351-C357,
1989.
POWELL,
T., P. E. R. TATHAM,
AND V. W. TWIST. Cytoplasmic
free calcium
measured
by quin-2 fluorescence
in isolated
ventricular myocytes
at rest and during
potassium
depolarization.
Biochem.
Biophys.
Res. Commun.
122: 1012-1020,1984.
REERS, M., R. A. KELLY, AND T. W. SMITH. Calcium
and proton
activities
in rat cardiac mitochondria:
effect of matrix environment
on behavior
of fluorescent
probes. Biochem.
J. 257: 131-142,1989.
SCANLON,
M., D. A. WILLIAMS,
AND F. S. FAY. A Ca2+-insensitive
form of furaassociated
with polymorphonuclear
leukocytes.
J.
Biol. Chem. 262: 6308-6312,
1987.
SHEU, S.-S., V. K. SHARMA,
S. P. BANERJEE.
Measurement
of
cytosolic
free calcium
concentration
in isolated
rat ventricular
myocytes
with quin2. Circ. Res. 55: 830-834,
1984.
SNOWDOWNE,
K. W., R. J. ERTEL, AND A. B. BORLE. Measurement
of cytosolic
calcium with aequorin
in dispersed rat ventricular
cells.
J. Mol. Cell. Cardiol.
17: 233-241,
1985.
SPURGEON,
M. A., M. D. STERN, G. BAARTZ, S. RAFFAELI,
R. L.
HANSFORD,
A. TALO, E. G. LAKATTA,
AND M. C. CAPOGROSSI.
Simultaneous
measurement
of Ca2’ contraction,
and potential
in
cardiac myocytes.
Am. J. Physiol.
258 (Heart
Circ. Physiol.
27):
H574-H586,
1990.
STEINBERG,
S. F., J. P. BILEZIKIAN,
AND Q. AL-AWQATI.
Furafluorescence
is localized
to mitochondria
in endothelial
cells. Am.
J. Physiol. 253 (Cell Physiol.
22): C744-C747,
1987.
WALLERT,
M. A., AND 0. FROHLICH.
Na’-H’
exchange
in isolated
myocytes
from adult rat heart. Am. J. Physiol.
257 (Cell Physiol.
26): C207-C213,1989.
WIER, W. G., M. B. CANNELL,
J. R. BERLIN, E. MARBAN,
AND W.
J. LEDERER.
Cellular
and subcellular
heterogeneity
of [Ca2+]; in
single heart cells revealed
by fura-2.
Science Wash. DC 235: 325328, 1987.


© Copyright 2026