
ESTIMATES OF THE EROSION RATES ON MARS OVER TIME AND
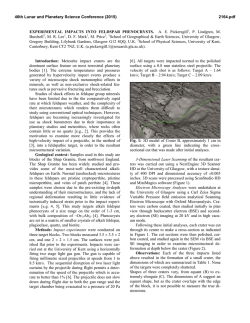
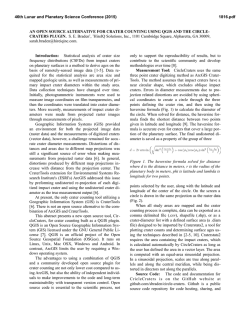
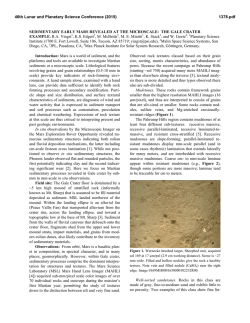
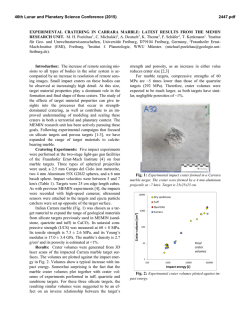
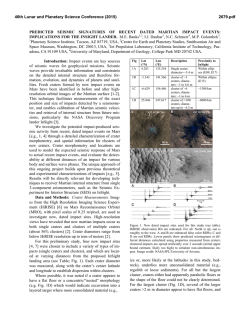
46th Lunar and Planetary Science Conference (2015)
1990.pdf
ESTIMATES OF THE EROSION RATES ON MARS OVER TIME AND THEIR IMPLICATIONS FOR
THE EVOLUTION OF THE ATMOSPHERE. C. Quantin1, R. A. Craddock2, F. Dubuffet1, L. Lozac'h1, M. Martineau1, 1 Laboratoire de Géologie de Lyon Terre, Planètes, Environnement (CNRS-ENS Lyon-Université lyon1),
ERC eMars Team, 2 rue Raphaël Dubois 69622 Villeurbanne Cedex, France, 2 Center for Earth and Planetary Studies, National Air and Space Museum, Smithsonian Institution, Washington,. District of Columbia, USA
Introduction: Despite many studies and observations about the processes that occurred on early Mars,
we have yet to reconstruct a reliable temporal model
that relates the geology to the past climate. Geologic
features such as modified impact craters [i.e.1,2], valley networks [3], and outflow channels [4] attest to the
fact that liquid water was once stable on the Martian
surface and erosional processes occurred. In order to
support the geologic evidence of surface erosion, the
Martian atmosphere must have been significantly
thicker than today. If so, how long did such an atmosphere persist? Was it periodic, episodic or sustained?
Was the climate change related to atmospheric escape
or cessation of the magnetic dynamo? Here we conduct
an analysis of eroded features on Mars in an attempt to
determine how the rate of erosion may have changed
over time.
Crater size distributions of a planetary surfaces, and
especially older surfaces of Mars, record both the cratering rate and the geological history. Variations from a
theoretical crater size distribution that would result
from meteoritic bombardment is interpreted as erosional or depositional processes and is called the Opick
Effect [5,6]. From early as the Mariner missions, such
processes have been suggested to explain the difference between Martian crater size distributions and similar one from the Moon [7, 8, 9]. Moreover, the fact
that craters are preserved at different stages of modification at different diameters indicates that the modification process must have been erosional and longlived, continuing to erode craters as they formed [10,
2]. Craters are ubiquitous features that have formed
continually over time, so by analyzing their size frequency distributions, it is possible to infer temporal
changes in geologic processes and by inference the
evolution of the early Martian atmosphere and climate.
To accomplish this, we developed a simple numerical model that reproduces impact cratering while the
surfaces is undergoing erosion or deposition, which
would affect the preserved crater populations. This
model generates synthetic crater size distributions that
we further used to interpret ~70 crater populations located in different regions of the Martian surface. The
resulting analysis allows us to decipher the erosion (or
deposition) rate from the geological record and—for
the first time—quantitatively assess how it may have
changed over time.
Method: We designed an iterative model that
simulated crater populations as they would appear after
being subjected to obliteration from erosion and burial
over 1 My time intervals. The model is onedimensional as individual impact craters are stored in
the model output as a single depth. We used the crater
size distribution from [11] and converted this to a
crater depth distribution following the empirical law of
crater depth and diameter from MOLA measurements
of fresh impact craters [12]. Then using the impact rate
model from [13], we estimate the impact cratering that
accumulate every 1 My at any period of the history of
Mars. Simultaneously, we applied various obliteration
rates. Both the obliteration rate and the impact rate can
change over time. After several iterations, craters begin
to disappear from erosion or burial while new craters
form. As a convention, a crater is removed from the
model crater population when its depth is less than 1
meter. We ran the model to include the effects of several Gy of changes at increments of 1 My. At the end
of the simulations, the model produces a synthetic
crater size distribution that integrates both the impact
cratering rate history and obliteration rate history,
which we then compared to actual crater populations to
estimate the effective erosion rate that the craters had
been subjected to.
The free parameter of the model is the obliteration
rate history. As we have no idea about how the erosion
rate may have changed over time, we started with two
simple biphasic erosion rate models. The first one corresponds to two successive periods during which the
obliteration rate was held constant [Figure 1A] and the
second modeled an erosion rate that decreased linearly
over time [Figure 1 B].
Crater data used for input. We used the global
crater data base from [14] that is reported to be inconclusive of crater 1 km in diameter and larger. To place
these data into temporal and geologic context, we defined a hundred large areas on Mars that were located
primarily in Noachian terrains, but several in Hesperian
and Amazonian terrains as well. Basically, our goal
was to assess crater erosion rates through all of geologic time were it was possible. The areas had to be large
46th Lunar and Planetary Science Conference (2015)
enough to have a sufficient number of craters larger
than 60 km while located in a coherent geological unit
(from 105 to 106 km2). We used a cylindrical equal area
projection to compute the area of each zone. Using GIS
techniques, crater size distributions of each area are
extracted and used for the analysis.
Figure 1: Cratering and erosion evolution model (left)
applied to generate the synthetic crater size distributions (right) plotted here in incremental representation
that is more sensitive to the Opick Effect [2]. Figure
1A illustrates the biphasic model with 2 periods of
constant obliteration rate. B] Figure 1B illustrates the
biphasic model with an old period experiencing a decreasing obliteration rate with time.
Erosion Rate Estimates: We fixed the current
obliteration rate on Mars to 0.01m/My, which corresponds to the value deduced from rover measurements
[15]. The maximum erosion rate in both endmember
erosion rate models is the only parameter to be returned when analyzing the individual crater populations. To do this, we used optimization techniques that
sought the solution that best fits the data within an error of 0.1 m/My. The initial age as well as the age
when the surface becomes stable is determined directly
from the parts of the crater size distribution that follow
the isochrones for several crater size bins.
For instance, we apply the model to best fits the
crater size distribution of all noachian terrains. The
average age of Noachian terrains is 3.9 Gy according
to age model from [13] and the terrains would have
experienced a period of intense crater obliteration of
1990.pdf
4.1 m/my that ended at 3.45 Gy according the first biphasing model.
Results: We then applied this approach to inverse
the extracted crater size distributions for all the selected areas of Mars to better understand the temporal evolution of crater obliteration rates. The results show that
the ages of the analyzed surfaces ranging from 4.2 Gy
to 2.8 Gy and that the age of the change in magnitude
of the obliteration rate varies from 3.7 Gy to 700 My.
Indeed, we observe a large diversity from an area to
another, as it can be expect on a geologically diverse
planet like Mars. But, this diversity is also highly important for retrieving the timing of crater obliteration
and erosion rates. According to both models there was
a steady decrease in the erosion rate on the order of 2-3
order of magnitude 4.2 Gy to 2.5 Gy Both models also
indicate that there was a steady decrease in the crater
obliteration rate with time. Spikes, rapid decreases, or
sudden shifts in the obliteration rates are not observed.
Conclusions: Our results indicate that there was
not some sort of special climatic conditions that were
maintained during the Noachian or that a thicker primordial atmosphere suddenly disappeared. Rather, the
early atmospheric conditions that were capable of supporting surface liquid water simply waned gradually
over time.
Acknowledgements: This research received support from the European Research Council under the
European Union's Seventh Framework Program
(FP7/2007-2013)/ERC Grant agreement n° 280168 and
NASA Grant NNX09AI40G (Smithsonian).
References: [1] Craddock and Howard, 2002,JGRPlanet ,07. [2] Mangold et al., 2012, JGR-Planet, Vol
117; [3] V. Ansan, N. Mangold, , JGR-Planet ,118 (
2013). [4] V.R. Backer, 2001, Nature, 412. [5] Hartmann W.K., 1966, Icarus, Vol. 5, pp. 565-576; [6]
Hartmann W.K. and Neukum G., 2001, Space Sci.
Rev., Vol. 96, p.165-194; [7] Jones, 1974, JGR, Vol
79, p3917-3931; [8] Hartmann, 1971, Icarus, Vol15,
p410; [9] Chapman, Icarus, 1974; [10] Craddock and
Howard, 1997, JGR-Planet ,102, [11] Hartmann,
2005, Icarus 174, [12] Garvin and Frawley, 1998,
GRL, 25, [13] Neukum, G. et al., 2001, Space Sci.
Rev., Vol. 96, p.55-86. [14] Robbin and Hyneck, 2012,
JGR, Vol 117; [15] Golombeck et al., 2006, JGRPlanet , 111.
© Copyright 2026