
Global Markets Overview
Global Markets Overview
February 2, 2015
Research Department
Athens General Index 30-days chart
450,000
900
400,000
Athens FTSE-ASE Mid Cap 30-days chart
Athens FTSE-ASE Large Cap 30-days chart
450,000
290
8,000
400,000
280
7,000
350,000
270
300,000
300,000
260
250,000
250,000
250
200,000
200,000
240
150,000
150,000
230
100,000
350,000
850
800
750
100,000
50,000
0
710
50,000
210
1,000
690
0
200
0
FTSE-MID 40 Turnover
400,000
1,050
300,000
950
700,000
450
600,000
400
500,000
350
40,000
1,300
35,000
1,200
30,000
400,000
300
300,000
250
15,000
900
10,000
800
700
200,000
200
100,000
750
100,000
150
5,000
0
650
0
100
0
FTSE-20 Turnover
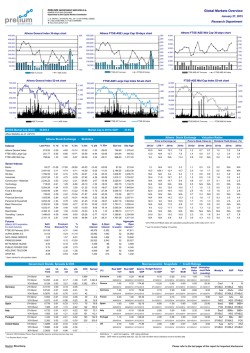
ASE Index
43,152.0
1,000
20,000
850
ATHEX Market Cap (€mn):
1,100
25,000
200,000
ASE Turnover
FTSE-MID 40 Index
FTSE-ASE Mid Cap Index 52-wk chart
FTSE-ASE Large Cap Index 52-wk chart
1,150
670
FTSE-20 Index
1,350
500,000
750
730
Athens General Index 52-wk chart
1,250
770
4,000
2,000
FTSE-20 Turnover
600,000
790
5,000
220
ASE Index
700,000
810
6,000
3,000
700
ASE Turnover
830
Market Cap to 2013e GDP:
0*
600
FTSE-20 Index
FTSE-MID 40 Turnover
FTSE-MID 40 Index
23.7%
Athex Statistics as of: 30/1/15
Athens Stock Exchange - Valuation Ratios
Athens Stock Exchange - Statistics
Price to Earnings (x)
Price to Book Value (x)
Dividend Yield (Gross) (%)
Last Price
% 1d
% 1m
% 3m
% 6m
% ytd
% 52w
52w low
52w high
2013a*
LTM **
2014e
2015e
2013a*
2013a
2014e
2015e
Athens General Index
721.93
-1.59
-13.67
-21.17
-37.92
-12.62
-38.66
708.61
1,379.42
20.0
N/A
10.9
7.0
1.2
0.6
0.6
1.0
3.6
4.0
FTSE-ASE Large Cap
215.63
-1.48
-19.53
-27.95
-42.10
-18.59
-44.03
209.48
445.52
12.0
N/A
10.8
6.7
1.4
0.7
0.6
1.2
4.1
4.1
FTSE-ASE Mid Cap
730.08
-1.52
-9.29
-11.66
-33.72
-5.56
-34.87
696.63
1,317.40
0.6
N/A
N/A
12.8
0.8
0.5
0.7
0.8
0.7
0.9
Indexes
2014e 2015e
Sector Indexes
59.93
-1.59
-38.82
-51.61
-61.30
-37.69
-66.60
53.22
213.44
1.2
N/A
10.1
3.9
1.1
0.4
0.3
0.0
N/A
N/A
Telecoms
2,014.88
-3.68
-21.71
-18.76
-27.81
-19.56
-32.22
1,995.61
3,633.39
16.5
678.7
10.0
8.7
2.5
1.5
1.3
0.0
N/A
N/A
Oil-Gas
1,727.23
0.22
-4.97
-2.52
-28.60
-4.83
-39.12
1,608.57
3,236.15
N/A
N/A
9.0
6.0
1.3
0.8
0.7
3.3
6.2
8.9
Industrials
1,967.96
-2.32
-1.65
-4.46
-37.70
0.71
-38.49
1,816.11
3,724.87
30.4
69.3
18.1
8.5
1.5
0.8
0.9
1.6
3.4
4.3
Construction - Materials
2,122.34
-1.17
-3.20
-1.14
-30.11
-2.86
-22.70
2,028.51
3,482.98
N/A
N/A
15.1
9.2
0.8
0.6
0.6
0.1
0.9
2.5
Banks
Technology
665.80
-2.49
-10.32
-6.88
-30.66
-8.30
-23.59
622.75
1,134.79
N/A
N/A
N/A
N/A
0.5
N/A
N/A
0.5
N/A
N/A
Commerce
4,436.16
-5.28
-2.28
-7.07
-30.15
-2.56
-29.98
3,847.16
7,649.84
30.3
8.4
11.3
9.4
1.7
1.3
1.2
0.0
2.8
2.6
Food & Beverage
5,386.27
-1.61
-5.50
-15.57
-16.25
-8.05
-26.54
5,066.70
7,553.58
62.5
23.8
16.7
15.4
2.5
1.6
1.5
1.6
2.7
2.9
122.13
-0.65
-16.31
-23.15
-37.17
-15.39
-48.78
115.79
287.11
N/A
N/A
N/A
N/A
0.7
0.3
N/A
0.0
N/A
N/A
5.0
Health
Financial Services
976.27
-5.50
-4.20
-14.79
-45.81
-2.53
-42.88
900.30
2,207.51
N/A
N/A
13.2
11.7
1.2
1.7
1.6
0.3
5.4
Personal & Household
4,436.16
-5.28
-2.28
-7.07
-30.15
-2.56
-29.98
3,847.16
7,649.84
30.3
8.4
11.3
9.4
1.7
1.3
1.2
0.0
2.8
2.6
Basic Resources
2,071.59
-4.13
5.31
-6.57
-26.36
7.44
-23.07
1,753.11
3,356.44
N/A
N/A
9.4
6.2
0.7
0.6
0.5
0.0
N/A
N/A
Retail
3,809.65
-5.54
-0.19
1.31
-14.22
0.20
20.80
3,121.12
4,836.94
4.6
N/A
N/A
N/A
1.3
N/A
N/A
0.0
N/A
N/A
Real Estate
2,237.83
-0.71
-1.36
-11.46
-23.58
-1.93
-8.13
2,181.63
3,111.71
N/A
N/A
N/A
N/A
N/A
N/A
N/A
N/A
N/A
N/A
Travelling - Leisure
1,345.06
2.11
-16.04
-18.28
-33.56
-12.27
-19.63
1,238.26
2,304.69
24.0
18.1
11.6
9.5
2.3
1.7
1.6
5.4
7.5
8.8
Utilities
1,926.99
1.29
-10.24
-13.95
-51.50
-8.17
-45.98
1,711.47
4,471.04
N/A
N/A
6.0
5.1
0.5
0.3
0.3
0.8
5.1
5.6
Settl.
Price
Premium/
Discount (%)
%
1d
Open
Interest
∆ Open
Interest
Days
to expire
Aggregate
Open
Interest *
208.75
-3.19
-4.24
47,233
834
18
48,500
Futures
(March 2015 expiration
for stock futures)
FTSE-20 February 2015
ALPHA BANK A.E.
0.324
0.00
0.93
40,916
6,554
46
40,916
0.91
-1.73
-2.68
23,964
-3,873
46
24,014
0.521
0.58
-0.95
28,803
-5,882
46
28,808
MYTILINEOS HLDGS
5.07
0.80
-5.59
3,532
6
46
3,532
PUBLIC POWER COR
4.64
-3.33
-0.22
4,390
21
46
4,390
HELLENIC TELECOM
7.37
0.68
-3.79
5,201
2
46
5,211
OPAP SA
7.36
-1.87
2.22
1,162
-150
46
1,162
Real GDP
YoY
Real GDP
QoQ
NATL BANK GREECE
PIRAEUS BANK
* 2013 P/E and P/Book ratios are calculated using the price of the index at 31.12.13
** Last 12 months (Trailing 12 months)
* Open interest for all expiration dates
Government Bonds, Spreads & CDS
Last
Yield
Greece
Germany
France
Spain
Italy
Portugal
United States
1d,
net
6m,
net
Source: Bloomberg
CDS
*
Spread
**
2Yr Bond
N/A
-
-
-
3,082
-
5Yr Bond
15.156
0.15
10.81
3.81
1,732
1,519.7
10Yr Bond
11.216
0.04
5.11
1.47
1,398
1,090.4
2Yr Bond
-0.1820
0.00
-0.20
-0.08
-
-
5Yr Bond
-0.0410
0.01
-0.33
-0.06
18
-
10Yr Bond
0.3120
0.01
-0.82
-0.23
42
-
5Yr Bond
0.051
0.00
-0.47
-0.13
46
9.2
10Yr Bond
0.542
0.01
-0.97
-0.28
86
23.0
5Yr Bond
0.826
-0.01
-0.34
-0.05
86
86.7
10Yr Bond
1.395
-0.03
-1.17
-0.22
136
108.3
5Yr Bond
0.788
0.01
-0.50
-0.16
108
82.9
10Yr Bond
1.554
-0.04
-1.20
-0.34
166
124.2
5Yr Bond
1.655
0.00
-0.59
0.20
177
169.6
10Yr Bond
2.640
0.03
-0.93
-0.05
260
232.8
5Yr Bond
1.1821
0.03
-0.48
-0.47
-
-
10Yr Bond
1.6684
0.03
-0.82
-0.50
-
-
30Yr Bond
2.2490
0.03
-1.03
-0.50
-
-
* Generic CDS Intraday Prices. Due to liquidity reasons, pricing sources may vary
** vs German Bund, in bps
Macroeconomic Snapshots / Credit Ratings
ytd,
net
(%)
Eurozone
0.80
30/9/2014
Greece
1.60
30/9/2014
Germany
1.20
30/9/2014
France
0.40
30/9/2014
Spain
2.00
31/12/2014
Italy
-0.50
30/9/2014
Portugal
1.10
30/9/2014
US
2.50
31/12/2014
0.20
Debt to Budget Balance
to GDP
GDP
CPI
YoY
90.90
-4.10
-0.60
30/9/2014 31/12/2013
31/3/2014
31/1/2015
174.90
-12.20
30/9/2014 31/12/2013
0.70
31/12/2013
0.10
-2.60
Caa1
*-
B
STABLE
WR
NEG
Aaa
AAAu
AAA
-0.30
31/1/2015
-4.10
92.10
-6.80
31/12/2014 31/12/2013
0.70
31/12/2013
132.60
-2.80
30/9/2014 31/12/2013
-0.10
31/12/2013
128.00
-4.90
30/9/2014 31/12/2013
0.30
31/12/2013
71.80
-2.80
31/12/2014 31/12/2013
2.60
31/12/2014
0.10
-0.50
4.00
6.50
31/1/2015 31/12/2014
-1.00
31/1/2015
STABLE STABLE STABLE
1.50
9.90
Aa1
31/12/2014 31/12/2014 31/12/2014
30/9/2014
NEG
NEG STABLE
5.40
23.70
Baa2
BBB
31/1/2015 31/12/2014 31/12/2014
31/12/2014
-1.40
0.00
0.10
B
Fitch
25.30
0.10
31/12/2013
11.40
31/12/2014
S&P
31/10/2014
31/12/2013
93.40
1.50
31/1/2015 30/11/2014
Moody's
-1.60
76.90
1.00
-1.60
Retail UnemploySales ment Rate
(monthly)
YoY
31/12/2014 31/12/2014 30/11/2014
30/9/2014 31/12/2013
30/9/2014 31/12/2013
CPI
MoM
-0.60
-2.32
12.90
Baa2
31/12/2014
STABLE
1.20
13.40
31/12/2014 31/12/2014 31/12/2014
31/12/2014
0.80
0.00
3.20
5.60
31/12/2014 31/12/2014 31/12/2014
-0.37
31/12/2014
AA
BBB+
POS STABLE STABLE
31/12/2014 31/12/2014 30/11/2014
-0.36
0.00
AAu
Ba1
BBBu
BBB+
NEG STABLE
BBu
BB+
STABLE STABLE
POS
Aaa
AA+u
AAA
STABLE STABLE STABLE
Definitions: *- : watch list negative, WR: rating withdrawn
Notes: GDP refers to quarterly data (Q1, Q2, Q3, Q4). All other macro indicators involve monthly data
Please refer to the last pages of this report for important disclosures
Global Markets Overview
February 2, 2015
Research Department
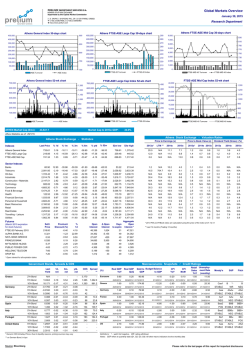
DAX Index 30-days chart
12,000,000
11,000
10,800
10,000,000
S&P 500 Index 30-days chart
Dow Jones Index 30-days chart
16,000,000
10,400
6,000,000
12,000,000
10,200
10,000,000
10,000
8,000,000
9,800
4,000,000
DAX Turnover
2,000,000
16,600
10,000,000
9,000
0
16,400
0
Dow Jones Turnover
10,500
10,000
7,000,000
6,000,000
9,500
5,000,000
9,000
4,000,000
8,500
3,000,000
8,000
2,000,000
1,000,000
7,500
0
7,000
FTSE MIB INDEX
1,980
1,960
1,940
S&P 500 Turnover
S&P 500 Index
S&P 500 Index 52-week chart
18,000
140,000,000
17,500
120,000,000
16,000,000
17,000
2,100
2,050
2,000
1,950
1,900
1,850
1,800
1,750
1,700
1,650
1,600
1,550
1,500
100,000,000
16,500
12,000,000
80,000,000
16,000
8,000,000
15,500
4,000,000
60,000,000
15,000
40,000,000
14,500
20,000,000
14,000
0
Dow Jones Turnover
0
S&P 500 Turnover
Dow Jones Index
S&P 500 Index
WORLD INDEXES - Valuation Ratios
WORLD INDEXES - Statistics
PSI All-Share Index GR
30,000,000
Dow Jones Index
20,000,000
DAX Index
IBEX 35 INDEX
2,000
2,060
Dow Jones Index 52-week chart
8,000,000
FTSE 100 INDEX
2,020
40,000,000
9,200
11,000
CAC 40 INDEX
2,040
50,000,000
20,000,000
DAX Index 52-week chart
DAX INDEX
60,000,000
16,800
9,000,000
Athex Composite Share Pr
17,400
4,000,000
10,000,000
Europe
70,000,000
17,000
DAX Index
DAX Turnover
80,000,000
17,600
6,000,000
9,400
0
2,080
17,800
17,200
9,600
2,000,000
2,100
90,000,000
14,000,000
10,600
8,000,000
100,000,000
18,000
Price to Earnings (x)
Price to Book (x)
Dividend Yield (%)
% 6m
% ytd
% 52w
52w Low
52w High
2013a*
LTM **
2014e
2015e
2013a*
2014e
2015e
2013a
2014e
2015e
-1.59
30/1/2015 -37.92
-12.62
-38.66
708.61
1,379.42
20.0
N/A
10.9
7.0
1.2
0.6
0.6
1.0
3.6
4.0
10,694.32
-0.41
30/1/2015
16.12
9.06
14.91
8,354.97
10,810.57
18.2
17.6
13.8
12.6
1.8
1.7
1.6
2.8
3.0
3.2
France
4,604.25
-0.59
30/1/2015
9.55
7.76
10.53
3,789.11
4,679.26
25.6
18.2
14.9
13.2
1.5
1.4
1.3
3.1
3.4
3.7
UK
6,749.40
-0.90
30/1/2015
1.05
2.79
3.67
6,072.68
6,904.86
16.7
19.5
15.1
13.4
2.0
1.7
1.7
3.6
4.0
4.3
Country
Last Price
% 1d
Greece
721.93
Germany
Last Upd
Spain
10,403.30
-0.99
30/1/2015
-1.05
1.20
4.87
9,370.50
11,249.40
16.5
21.6
14.8
12.7
1.4
1.4
1.3
4.4
3.7
4.1
Portugal
2,274.01
-1.31
30/1/2015 -10.99
6.84
-17.75
2,053.74
3,170.54
N/A
N/A
13.0
8.8
1.3
1.0
0.9
3.1
3.7
4.6
Italy
20,503.38
-0.44
30/1/2015
0.69
7.84
5.59
17,555.77
22,590.18
180.9
N/A
14.6
12.0
1.0
1.0
1.0
2.9
3.7
4.3
Ireland
5,471.52
-0.49
30/1/2015
18.56
4.73
17.61
4,275.26
5,639.89
52.4
36.5
17.8
15.5
1.9
2.0
1.8
1.6
2.0
1.9
Sweden
1,573.62
0.21
30/1/2015
15.59
7.45
20.63
1,246.56
1,582.10
17.0
16.9
16.1
15.0
2.3
2.3
2.2
3.9
3.9
4.2
Luxembourg
1,584.36
1.15
30/1/2015
3.48
4.21
10.67
1,353.57
1,608.63
56.0
20.2
18.3
14.5
1.1
1.1
1.1
4.8
2.8
3.1
AUSTRIAN TRADED ATX INDX
Austria
2,191.11
0.18
30/1/2015
-3.93
1.44
-14.40
1,980.53
2,692.17
24.7
N/A
12.9
10.5
1.0
0.9
0.8
2.8
3.6
4.2
OMX COPENHAGEN 20 INDEX
Denmark
810.94
-0.54
30/1/2015
12.07
8.93
25.30
636.54
824.93
19.7
22.4
17.6
15.4
2.5
2.8
2.6
1.8
2.2
2.6
Switzerland
8,385.13
-0.60
30/1/2015
-0.30
-6.66
2.37
7,852.83
9,292.44
18.4
19.5
16.3
15.0
2.6
2.4
2.3
3.0
3.5
3.8
IRISH OVERALL INDEX
OMX STOCKHOLM 30 INDEX
LUXEMBOURG LuxX INDEX
SWISS MARKET INDEX
Emerging Europe
BIST 100 INDEX
SOFIX INDEX
WSE WIG INDEX
BUCHAREST BET INDEX
Turkey
88,945.82
0.44
30/1/2015
8.35
3.76
43.79
60,848.52
91,805.74
9.9
11.7
11.0
9.5
1.3
1.4
1.3
2.7
2.7
3.1
Bulgaria
500.49
0.42
30/1/2015
-8.03
-4.14
-8.47
486.61
625.40
7.0
7.6
N/A
N/A
0.7
N/A
N/A
5.3
N/A
N/A
Poland
52,102.39
0.12
30/1/2015
3.40
1.33
2.50
48,765.47
55,687.59
17.5
16.9
13.5
11.5
1.3
1.3
1.2
3.7
3.7
4.0
Romania
7,033.17
0.32
30/1/2015
1.34
-0.70
10.26
6,110.93
7,309.05
11.9
9.7
8.9
8.2
1.0
0.9
0.8
2.8
4.1
4.8
-6.20
-1.54
44,904.83
62,304.88
29.8
15.1
10.5
8.9
1.1
1.1
1.0
4.0
4.5
5.2
18.85
14.12
1,182.89
1,706.29
6.7
8.2
5.3
4.6
0.8
0.5
0.4
3.9
5.5
6.5
BRIC
BRAZIL IBOVESPA INDEX
MICEX INDEX
S&P BSE SENSEX INDEX
Brazil
46,907.68
-1.79
Russia
1,659.89
0.74
30/1/2015 -16.09
9:17:18 πµ
20.73
India
29,000.29
-0.63
9:02:20 πµ
13.81
5.46
41.37
19,963.12
29,844.16
16.7
20.3
18.5
15.8
2.6
2.9
2.6
1.5
1.4
1.6
China
3,128.30
-2.56
9:01:36 πµ
43.15
-3.29
53.87
1,974.38
3,406.79
10.3
15.0
11.9
10.5
1.4
1.6
1.4
3.0
2.5
2.8
DOW JONES INDUS. AVG
US
17,164.95
-1.45
30/1/2015
4.07
-3.69
9.34
15,340.69
18,103.45
15.7
15.5
15.9
14.3
2.9
2.8
2.6
2.1
2.4
2.6
NASDAQ COMPOSITE INDEX
US
4,635.24
-1.03
31/1/2015
6.49
-2.13
12.95
3,946.03
4,814.95
27
33
19.7
16.9
3.3
3.3
3.0
1.2
1.2
1.2
S&P 500 INDEX
US
1,994.99
-1.30
30/1/2015
3.63
-3.10
11.92
1,737.92
2,093.55
17.2
17.6
16.7
14.8
2.6
2.5
2.3
1.9
2.1
2.3
1.7
SHANGHAI SE COMPOSITE
US
Asia, Pacific
NIKKEI 225
HANG SENG INDEX
Japan
17,558.04
-0.66
8:28:01 πµ
13.11
0.61
17.72
13,885.11
18,030.83
22.2
20.3
18.9
16.7
1.7
1.7
1.6
1.3
1.5
Hong Kong
24,415.96
-0.37
9:02:18 πµ
-0.47
3.44
10.80
21,137.61
25,362.98
10.9
10.3
11.4
10.2
1.4
1.3
1.2
3.3
3.5
3.8
Singapore
3,410.73
0.58
9:02:18 πµ
1.98
1.35
12.67
2,953.01
3,432.62
13.6
13.8
13.9
12.6
1.4
1.3
1.2
3.3
3.4
3.6
Australia
5,625.34
0.66
8:06:29 πµ
1.24
3.96
8.39
5,052.20
5,679.50
19.8
19.4
16.0
14.8
2.0
1.9
1.8
4.3
4.6
4.9
Straits Times Index STI
S&P/ASX 200 INDEX
Volatility & Risk Indexes
* 2013 P/E and P/Book ratios are calculated using the price of the index at 31.12.13
VDAX
VIX
VXN
DAX
21.21
6.91
30/1/2015
20.99
8.88
19.83
10.80
24.09
S&P 500
20.97
11.78
30/1/2015
23.14
9.22
13.91
10.28
31.06
30/1/2015
Nasdaq 100
21.59
10.83
25.09
9.93
13.81
9.66
31.17
MARKIT ITRX EUROPE 12/19 (Generic)
Europe
59.94
-
7:11:46 πµ -10.57
-4.72
-28.52
51.78
86.56
MARKIT ITRX EUR XOVER 12/19 (Generic)
Europe
323.92
-
7:11:46 πµ
18.45
-6.37
0.14
218.43
429.90
% 6m
% ytd
% 52w
52w Low
52w High
9:16:00 πµ -50.99
-8.98
-52.66
-
-
COMMODITIES
Energy
Dated BFO Crude Oil Spot Px ($/bbl)
Exchange
Last Price
% 1d
-
50.75
-0.04
Last Upd
** Last 12 months (Trailing 12 months)
Currencies
Price
% 1d
% 6m
% ytd
EUR / US Dollar
1.1299
0.10
-15.79
-6.62
-16.41
1.1098
1.3994
EUR/Japanese Yen
132.94
0.31
-3.32
-8.32
-2.79
130.15
149.80
-5.78
-3.38
-9.46
0.7405
0.8403
-13.73 -12.70
-13.87
0.7813
1.2262
-3.96
1.3754
1.5587
% 52w 52wLow 52wHigh
WTI Crude Futr-Generic 1st month ($/bbl)
NYM
47.21
-2.14
9:17:17 πµ -51.77
-11.38
-51.57
43.58
107.73
EUR / British Pound
0.7503
-0.15
Brent Crude Futr-Generic 1st month ($/bbl)
ICE
51.90
-2.06
9:07:19 πµ -50.50
-9.47
-51.22
45.19
115.71
EUR / Swiss Franc
1.0498
1.15
Natural Gas Futr-Generic 1st month ($/bbl)
NYM
2.66
-1.23
9:16:51 πµ -30.02
-8.00
-46.23
2.64
6.49
EUR / Canadian Dollar
1.4402
0.28
EUR / Australian Dollar
1.4514
-0.18
0.91
-2.06
-5.75
1.3798
1.5538
EUR / Turkish Lira
2.7552
-0.12
-3.76
-2.62
-10.36
2.6045
3.1300
3m
Precious Metals
Exchange
Last Price
% 1d
Last Upd
% 6m
% ytd
% 52w
52w Low
52w High
GOLD SPOT $/OZ
-
1,279.16
-0.36
9:17:18 πµ
-1.10
7.96
2.78
1131.24
1392.22
SILVER SPOT $/OZ
-
17.12
-0.81
9:17:03 πµ -15.80
9.00
-10.75
14.29
22.18
PLATINUM SPOT $/OZ
-
1,233.25
-0.63
9:17:13 πµ -15.77
2.09
-10.59
1177.15
1521.38
PALLADIUM SPOT $/OZ
-
773.70
0.16
9:16:34 πµ -10.50
-3.01
9.90
696.80
912.00
Base Metals
Money Market Rates
1w
-1.65
6m
9m
12m
-0.0240
0.0010
0.0540 0.1320
0.2020
0.2700
US
0.1351
0.1713
0.2531 0.3574
0.5508
0.6209
Japan
0.0436
0.0729
0.1043 0.1421
0.3543
0.2661
Europe
1m
2.48
Exchange
Last Price
% 1d
Last Upd
% 6m
% ytd
% 52w
52w Low
52w High
LME ALUMINUM 3MO ($) / MT
LME
1,864.00
2.47
30/1/2015
-7.81
0.62
7.81
1671.25
2119.50
LME COPPER
LME
5,495.00
1.85
30/1/2015 -22.88
-12.78
-22.55
5339.50
7220.00
LME
1,859.50
-0.03
30/1/2015 -17.72
0.08
-12.04
1743.00
2307.00
Latest Rate
Last Update
Next Update
LME
15,165.00
1.78
30/1/2015 -20.02
0.10
9.81
13723.00
21625.00
Europe
ECB
0.05
22/1/2015
5/3/2015
Exchange
Last Price
% 1d
Last Upd
% 6m
% ytd
% 52w
52w Low
52w High
UK
BoE
0.50
8/1/2015
5/2/2015
CBT
368.50
-0.41
9:06:51 πµ
4.54
-7.18
-15.09
318.25
519.50
US
Fed
0.25
28/1/2015
18/3/2015
Japan
BoJ
0.10
22/1/2014
*
LME LEAD
LME NICKEL
3MO ($) / MT
3MO ($) / MT
3MO ($) / MT
Agriculture
Corn Futr-Generic 1st month ($/bu.)
Wheat Futr - Generic 1st month ($/bu.)
CBT
502.00
-0.15
9:07:13 πµ
-6.04
-14.88
-9.67
466.25
735.00
Soybean Futr - Generic 1st month ($/bu.)
CBT
959.00
-0.21
9:06:06 πµ -21.07
-5.91
-25.24
904.00
1536.75
Sugar Futr - Generic 1st month ($/lb.)
NYB
14.79
-0.40
30/1/2015 -11.06
1.86
-1.33
13.32
18.47
Coffee Futr - Generic 1st month ($/lb.)
NYB
161.90
1.19
30/1/2015 -11.29
-2.82
34.92
125.00
225.50
Live Cattle Futr - Generic 1st month ($/lb.)
CME
154.85
0.86
30/1/2015
Lean Hogs Futr - Generic 1st month ($/lb.)
CME
67.48
-1.57
Source: Bloomberg
-3.13
-6.55
8.93
135.40
171.98
30/1/2015 -43.37
-16.90
-21.88
67.35
133.90
Interest Rates
* As of 4/4/2013, the BOJ has shifted its monetary policy focus to a targeted monetary
base via Japanese government bond (JGB) purchases.
Please refer to the last pages of this report for important disclosures
Global Markets Overview
February 2, 2015
Research Department
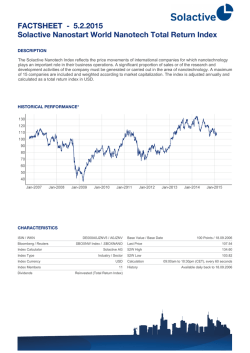
Bonds, Spreads, CDS
10 Yr Bond Yields
5 Yr Bond Yields
Greece, Germany, Ireland, Portugal, Spain
Germany, Ireland, Portugal, Spain, Greece
16
12
15
11
14
10
13
12
9
11
8
10
9
7
8
6
7
5
6
5
4
4
3
3
2
2
1
1
0
0
3/2/14
28/4/14
21/7/14
Greece
Germany
Ireland
13/10/14
Portugal
-1
3/2/14
5/1/15
Spain
28/4/14
Italy
Greek Spreads, 10 Yr Bonds (5 Yr n/a)
Germany
35835
-3
1,650
13/10/14
Portugal
Spain
5/1/15
Italy
Greece
Greek CDS, 5 Yr & 10 Yr Bonds (CMAN pricing)
66257
1,850
1,550
1,750
1,450
1,650
1,350
21/7/14
Ireland
1,550
1,250
1,450
1,150
1,350
1,050
1,250
950
1,150
850
750
1,050
650
950
550
28/11/14
850
8/12/14
18/12/14
28/12/14
Greek 10Yr Spread
7/1/15
17/1/15
27/1/15
14/1/15
Greek 5Yr Spread
20/1/15
23/1/15
Greek 5Yr CDS
Spreads and CDS, 10 Yr Bonds
-
Ireland, Portugal, Italy, Spain (CBIL pricing for CDS)
300
17/1/15
26/1/15
29/1/15
Greek 10Yr CDS
Spreads and CDS, 5 Yr Bonds
Ireland, Portugal, Italy, Spain (CBIL pricing for CDS)
220
280
200
260
180
240
220
160
200
140
180
523
160
120
140
100
725.1
702.1
120
80
100
60
80
60
40
40
20
390.16
20
0
22/12/14
Irish Spread
Portugese CDS
Italian Spread
Source: Bloomberg
0
22/12/14
Irish CDS
Spanish Spread
Italian CDS
Portugese Spread
Spanish CDS
Irish Spread (6Yr)
Portugese CDS
Italian Spread
Irish CDS
Spanish Spread
Italian CDS
Portugese Spread
Spanish CDS
Please refer to the last pages of this report for important disclosures
Global Markets Overview
February 2, 2015
Research Department
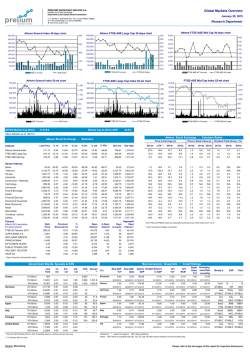
Currencies
Euro / US Dollar
1.1299
0.10%
1.40
1.38
1.36
1.34
1.32
1.30
1.28
1.26
1.24
1.22
1.20
1.18
1.16
1.14
1.12
1.10
3/2/14
3/4/14
3/6/14
Euro / Japanese Yen
132.94
3/8/14
3/10/14
3/12/14
Euro / British Pound
0.31%
0.7503
-0.15%
0.85
150
######
-3.00
145
0.84
0.83
0.82
0.81
0.80
140
0.79
0.78
0.77
135
0.76
0.75
130
3/2/14
3/4/14
3/6/14
3/8/14
3/10/14
0.74
3/2/14
3/12/14
3/4/14
3/6/14
3/8/14
3/10/14
3/12/14
Commodities, (Precious) Metals
Dated BFO Crude Oil Spot Px ($/bbl)
50.75
Gold, Spot ($/OZ)
-0.04%
120
1,279.16
-0.36%
1,450
110
1,400
100
1,350
90
1,300
80
-
1,250
70
1,200
60
1,150
50
40
3/2/14
3/4/14
3/6/14
3/8/14
3/10/14
Aluminum (3MO Future) ($/MT)
1,864.00
1,100
3/2/14
3/12/14
3/6/14
3/8/14
Copper (3MO Future) ($/MT)
2.47%
2,150
3/4/14
7,400
2,100
7,200
2,050
7,000
2,000
6,800
1,950
6,600
3/10/14
3/12/14
5,495.00
1.85%
702.1
6,400
1,900
6,200
1,850
6,000
363.8
1,800
390.2
5,800
1,750
5,600
1,700
1,650
3/2/14
Source: Bloomberg
5,400
28/4/14
21/7/14
13/10/14
5/1/15
5,200
3/2/14
28/4/14
21/7/14
13/10/14
5/1/15
Please refer to the last pages of this report for important disclosures
Global Markets Overview
February 2, 2015
Research Department
Macroeconomic Calendar
Regions included: EC, Greece, Germany, France, Portugal, Italy, Spain, Ireland, United Kingdom, US, China, Japan
Date Time
02/01/2015 03:00
02/01/2015 03:00
02/02/2015 03:35
02/02/2015 03:45
02/02/2015 07:00
02/02/2015 08:00
02/02/2015 10:00
02/02/2015 10:15
02/02/2015 10:45
02/02/2015 10:50
02/02/2015 10:55
02/02/2015 11:00
02/02/2015 11:00
02/02/2015 11:30
02/02/2015 15:30
02/02/2015 15:30
02/02/2015 15:30
02/02/2015 15:30
02/02/2015 15:30
02/02/2015 15:30
02/02/2015 16:45
02/02/2015 17:00
02/02/2015 17:00
02/02/2015 17:00
02/02/2015 19:00
02/02/2015 19:00
02/01/2015 02/08
02/03/2015 01:50
02/03/2015 01:50
02/03/2015 11:00
02/03/2015 11:30
02/03/2015 12:00
02/03/2015 12:00
02/03/2015 12:00
02/03/2015 12:00
02/03/2015 12:00
02/03/2015 12:00
02/03/2015 16:45
02/03/2015 17:00
02/03/2015 17:00
02/03/2015
02/03/2015
02/04/2015 02:01
02/04/2015 03:30
02/04/2015 03:30
02/04/2015 03:35
02/04/2015 03:35
02/04/2015 03:45
02/04/2015 03:45
02/04/2015 08:00
02/04/2015 08:00
02/04/2015 10:15
02/04/2015 10:15
02/04/2015 10:45
02/04/2015 10:45
02/04/2015 10:50
02/04/2015 10:50
02/04/2015 10:55
02/04/2015 10:55
02/04/2015 11:00
02/04/2015 11:00
02/04/2015 11:30
02/04/2015 11:30
02/04/2015 11:30
02/04/2015 11:30
02/04/2015 12:00
02/04/2015 12:00
02/04/2015 13:00
02/04/2015 13:00
02/04/2015 13:00
02/04/2015 13:00
02/04/2015 14:00
02/04/2015 15:15
02/04/2015 16:45
02/04/2015 16:45
02/04/2015 17:00
02/05/2015 01:50
02/05/2015 01:50
02/05/2015 01:50
02/05/2015 01:50
02/05/2015 03:00
02/05/2015 09:00
02/05/2015 09:00
02/05/2015 09:45
02/05/2015 10:30
02/05/2015 11:00
02/05/2015 11:00
02/05/2015 11:10
Source: Bloomberg
Event
CH
CH
JN
CH
JN
IR
SP
SP
IT
FR
GE
GR
EC
UK
US
US
US
US
US
US
US
US
US
US
IT
IT
IR
JN
JN
IT
UK
EC
EC
IT
IT
IT
IT
US
US
US
US
US
UK
JN
JN
JN
JN
CH
CH
IR
IR
SP
SP
IT
IT
FR
FR
GE
GE
EC
EC
UK
UK
UK
UK
EC
EC
PO
IR
IR
IR
US
US
US
US
US
JN
JN
JN
JN
JN
GE
GE
FR
GE
UK
EC
GE
1)
2)
3)
4)
5)
6)
7)
8)
9)
10)
11)
12)
13)
14)
15)
16)
17)
18)
19)
20)
21)
22)
23)
24)
25)
26)
27)
28)
29)
30)
31)
32)
33)
34)
35)
36)
37)
38)
39)
40)
41)
42)
43)
44)
45)
46)
47)
48)
49)
50)
51)
52)
53)
54)
55)
56)
57)
58)
59)
60)
61)
62)
63)
64)
65)
66)
67)
68)
69)
70)
71)
72)
73)
74)
75)
76)
77)
78)
79)
80)
81)
82)
83)
84)
85)
86)
87)
88)
Manufacturing PMI
Non-manufacturing PMI
Markit/JMMA Japan Manufacturing PMI
HSBC China Manufacturing PMI
Vehicle Sales YoY
Investec Manufacturing PMI Ireland
Unemployment MoM Net ('000s)
Markit Spain Manufacturing PMI
Markit/ADACI Italy Manufacturing PMI
Markit France Manufacturing PMI
Markit/BME Germany Manufacturing PMI
Markit Greece Manufacturing PMI
Markit Eurozone Manufacturing PMI
Markit UK PMI Manufacturing SA
Personal Income
Personal Spending
PCE Deflator MoM
PCE Deflator YoY
PCE Core MoM
PCE Core YoY
Markit US Manufacturing PMI
Construction Spending MoM
ISM Manufacturing
ISM Prices Paid
New Car Registrations YoY
Budget Balance
Consumer Confidence Index
Monetary Base YoY
Monetary Base End of period
Istat Releases the New Inflation Baskets
Markit/CIPS UK Construction PMI
PPI MoM
PPI YoY
CPI NIC incl. tobacco MoM
CPI NIC incl. tobacco YoY
CPI EU Harmonized MoM
CPI EU Harmonized YoY
ISM New York
Factory Orders
IBD/TIPP Economic Optimism
Wards Domestic Vehicle Sales
Wards Total Vehicle Sales
BRC Shop Price Index YoY
Labor Cash Earnings YoY
Real Cash Earnings YoY
Markit Japan Services PMI
Markit/JMMA Japan Composite PMI
HSBC China Composite PMI
HSBC China Services PMI
Investec Services PMI Ireland
Investec Composite PMI Ireland
Markit Spain Services PMI
Markit Spain Composite PMI
Markit/ADACI Italy Services PMI
Markit/ADACI Italy Composite PMI
Markit France Services PMI
Markit France Composite PMI
Markit Germany Services PMI
Markit/BME Germany Composite PMI
Markit Eurozone Services PMI
Markit Eurozone Composite PMI
Official Reserves Changes
Markit/CIPS UK Services PMI
Markit/CIPS UK Composite PMI
Lloyds Business Barometer
Retail Sales MoM
Retail Sales YoY
Unemployment Rate
Live Register Level SA (000's)
Live Register Monthly Change
Unemployment Rate
MBA Mortgage Applications
ADP Employment Change
Markit US Composite PMI
Markit US Services PMI
ISM Non-Manf. Composite
Japan Buying Foreign Bonds
Japan Buying Foreign Stocks
Foreign Buying Japan Bonds
Foreign Buying Japan Stocks
Bloomberg Feb. Japan Economic Survey
Factory Orders MoM
Factory Orders WDA YoY
Survey of Industrial Investment
Markit Germany Construction PMI
New Car Registrations YoY
ECB Publishes Economic Bulletin
Markit Germany Retail PMI
Survey
Actual
Prior
Revised
Jan
Jan
Jan F
Jan F
Jan
Jan
Jan
Jan
Jan
Jan F
Jan F
Jan
Jan F
Jan
Dec
Dec
Dec
Dec
Dec
Dec
Jan F
Dec
Jan
Jan
Jan
Jan
Jan
Jan
Jan
50.2
--49.8
--88
54.1
48.8
49.5
51
-51
52.7
0.20%
-0.20%
-0.30%
0.80%
0.00%
1.30%
53.7
0.70%
54.5
39.8
------
49.8
53.7
52.2
49.7
-18.90%
55.1
------------------------
50.1
54.1
52.1
49.8
-8.80%
56.9
-64.4
53.8
48.4
49.5
51
49.4
51
52.5
0.40%
0.60%
-0.20%
1.20%
0.00%
1.40%
53.7
-0.30%
55.5
38.5
2.35%
5.1B
90.5
38.20%
¥275.9T
----------------------55.1
-------
Jan
Dec
Dec
Jan P
Jan P
Jan P
Jan P
Jan
Dec
Feb
Jan
Jan
Jan
Dec
Dec
Jan
Jan
Jan
Jan
Jan
Jan
Jan
Jan
Jan
Jan
Jan F
Jan F
Jan F
Jan F
Jan F
Jan F
Jan
Jan
Jan
Jan
Dec
Dec
4Q
Jan
Jan
Jan
Jan 30
Jan
Jan F
Jan F
Jan
Jan 30
Jan 30
Jan 30
Jan 30
57
-0.70%
-2.50%
-0.20%
-0.30%
-2.40%
-0.40%
--2.20%
51.4
13.50M
16.60M
-1.60%
1.60%
-------54.4
54.6
50
50.1
49.5
49.5
52.7
52.6
52.3
52.2
-56.3
55.5
-0.00%
2.00%
-----225K
-54.1
56.5
-----
---------------------------------------------------
57.6
-0.30%
-1.60%
0.00%
0.00%
0.00%
-0.10%
70.8
-0.70%
51.5
13.46M
16.80M
-1.70%
-1.50%
-4.30%
51.7
51.9
51.4
53.4
62.6
61
54.3
54.3
49.4
49.4
49.5
49.5
52.7
52.6
52.3
52.2
-$1664M
55.8
55.2
45
0.60%
1.50%
13.10%
363.9
-3.3K
10.60%
-3.20%
241K
54.2
54
56.2
¥45.6B
¥382.1B
¥237.5B
¥466.9B
-------------0.10%
-2.70%
------------------------------56.5
-----
Dec
Dec
1.50%
0.70%
---
-2.40%
-0.40%
---
Jan
Jan
---
---
50.5
8.70%
---
--
--
51.7
--
Jan
Please refer to the last pages of this report for important disclosures
Global Markets Overview
February 2, 2015
Research Department
Economic Events Calendar
02/02/2015 10:00
02/02/2015 15:00
02/02/2015 18:30
02/02/2015
02/02/2015
02/03/2015 11:00
02/03/2015 11:00
02/04/2015 13:00
02/04/2015 18:00
02/04/2015 18:00
02/04/2015 19:45
02/05/2015 03:30
02/05/2015 11:00
02/05/2015 13:00
02/05/2015 13:30
02/05/2015 18:00
02/05/2015
02/06/2015 12:00
02/06/2015 16:00
02/06/2015 19:45
02/06/2015
02/08/2015 02/10
02/09/2015 03:30
02/09/2015 13:00
02/10/2015 11:00
02/10/2015 11:00
02/10/2015 15:20
02/10/2015 17:00
02/11/2015 15:00
02/11/2015 18:00
02/12/2015
02/13/2015 15:30
02/13/2015 20:30
02/13/2015
02/16/2015 16:00
02/17/2015 10:00
02/18/2015 05:00
02/20/2015 15:30
02/25/2015 19:00
02/25/2015
02/26/2015 20:00
02/27/2015
03/06/2015 12:00
03/08/2015 03/10
HU
PO
EC
US
GR
PO
IT
PO
EC
PO
US
JN
EC
PO
GE
PO
EC
IT
GE
US
EC
GR
JN
PO
PO
PO
US
PO
US
PO
EC
US
US
PO
EC
EC
JN
US
FR
PO
GE
EC
IT
US
Regions included: EC, Greece, Germany, France, Portugal, Italy, Spain, Ireland, United Kingdom, US, China, Japan
1)
Matolcsy Host a Meeting for European Central Bankers
2)
Portuguese Economy Minister Lima Holds Press Conference
3)
ECB Governing Council Member Nowotny Speaks on Monetary Policy
4)
U.S. President Obama to Release Fiscal 2016 Budget
5)
Yanis Meets With U.K. and France Fiance Ministers
6)
Fitch Ratings Holds Lisbon Credit Conference
7)
Istat Releases the New Inflation Baskets
8)
Portugal Reports Fourth-Quarter Unemployment Rate
9)
EU's Hill Speaks at Long-Term Financing Conference in Brussels
10)
Former Novo Banco Board Member Rato Speaks in Parliament
11)
Fed's Mester Speaks on Economy and Banking in Columbus
12)
BOJ's Iwata Gives a Speech and Hold a Press Conference
13)
EU Publishes Economic Forecasts
14)
Portugal Releases Industrial Sales, Employment Report
15)
Peter Praet Gives a Speech
16)
Espirito Santo Board Member dos Santos Speaks in Parliament
17)
NATO Defense Ministers Hold Meeting in Brussels
18)
Bank of Italy Report on Balance-Sheet Aggregates
19)
Country Leaders and Reps Show for Munich Security Conference
20)
Fed's Lockhart Speaks on U.S. Economy in Naples, Florida
21)
U.S.'s Biden Meets With EU Officials in Brussels
22)
Merkel to Make Two-Day Trip to U.S. and Canada
23)
BOJ Board Member Morimoto Speaks in Chiba
24)
Portugal Reports International Trade Figures for December
25)
ECB's Costa, Praet Speak on Financial Stability in Lisbon
26)
Novo Banco CEO Stock da Cunha Speaks in Parliament
27)
Fed's Lacker to Speak on Economy in Raleigh, North Carolina
28)
Construction Entrepreneur Guilherme Speaks in Parliament
29)
Fed's Fisher Speaks to Economists in New York
30)
Former Tranquilidade CEO Brito e Cunha Speaks in Parliament
31)
EU Leaders Hold Summit in Brussels
32)
Revisions of Producer Price Index
33)
Fed's Fisher Speaks at Luncheon in San Antonio
34)
Bank of Portugal Releases Data on Banks
35)
Euro-Area Finance Ministers Meet in Brussels
36)
EU Finance Ministers Hold Meeting in Brussels
37)
Bank of Japan Policy Statement/Kuroda Press Conference
38)
Revisions of Consumer Price Index
39)
Total Jobseekers
40)
Portugal Releases Year-to-Date Budget Report
41)
Fed's Lockhart Speaks on U.S. Outlook At Banking Conference
42)
EU-Brazil Summit in Brussels
43)
Bank of Italy Report on Balance-Sheet Aggregates
44)
NABE 2015 Policy Conference
UK
UK
UK
FR
FR
FR
US
US
CH
CH
CH
JN
US
US
CH
GR
UK
JN
JN
SP
SP
SP
FR
FR
JN
UK
UK
UK
GE
US
US
JN
US
US
IT
GR
UK
GE
US
JN
IT
IR
US
JN
Regions included: EC, Greece, Germany, France, Portugal, Italy, Spain, Ireland, United Kingdom, US, China, Japan
1)
U.K. Sells GBP500 Mln 28-Day Bills; Yield 0.303%
2)
U.K. Sells GBP1.5 Bln 182-Day Bills; Yield 0.4277%
3)
U.K. Sells GBP1 Bln 92-Day Bills; Yield 0.3423%
4)
France to Sell Up to EUR3.5 Bln 91-Day Bills
5)
France to Sell Up to EUR1.6 Bln 154-Day Bills
6)
France to Sell Up to EUR1.5 Bln 336-Day Bills
7)
U.S. to Sell USD26 Bln 3-Month Bills
8)
U.S. to Sell USD26 Bln 6-Month Bills
9)
China Development Bank to Sell CNY6 Bln 5-Year Bonds (1503)
10)
China Development Bank to Sell CNY5 Bln 7-Year Bonds (1504)
11)
China Development Bank to Sell CNY7 Bln 10-Year Bonds (1505)
12)
Japan to Sell 10-Year Bonds
13)
U.S. to Sell USD25 Bln 52-Week Bills
14)
U.S. to Sell 4-Week Bills
15)
China to Sell CNY20 Bln 5-Year Bonds (1503)
16)
Greece to Sell EUR625 Mln 182-Day Bills
17)
U.K. to Sell 2024 I/L Bonds
18)
Japan to Sell 3-Month Bill
19)
Japan to Sell 30-Year Bonds
20)
Spain to Sell 0.55% I/L 2019 Bonds
21)
Spain to Sell 6% 2029 Bonds
22)
Spain to Sell 5.15% 2044 Bonds
23)
France to Sell 0.5% 2025 Bonds
24)
France to Sell 6% 2025 Bonds
25)
Japan to Sell 6-Month Bill
26)
U.K. to Sell GBP500 Mln 28-Day Bills
27)
U.K. to Sell GBP1 Bln 91-Day Bills
28)
U.K. to Sell GBP1.5 Bln 182-Day Bills
29)
Germany to Sell EUR2 Bln 182-Day Bills (DE0001119386)
30)
U.S. to Sell 3-Month Bills
31)
U.S. to Sell 6-Month Bills
32)
Japan Auction for Enhanced-Liquidity
33)
U.S. to Sell 4-Week Bills
34)
U.S. to Sell 3-Year Notes
35)
Italy to Sell Bills
36)
Greece to Sell 13-Week Bills
37)
U.K. to Sell 3.5% 2045 Bonds
38)
Germany to Sell EUR5 Bln Bonds (DE0001137495)
39)
U.S. to Sell 10-Year Notes
40)
Japan to Sell 3-Month Bill
41)
Italy to Sell Bonds
42)
Ireland to Sell Bonds
43)
U.S. to Sell 30-Year Bonds
44)
Japan to Sell 5-Year Bonds
Government Auctions / Buyouts Calendar
01/30/2015 13:00
01/30/2015 13:00
01/30/2015 13:00
02/02/2015 15:50
02/02/2015 15:50
02/02/2015 15:50
02/02/2015 18:30
02/02/2015 18:30
02/03/2015 04:30
02/03/2015 05:00
02/03/2015 05:00
02/03/2015 05:45
02/03/2015 18:30
02/03/2015 18:30
02/04/2015 05:00
02/04/2015 12:00
02/04/2015 12:30
02/05/2015 05:35
02/05/2015 05:45
02/05/2015 11:30
02/05/2015 11:30
02/05/2015 11:30
02/05/2015 11:50
02/05/2015 11:50
02/06/2015 05:35
02/06/2015 13:00
02/06/2015 13:00
02/06/2015 13:00
02/09/2015 12:30
02/09/2015 18:30
02/09/2015 18:30
02/10/2015 10:00
02/10/2015 18:30
02/10/2015 20:00
02/11/2015 12:00
02/11/2015 12:00
02/11/2015 12:30
02/11/2015 12:30
02/11/2015 20:00
02/12/2015 05:35
02/12/2015 12:00
02/12/2015 12:30
02/12/2015 20:00
02/13/2015 05:45
Source: Bloomberg
Please refer to the last pages of this report for important disclosures
Global Markets Overview
February 2, 2015
Research Department
Earnings Releases Calendar
Global - Top Events
Primary Exchange
New York
Korea SE
London
Stockholm
Natl India
Copenhagen
Soc.Bol SIBE
NASDAQ GS
New York
New York
New York
New York
New York
New York
New York
NASDAQ GS
New York
New York
New York
New York
Natl India
Soc.Bol SIBE
SIX Swiss Ex
Dublin
New York
New York
New York
New York
NASDAQ GS
Tokyo
SIX Swiss Ex
London
London
New York
Soc.Bol SIBE
New York
New York
New York
New York
New York
New York
NASDAQ GS
New York
EN Paris
NASDAQ GS
New York
Copenhagen
Hong Kong
New York
Toronto
Tokyo
Tokyo
Tokyo
Oslo
SIX Swiss Ex
London
New York
New York
NASDAQ GS
New York
New York
New York
New York
London
NASDAQ GS
New York
New York
New York
EN Paris
NASDAQ GS
New York
New York
New York
NASDAQ GS
Company Name
Eastman Chemical Co
(C) Hyundai Glovis Co Ltd
BT Group PLC
Svenska Cellulosa AB SCA
(P) ICICI Bank Ltd
Novo Nordisk A/S
Banco Popular Espanol SA
Mattel Inc
Eli Lilly & Co
CONSOL Energy Inc
Ingersoll-Rand PLC
Altria Group Inc
Simon Property Group Inc
Tyson Foods Inc
AbbVie Inc
PACCAR Inc
MasterCard Inc
Chevron Corp
Franklin Resources Inc
Berry Plastics Group Inc
(C) ICICI Bank Ltd
CaixaBank SA
Julius Baer Group Ltd
Ryanair Holdings PLC
Sysco Corp
Exxon Mobil Corp
Anadarko Petroleum Corp
Cliffs Natural Resources Inc
Advent Software Inc
(C) Sharp Corp/Japan
ams AG
BG Group PLC
BP PLC
Archer-Daniels-Midland Co
Banco Santander SA
Eaton Corp PLC
Emerson Electric Co
LyondellBasell Industries NV
HCA Holdings Inc
United Parcel Service Inc
Chipotle Mexican Grill Inc
Gilead Sciences Inc
Walt Disney Co/The
LVMH Moet Hennessy Louis Vuitton SA
Wynn Resorts Ltd
Forest City Enterprises Inc
Danske Bank A/S
Lenovo Group Ltd
National Oilwell Varco Inc
PrairieSky Royalty Ltd
(C) Sony Corp
(C) Mazda Motor Corp
(C) Toyota Motor Corp
Marine Harvest ASA
Syngenta AG
Sky PLC
Boston Scientific Corp
Merck & Co Inc
Cognizant Technology Solutions Corp
Spectra Energy Corp
General Motors Co
Marathon Petroleum Corp
Whirlpool Corp
GlaxoSmithKline PLC
Twenty-First Century Fox Inc
Under Armour Inc
Weatherford International PLC
Noble Corp plc
Vinci SA
Keurig Green Mountain Inc
Prudential Financial Inc
Yum! Brands Inc
Brookdale Senior Living Inc
NXP Semiconductors NV
Bloomberg
Ticker
EMN US
086280 KS
BT/A LN
SCAB SS
ICICIBC IN
NOVOB DC
POP SM
MAT US
LLY US
CNX US
IR US
MO US
SPG US
TSN US
ABBV US
PCAR US
MA US
CVX US
BEN US
BERY US
ICICIBC IN
CABK SM
BAER VX
RYA ID
SYY US
XOM US
APC US
CLF US
ADVS US
6753 JP
AMS SW
BG/ LN
BP/ LN
ADM US
SAN SM
ETN US
EMR US
LYB US
HCA US
UPS US
CMG US
GILD US
DIS US
MC FP
WYNN US
FCE/A US
DANSKE DC
992 HK
NOV US
PSK CN
6758 JP
7261 JP
7203 JP
MHG NO
SYNN VX
SKY LN
BSX US
MRK US
CTSH US
SE US
GM US
MPC US
WHR US
GSK LN
FOXA US
UA US
WFT US
NE US
DG FP
GMCR US
PRU US
YUM US
BKD US
NXPI US
Date
30/1/15
30/1/15
30/1/15
30/1/15
30/1/15
30/1/15
30/1/15
30/1/15
30/1/15
30/1/15
30/1/15
30/1/15
30/1/15
30/1/15
30/1/15
30/1/15
30/1/15
30/1/15
30/1/15
30/1/15
30/1/15
30/1/15
2/2/15
2/2/15
2/2/15
2/2/15
2/2/15
2/2/15
2/2/15
3/2/15
3/2/15
3/2/15
3/2/15
3/2/15
3/2/15
3/2/15
3/2/15
3/2/15
3/2/15
3/2/15
3/2/15
3/2/15
3/2/15
3/2/15
3/2/15
3/2/15
3/2/15
3/2/15
3/2/15
3/2/15
4/2/15
4/2/15
4/2/15
4/2/15
4/2/15
4/2/15
4/2/15
4/2/15
4/2/15
4/2/15
4/2/15
4/2/15
4/2/15
4/2/15
4/2/15
4/2/15
4/2/15
4/2/15
4/2/15
4/2/15
4/2/15
4/2/15
4/2/15
4/2/15
C
C
C
C
C
C
C
C
C
C
C
C
C
C
C
C
C
C
C
C
C
C
C
C
C
C
C
C
C
C
C
C
C
C
C
C
C
C
C
C
C
C
C
C
C
E
C
C
C
E
C
C
C
C
C
C
C
C
C
C
C
C
C
C
C
C
C
C
C
C
C
C
C
C
Time
Period
0:08
7:09
9:00
9:00
10:36
Bef-mkt
Bef-mkt
13:00
13:25
13:45
14:00
14:00
14:00
14:30
14:47
15:00
15:00
15:30
15:30
15:30
Q4 2014
Y 2014
Q3 2015
Y 2014
Q3 2015
Y 2014
Y 2014
Q4 2014
Q4 2014
Q4 2014
Q4 2014
Q4 2014
Q4 2014
Q1 2015
Q4 2014
Q4 2014
Q4 2014
Q4 2014
Q1 2015
Q1 2015
Q3 2015
Y 2014
Y 2014
Q3 2015
Q2 2015
Q4 2014
Q4 2014
Q4 2014
Q4 2014
Q3 2015
Y 2014
Y 2014
Y 2014
Q4 2014
Y 2014
Q4 2014
Q1 2015
Q4 2014
Q4 2014
Q4 2014
Q4 2014
Q4 2014
Q1 2015
Y 2014
Q4 2014
Q4 2014
Y 2014
Q3 2015
Q4 2014
Q4 2014
Q3 2015
Q3 2015
Q3 2015
Y 2014
Y 2014
S1 2015
Q4 2014
Q4 2014
Q4 2014
Q4 2014
Q4 2014
Q4 2014
Q4 2014
Y 2014
Q2 2015
Q4 2014
Q4 2014
Q4 2014
Y 2014
Q1 2015
Q4 2014
Q4 2014
Q4 2014
Q4 2014
8:00
9:00
Bef-mkt
15:00
Aft-mkt
Aft-mkt
Aft-mkt
6:30
8:15
9:00
9:00
Bef-mkt
Bef-mkt
Bef-mkt
Bef-mkt
Bef-mkt
Bef-mkt
14:45
23:00
23:05
23:15
Aft-mkt
Aft-mkt
8:00
8:00
8:00
8:00
8:00
9:00
Bef-mkt
Bef-mkt
Bef-mkt
Bef-mkt
Bef-mkt
Bef-mkt
13:00
14:00
23:00
23:15
Aft-mkt
Aft-mkt
Aft-mkt
Aft-mkt
Aft-mkt
Aft-mkt
Aft-mkt
Aft-mkt
Actual
1.64
14300
0.081
10.891
4.99
10.207
0.156
0.52
0.75
0.25
0.79
0.66
2.47
0.77
0.89
1.11
0.72
1.85
0.91
0.27
0.114
2.683
0.035
EPS (local currency)
Estimate
Surprise Guidance
1.528
7.33%
15023.3
-4.82%
0.078
3.85%
10.631
2.45%
4.969
0.42%
10.071
1.35%
0.138
13.04%
0.913
-43.04%
0.733
2.32%
0.198
26.26%
0.686
15.16%
0.65
0.664
-0.60%
2.465
0.20%
0.727
5.91%
0.856
3.97%
1.095
1.37%
0.674
6.82%
1.643
12.60%
0.934
-2.57%
0.245
10.20%
0.125
2.69
0.02
0.408
1.339
0.859
0.117
0.357
7.327
1.416
1.082
0.627
0.955
0.486
1.2
0.725
2.166
1.29
1.25
3.788
2.212
1.068
6.814
1.418
12.103
0.021
1.598
0.3
37.957
65.176
165.728
4.095
18.692
0.292
0.214
0.857
0.639
0.334
0.83
1.377
3.186
0.936
0.415
0.389
0.315
0.482
3.526
0.891
2.382
0.662
-0.645
1.324
-8.80%
-0.26%
75%
1.2
1.25
0.21
0.63
1.084
0.385
0.855
1.31
Currency
USD
KRW
GBp
SEK
INR
DKK
EUR
USD
USD
USD
USD
USD
USD
USD
USD
USD
USD
USD
USD
USD
INR
EUR
CHF
EUR
USD
USD
USD
USD
USD
JPY
CHF
GBp
GBp
USD
EUR
USD
USD
USD
USD
USD
USD
USD
USD
EUR
USD
USD
DKK
HKD
USD
CAD
JPY
JPY
JPY
NOK
CHF
GBp
USD
USD
USD
USD
USD
USD
USD
GBp
USD
USD
USD
USD
EUR
USD
USD
USD
USD
USD
(*) Reported Value, (^) GAAP Value, (T) Tentative, (C) Confirmed Date, (E) Estimated Date
Source: Bloomberg
Please refer to the last pages of this report for important disclosures
Global Markets Overview
February 2, 2015
Research Department
GREEK MARKET - Corporate Actions
General Meetings
Company
GM Date
Time
Balkan Real Estate SA
3/2/15
15.00
Kleemann Hellas SA
4/2/15
14.00
MLS Multimedia SA
11/2/15
15.00
Alco Hellas SA
13/2/15
12.00
Bank of Greece
26/2/15
12.00
AGM: Annual General Meeting, EGM: Extra-ordinary General Meeting, Rep: Repetitive Meeting
Type
EGM
EGM
EGM
EGM
AGM
Comments
Dividends
Company
Interim Div
2014
X-Div
Date
Remaining Div
2014
X-Div
Date
Total Div
2014 (gross* )
X-Div
Date
Capital
X-Div
Return
Date
Notes
0.15 €
To be proposed at the 26/6/14 GM
0.20 €
To be proposed at the 17/6/14 GM
0.03 €
Approved by the 3/6/14 GM
1.50 €
Approved by the 29/5/14 GM
Approved by the 29/12/14GM
0.125 €
0.09 €
2/2/15
0.2017€ (gross) interim div. + 0.0283€ (net) distribution of tax free reserves (0.23€ total, 0.21€ net)
0.17
21/01/15
20/1/15
0.025 €
Nexans Hellas SA
Hellenic Exchanges - Athens St
Elve SA
Alpha Trust Mutual Fund Manage
Folli Follie SA
Loulis Mills SA
OPAP SA
0.2300 €
12/01/15
GEKE SA
Thrace Plastics Co SA
* The abovementioned dividend amounts are subject to a 25% withholding tax (Law 3943/2011)
(1) 0.65€ from retained earnings & reserves + 0.15€ interim dividend 2014. Net amount equals to 0.5461€+0.1250€=0.672€
Rights Issue / Bonus Issue - (Reverse) Splits
Company
Compucon Computer Applications
Ilyda SA
Alco Hellas SA
Kekrops SA
Compucon Computer Applications
Lamda Development SA
JUMBO SA
Kathimerini Publishing SA
Kathimerini Publishing SA
Terms
9 new / 4 old at 1.82€
1 new / 100 old at 0.90€
Rev. Split: 1 new / 5 old
3 new / 1 old at 0.40€
Rev. Split: 1 new / 11 old
0.79469... new / 1 old at 4.25€
Bonus shares: 1 new / 22 old
8 new / 1 old at 0.33€
Rev. Split: 2 new / 10 old
New
Rights
Exercise
Trading
shares
Period
Period trading day
13/10/14
15/10/14
16/10 - 30/10/2014 16/10 - 24/10/2014
18/11/14
5/9/14
Cease of trading: 1/9/2014
11/8 - 25/8/2014
11/8 - 19/8/2014
5/8/14
29/8/14
2/7/14
4/7/14
8/7/14
27/6 - 11/7/2014
23/6/14
25/6/14
27/6 - 7/7/2014 22/7/2014
- 11/3/2014
5/3/14
7/3/14
6/3/14
10/3 - 24/3/2014
4/3/14
10/3 - 18/3/2014
28/3/14
4/3/14
10/3/14
ExDate
Record
Date
Comments
& Notes
Approved by the 6/5 GM
Adjusted start share price 0.751€
Adjusted start share price 0.418€
Approved by the 12/2 GM
Adjusted price €4.46 after the split,
€0.788 after the increase
Mergers
Company
(1)
Elval - Hellenic Aluminium Ind
Absorbed Company
(2)
ETEM SA
Exchange
Terms (1/1)
1/1
Exchange
Terms (1/2)
1/6
Absorbed Company
Cease Trading Day
02/12/14
New Shares
Start Trading Day
5/12/14
Comments
Financial Calendar
Company
FY 2014 Results
Fourlis Holdings SA
24/2/15
Hellenic Telecommunications Or
26/2/15
Mytilineos Holdings SA
18/3/15
Bmkt: Before market opens, Amkt: After market closes, ND: Non distribution (of dividend)
Bold Colors indicate a new addition (stays bold for a couple of days) or a current action / event
Time
of Releases
Amkt
Bmkt
Amkt
Please refer to the last pages of this report for important disclosures
Global Markets Overview
February 2, 2015
Research Department
Bonds, Spreads, CDS
10 Yr Bond Yields
5 Yr Bond Yields
Greece, Germany, Ireland, Portugal, Spain
Germany, Ireland, Portugal, Spain, Greece
16
12
15
11
14
10
13
12
9
11
8
10
9
7
8
6
7
5
6
5
4
4
3
3
2
2
1
1
0
0
3/2/14
28/4/14
21/7/14
Greece
Germany
Ireland
13/10/14
Portugal
-1
3/2/14
5/1/15
Spain
28/4/14
Italy
Greek Spreads, 10 Yr Bonds (5 Yr n/a)
Germany
35835
-3
1,650
13/10/14
Portugal
Spain
5/1/15
Italy
Greece
Greek CDS, 5 Yr & 10 Yr Bonds (CMAN pricing)
66257
1,850
1,550
1,750
1,450
1,650
1,350
21/7/14
Ireland
1,550
1,250
1,450
1,150
1,350
1,050
1,250
950
1,150
850
750
1,050
650
950
550
28/11/14
850
8/12/14
18/12/14
28/12/14
Greek 10Yr Spread
7/1/15
17/1/15
27/1/15
14/1/15
Greek 5Yr Spread
20/1/15
23/1/15
Greek 5Yr CDS
Spreads and CDS, 10 Yr Bonds
-
Ireland, Portugal, Italy, Spain (CBIL pricing for CDS)
300
17/1/15
26/1/15
29/1/15
Greek 10Yr CDS
Spreads and CDS, 5 Yr Bonds
Ireland, Portugal, Italy, Spain (CBIL pricing for CDS)
220
280
200
260
180
240
220
160
200
140
180
523
160
120
140
100
725.1
702.1
120
80
100
60
80
60
40
40
20
390.16
20
0
22/12/14
Irish Spread
Portugese CDS
Italian Spread
Source: Bloomberg
0
22/12/14
Irish CDS
Spanish Spread
Italian CDS
Portugese Spread
Spanish CDS
Irish Spread (6Yr)
Portugese CDS
Italian Spread
Irish CDS
Spanish Spread
Italian CDS
Portugese Spread
Spanish CDS
Please refer to the last pages of this report for important disclosures
OTHER IMPORTANT DISCLOSURES
- The present research report has been published for the first time today/ or on the…./…./……
- The above research material is provided to investors exclusively for information purposes and is not to be used or considered as an offer, advice or invitation to sell or buy or
subscribe for any financial instrument mentioned in the present report. Prelium Investment Services SA shall not treat recipients as its customers by virtue of receipt of this
report. Investors should not in any case rely exclusively upon information contained in this report in order to form any investment decision, but they should at their own and on
an independent basis analyze, evaluate and assess the appropriateness and the value of any particular investment, using the statements and recommendations of this report
only as one of the factors which could effect their investment decisions The investments or services contained or referred to in this report may not be suitable for all investors
and it is recommended that the investors, apart from the independent evaluation of particular investment and strategies, should consult an independent investment advisor if
they are in doubt about such investments or investment services. Securities or the other financial instruments referred to in the research report are subject to investment risks,
including the possible loss of the principal capital invested.
- The clients of Prelium Investment Services SA may already have or may have in the future a position or engage in transactions in any of the financial instruments mentioned
herein or any related investment.
- Although the information or opinions herein was obtained or compiled form sources that are deemed reliable, the accuracy, completeness or correctness of those information
or opinions can not be guaranteed. In producing the research reports, members of Prelium Investment Services SA Research Department may have received assistance from
the subject company (-ies), referred to in this report. Any such assistance may include access to sites of the issuers, visits to certain operations of the subject company (-ies),
meetings with management, employees or other parties associated with the subject company (-ies), and handing by them of historical data regarding the subject company (-ies)
(financial statements and other financial data), as well as of all publicly available information regarding strategy and financial targets. Prelium Investment Services SA research
personnel are prohibited from accepting payment or reimbursement of travel expenses from site visits to subject companies. It should be presumed that the author of this report,
in most cases, has had discussions with the subject company (-ies) to ensure factual accuracy prior to publication. All opinions and estimates in this report reflect the personal
views and judgments of the author and are given in good faith. In addition, those opinions and estimates apply as of the date of the issuance of this report but are subject to
changes without any prior notice. Prices and availability of financial instruments are also subject to changes without prior notice. It should be assumed that any prices quoted in
this report are the closing prices of the last session of the Athens Stock Exchange, unless otherwise indicated. Although Prelium Investment Services SA does not set a
predetermined frequency for publications, it is in the intention of Prelium Investment Services SA to provide research coverage of the subject company (-ies), including in
response to any news affecting these issuers, unless there is lack of news and capacity. Prelium Investment Services SA does not accept any liability whatsoever for any direct
or consequential loss arising from any use of this document or its contents or in respect of any errors or omissions thereto.
PRELIUM SECURITIES & INVESTMENT SERVICES S.A.
Member of the Athens Stock Exchange, Member of the Athens Derivatives Exchange
Head Office: S. Davaki 1 & Kifisias Ave., 115 26 Athens, Greece, Tel. +30 210 36 77 000, Fax +30 210 69 26 403
e-mail [email protected], www.prelium.com
INSTITUTIONAL SALES
RESEARCH DEPARTMENT
Babis Angeletopoulos, [email protected]
Emi Moundrou, [email protected]
FOREIGN MARKETS
ASSET MANAGEMENT
Ioanna Karamani, [email protected]
Konstantinos Asimakopoulos, [email protected]
DERIVATIVES
Andreas Nikolopoulos, [email protected]


© Copyright 2026