Oportunidades de la industria del gas natural en AMÉRICA
OPORTUNIDADES DE LA INDUSTRIA DEL GAS NATURAL
EN AMÉRICA LATINA
October 22, 2015
RENÉ RAMÍREZ ROMERO
Market description
• 49 Billion dollar market in 2015, world 3rd LPG , 6th gasoline, and 8th NG largest consumer markets,
• Deficit in high value O&G products, net imports: gasoline (48%), diesel and jet fuel (29%), LPG (35%), NG (27%) and petrochemicals (>50%).
• Expected growth in O&G products demand of about 3% per year for the next 5 years.
• Strategically located in the North America Region, large northern border with the USA and a 200 km isthmus in the south that may capture the
high price differential between the Pacific and the Atlantic oceans
• Pemex has a competitive advantage in Production & Logistics through its existing infrastructure
Producer Zone
Diesel
10,833
Refinery
Petrochemical Center
Gas Processing Center
Camargo
Gasolines
23,137
2015
LPG
4,964
Sales Point
Pipeline
Reynosa
Monterrey
Burgos
Maritime Route
Cadereyta
$48,637
MMUSD1
Natural gas
3,491
Madero
Arenque
Poza Rica
Salamanca
Guadalajara
1. The values for 2015 are annualized.
Others, 614
Asphalts, 519
Petrochemicals
1,760
Kerosene
Fuel oil
1,812
1,507
Tula
Cd. México
Matapionche
Pajaritos Morelos
La Venta
San Martín
Cd. Pemex
Cosoleacaque
Minatitlán
N. Pemex
Cangrejera
Cactus
Salina
Cruz
1
Industry Transition
…to a productive state
enterprise
• Asset manager.
• Supply obligation.
• Volumetric approach.
• Business administrator.
• Prices set by the Ministry of
Finance.
.
• Economic supply with obligations.
• Public debt.
• Maximize company value.
• Balance sheet and credit rating not
linked.
• Prices set by the market.
• Free license to operate.
• Link between balance sheet and credit
rating.
• Rigid regulatory framework.
• Company debt.
Efficiency
• Operating license subject to performance.
From state-owned
monopoly…
• Flexible regulatory framework.
A cultural change is necessary to move from an oil monopoly to a productive enterprise.
2
Transforming PEMEX
New Legal Framework
New
corporate
governance
New Tax
Regime
Autonomy
budget
Change Strategy
New
Procurement
System
PEMEX:
A competitive
business
Change in Structure
Autonomy
managerial
New
compensation
scheme
New
internal
control
regime
Round
zero
Partnerships
strategic
A
L
I
G
N
restructuring
pension funds
Cultural exchange
3
PEMEX Downstream
• Natural gas
• Natural gasoline
• Benzene
• Naphtha
• Crude oil
Gas
Petrochemicals
• Non associated gas
• Associated gas
• Condensates
Processing
Refining
Project management
Operating model
Input
• Sweetening
• Cryogenics
• Fractionating
• Hydro desulfurization
• Reforming
• Aromatic
fractionation
• Reforming
• Synthesis / reaction
Products
• Natural gas
• LPG
• Natural gasoline
• Sulphur
• Ethane
• Styrene
• Xylenes
• Benzene
• Toluene
• HAO
• Methanol
• Petrochemicals
• Gasoline
• Jet fuel
• Diesel
• Fuel oil
• Lubricants
• Distillation
• Reforming
• Coking
Our
clients
Residential
• Asphalts
• Coke
• Sulphur
• Propylene
Industrial
Power
Infrastructure
6
Refineries
9
Gas Processing
Centers
2
Petrochemicals
Centers
Transportation
4
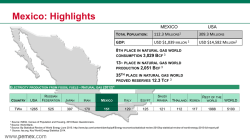
Mexico Gas Natural: Highlights
TOTAL POPULATION:
112,336,5381
GDP:
USD $834,968 MILLON 2
8TH PLACE IN NATURAL GAS
CONSUMPTION 3,029 BCF 3
WORLD
13TH PLACE IN NATURAL GAS
PRODUCTION 2,051 BCF 3
WORLD
35TH PLACE IN NATURAL GAS WORLD
PROVED RESERVES 12.3 TCF 3
ELECTRICITY PRODUCTION FROM FOSSIL FUELS - NATURAL GAS (2012)4
RUSSIAN
COUNTRY
USA
FEDERATION
JAPAN
IRAN
MEXICO
ITALY
EGYPT
SAUDI
ARABIA
TWH
1265
525
397
170
151
129
125
121
1
REST OF THE
THAILAND KOREA
112
117
WORLD
WORLD
1988
5100
Source: INEGI. Census of Population and Housing, 2010 Basic Questionnaire.
INEGI. 2nd semester 2014. http://www.inegi.org.mx/inegi/contenidos/espanol/prensa/comunicados/pibbol.pdf Exchage rate 02.10.2015: 16.81 Source Banxico.
3 Source: Bp Statistical Review of World Energy June 2015. http://www.bp.com/content/dam/bp/pdf/Energy-economics/statistical-review-2015/bp-statistical-review-of-world-energy-2015-full-report.pdf
4. Source: Iea.org, Key World Energy Statistics 2014.
2 Source:
Natural gas consumption by sector
Consumption Distribution By Sector (August 2015)
TOTAL: 5,344 MMCFPD
COMMERCIALS
352
SELF-GENERATION
141
7%
3%
Pemex Exploración y Producción
ELECTRICITY
1,410
26%
40%
7%
17%
DISTRIBUTORS
388
INDUSTRIAL
894
SOURCE: BDI, SEPT 2015
PEMEX
2,159
1,262
Pemex Gas y Petroquímica Básica
390
Pemex Petroquímica
187
Pemex Corporativo
320
Estimate trends for mexican industrial demand of
natural gas
3 000
2 500
MMcfpd
2 000
1 500
1 000
500
-
2013
Industrial 1 240
2014
1 366
2015
1 590
Source: SENER “Prospectiva de gas natural y gas LP 2014-2028”
2016
1 713
2017
1 804
2018
1 910
2019
1 973
2020
2 033
2021
2 100
2022
2 166
2023
2 234
2024
2 304
2025
2 383
2026
2 462
2027
2 546
2028
2 630
Natural gas forecast demand in Mexico 2014-2019
MMCFPD
11 300
9 300
7 300
5 300
3 300
1 300
-700
'14
'15
Domestic Supply
AVERAGE
ANNUAL
GROWTH
/2 It considers esports.
Source: SENER “Prospectiva de gas natural y gas LP 2014-2028”
-2.19%
'16
'17
'18
Imports
Demand
11%
4%
'19
Connecting Mexico with better markets
Tennesse
zone 4-300 Leg
USA
Henry Hub
NET
Mexico
Agua Dulce
Los Ramones I
EXPANSIONS ARE
GIVING THE
Los Ramones
II North
MEXICO
THE MEXICAN PIPELINE
POSSIBILITY TO
Los Ramones II
South
ACCESS IN CHEAPER
MARKETS IN THE
EXISTING PIPELINES
PROPOSED PIPELINES
U.S.
Related market prices
HYDROCARBONS*
CRUDE OIL (WTI, CUSHING OKLAHOMA NYMEX)
HEATING OIL (DIESEL, NYMEX NEW YORK HARBOR)
PROPANE (MONT BELVIEU, TX.)
NATURAL GAS (HENRY HUB, NYMEX)
FUEL OIL (HIGH SULFUR FUEL OIL, NYMEX)
GASOLINE (NYMEX)
ORIGINAL PRICES
$46.14 USD/BARRIL
$1.5 USD/GAL
$43.8USD/GALÓN
$2.5 USD/MMBTU
$212 USD/GAL
$1.27 USD/GAL
EQUIVALENT PRICES
$7.9 USD/MMBTU
$11 USD/MMBTU
$4.8 USD/MMBTU
$2.5 USD/MMBTU
$5.4 USD/MMBTU
$10.1 USD/MMBTU
USD/MMBtu
11
10.1
7,9
5.4
4.8
2.5
CRUDE OIL
Crudo
Information as of Oct 19, 2015
*Reference Prices
HEATING
Heating
Oil OIL
PROPANE
Propano
NATURAL
Gas
Natural GAS
FUEL OIL
Combustóleo
Elaborated by Pemex Gas y Petroquímica Básica using Thomson Reuters prices .
GASOLINE
Gasolina
PRICES OF NATURAL GAS
Natural gas international prices
PRICES AS OCTOBER 14TH 2015
(USD/MMBTU)
$6.04/6.02
Dutch TTF
$ 2.52/2.52
Nymex Henry Hub
$2.57/2.58
$6.23/6.06
UK NBP
$6.64/6.68
Italian PSV
So Cal
$6.65/6.60
$6.45/6.40
EUROPA
Japón
China
ASIA
$ 5.37/3.50
$6.06/6.04
Algonquin
Germany EGT
$2.45/2.46
Reynosa
* Prices in green are from a previous week
Source: Elaborated by Pemex Gas y Petroquímica Básica using Platts International Gas Reports.
$6.65/6.60
$6.65/6.60
India
Corea del Sur
Net Gas Natural exports from US to Mexico (2014-2015)
NET EXPORTS 2014-2015 (MMBTU/D)
1
2
2014
2015
1. WESTTEXAS
299,339
45,940
2. SOUTH TEXAS
979,800
1,227,949
1,279,139
1,273,889
TOTAL
WEST TEXAS
2014
WEST TEXAS, AZ. CALIF.
2015
MMBTU/D
SOUTH TEXAS TRANSPORTATION
SOUTH TEXAS (MMBTU/D)
2014
2015
TENNESSEE
215,398
67,652
K.M. BORDER
216,192
173,816
SAMALAYUCA
89,718
0
CHIHUAHUA-CDJ
117,965
38,796
K.M. TEXAS
422,316
452,441
NACO
34,801
7,144
TENNESSEE RB
73,768
0
NORTE II
56,855
0
TETCO
41,818
2,712
0
0
NET
10,308
531,328
299,339
45,940
979,800
1,227,949
NORTH BAJA
TOTAL:
Source: BDI, Sept 2015
TOTAL:
Net Gas Natural exports from US to Mexico (2014 - 2015)
MMBTu/day
2015
2014
1 486 642
1 422 843
1 208 740
1 168 491
1 488 615
1 402 086
1 324 219
1 318 019 1 285 747 1 286 183
1 139 254
1 447 268
1 368 500
1 424 591
1 380 998
1 307 756
1 270 997
1 051 378
1 133 078
1 108 041
2014
2015
1 011 832
Ene
Jan
Feb
Mar
Abr
Apr
May
Jun
Jul
Ago
Aug
Sep
Oct
Nov
Dic
Dec
NET AVERAGE EXPORTS 2014 – 2015 (MMBTU/D)
* Jan-Sep 2015
2014
2015*
1,279,139
1,273,889
Source: BDI 2015 September
Natural gas infrastructure projects 2015-2019
Sásabe
Pipelines
1.El Encino – La Laguna
2.Sur de Texas – Tuxpan (submarino)
3. Tula – Villa de Reyes
4. Tuxpan – Tula
5. Samalayuca – Sásabe
6. Colombia – Escobedo
7. Jáltipan – Salina Cruz
8. Los Ramones – Cempoala
9. Villa de Reyes - Aguascalientes – Guadalajara
10. La Laguna – Centro
11. Lázaro Cárdenas – Acapulco
12. Salina Cruz – Tapachula
San Isidro
5
Samalayuca
Puerto Libertad
El Encino
Colombia
Guaymas
1
6
Camargo
El Oro
La Laguna
Topolobampo
Escobedo
Los Ramones
Durango
Mazatlán
LNG regasification terminals
Pipelines in operation
Concluded Pipelines (2013/2014/2015)
Pipelines in construction (2015/2016)
Zacatecas
San Luis Potosí
Aguascalientes
Guadalajara
8
Altamira
V. Reyes
Tamazunchale
3
9
4
Naranjos
Tuxpan
Tula
Apaseo el
Alto
Nativitas
Cempoala
Huexca
Pipelines included at “Plan Quinquenal”
Compression Station “El Cabrito”
2
10
Lázaro
Cárdenas
11
Acapulco
Ciudad Pemex
Jáltipan
Nuevo Pemex
7
Salina
Cruz
Source: SENER. Plan Quinquenal de Transporte y Almacenamiento Nacional Integrado de Gas Natural 2015-2019.
12
Tapachula
Conclusions
• PEMEX, as a Productive State Enterprise aims to maximize economic value and profitability
for the Mexican state, by improving its productivity to maximize oil and gas revenues and
contribute to national development.
• PEMEX operation as the only producer of hydrocarbons in the country has changed by a new
model of open competition.
• PEMEX can take advantage of the opportunity to establish new legal framework with strategic
partners to consider alliances or joint ventures to encourage the country's competitiveness to
ensure industry and a national economy that transforms Mexico.
© Copyright 2026
