
ResMed Inc.
UNITED STATES
SECURITIES AND EXCHANGE COMMISSION
For personal use only
WASHINGTON, DC 20549
⌧
FORM 10-Q
(Mark One)
QUARTERLY REPORT PURSUANT TO SECTION 13 OR 15(D) OF THE SECURITIES
EXCHANGE ACT OF 1934
For the quarterly period ended December 31, 2014
TRANSITION REPORT PURSUANT TO SECTION 13 OR 15(D) OF THE SECURITIES
EXCHANGE ACT OF 1934
For the transition period from
to
Commission File Number: 001-15317
ResMed Inc.
(Exact name of registrant as specified in its charter)
Delaware
(State or other jurisdiction of incorporation or organization)
98-0152841
(I.R.S. Employer Identification No.)
9001 Spectrum Center Blvd.
San Diego, CA 92123
United States of America
(Address of principal executive offices)
(858) 836-5000
(Registrant’s telephone number, including area code)
Indicate by check mark whether the registrant (1) has filed all reports required to be filed by Section 13 or 15(d) of the Securities
Exchange Act of 1934 during the preceding 12 months (or for such shorter period that the registrant was required to file such reports)
and (2) has been subject to such filing requirements for the past 90 days. Yes
No
⌧
Indicate by check mark whether the registrant has submitted electronically and posted on its corporate Web site, if any, every
Interactive Data File required to be submitted and posted pursuant to Rule 405 of Regulation S-T (§232.405 of this chapter) during
the preceding 12 months (or for such shorter period that the registrant was required to submit and post such files). Yes
No
⌧
Indicate by check mark whether the registrant is a large accelerated filer, an accelerated filer, a non-accelerated filer, or a smaller
reporting company. See the definitions of “large accelerated filer,” “accelerated filer” and “smaller reporting company” in Rule 12b-2
of the Exchange Act. (Check one):
Non-accelerated filer
Smaller reporting company Indicate by check mark whether the registrant is a shell company (as defined in Rule 12b-2 of the Exchange Act). Yes No ⌧
Large accelerated filer
⌧
(Do not check if a smaller reporting company)
Accelerated filer
At January 21, 2015, there were 140,554,529 shares of Common Stock ($0.004 par value) outstanding. This number excludes
37,944,964 shares held by the registrant as treasury shares.
RESMED INC. AND SUBSIDIARIES
INDEX
Financial Information
3
Item 1
Financial Statements
3
Condensed Consolidated Balance Sheets (Unaudited) as of December 31, 2014 and June 30, 2014
3
Condensed Consolidated Statements of Income (Unaudited) for the Three and Six Months Ended December 31, 2014
and 2013
4
Condensed Consolidated Statements of Comprehensive Income (Unaudited) for the Three and Six Months Ended
December 31, 2014 and 2013
5
Condensed Consolidated Statements of Cash Flows (Unaudited) for the Six Months Ended December 31, 2014 and
2013
6
Notes to the Condensed Consolidated Financial Statements (Unaudited)
7
For personal use only
Part I
Item 2
Management’s Discussion and Analysis of Financial Condition and Results of Operations
16
Item 3
Quantitative and Qualitative Disclosures About Market Risk
23
Item 4
Controls and Procedures
25
Part II Other Information
Item 1
26
Legal Proceedings
26
Item 1A Risk Factors
26
Item 2
Unregistered Sales of Equity Securities and Use of Proceeds
26
Item 3
Defaults Upon Senior Securities
26
Item 4
Mine Safety Disclosures
26
Item 5
Other Information
26
Item 6
Exhibits
27
Signatures
28
2
PART I – FINANCIAL INFORMATION
Item 1. Financial Statements
Item 1
RESMED INC. AND SUBSIDIARIES
Condensed Consolidated Balance Sheets (Unaudited)
(In US$ thousands, except share and per share data)
For personal use only
December 31,
2014
Assets
Current assets:
Cash and cash equivalents
Accounts receivable, net of allowance for doubtful accounts of $12,209 and $10,971 at
December 31, 2014 and June 30, 2014, respectively
Inventories (note 3)
Deferred income taxes
Income taxes receivable
Prepaid expenses and other current assets
Total current assets
Non-current assets:
Property, plant and equipment, net (note 4)
Goodwill and other intangible assets, net (note 6)
Deferred income taxes
Other assets
Total non-current assets
Total assets
Liabilities and Stockholders’ Equity
Current liabilities:
Accounts payable
Accrued expenses
Deferred revenue
Income taxes payable
Deferred income taxes
Current portion of long-term debt (note 7)
Total current liabilities
Non-current liabilities:
Deferred income taxes
Deferred revenue
Long-term debt (note 7)
Income taxes payable
Total non-current liabilities
Total liabilities
Commitments and contingencies (note 12)
Stockholders’ equity: (note 10)
Preferred stock, $0.01 par value, 2,000,000 shares authorized; none issued
Common stock, $0.004 par value, 350,000,000 shares authorized; 178,328,781 issued and
140,383,817 outstanding at December 31, 2014 and 176,747,039 issued and 140,304,544
outstanding at June 30, 2014
Additional paid-in capital
Retained earnings
Treasury stock, at cost, 37,944,964 shares at December 31, 2014, and 36,442,495 shares at
June 30, 2014
Accumulated other comprehensive income
Total stockholders’ equity
Total liabilities and stockholders’ equity
$
880,695
$
905,730
340,427
218,062
29,675
7,927
81,705
1,558,491
359,593
165,418
31,908
14,853
78,707
1,556,209
408,219
320,966
10,740
28,146
768,071
$ 2,326,562
434,277
334,510
18,755
17,211
804,753
$ 2,360,962
80,004
134,071
36,883
8,027
625
259,610
85,405
130,656
42,370
10,392
717
18
269,558
9,615
17,472
449,663
1,754
478,504
738,114
10,716
16,352
300,770
5,318
333,156
602,714
-
-
562
1,161,335
1,876,359
561
1,117,644
1,780,396
(1,368,308)
(81,500)
1,588,448
$ 2,326,562
(1,291,910)
151,557
1,758,248
$ 2,360,962
See the accompanying notes to the unaudited condensed consolidated financial statements.
3
June 30,
2014
PART I – FINANCIAL INFORMATION
Item 1
For personal use only
RESMED INC. AND SUBSIDIARIES
Condensed Consolidated Statements of Income (Unaudited)
(In US$ thousands, except per share data)
Six Months Ended
December 31,
2014
2013
Three Months Ended
December 31,
2014
2013
Net revenue
Cost of sales
Gross profit
Operating expenses:
Selling, general and administrative
Research and development
Amortization of acquired intangible assets
Total operating expenses
Income from operations
Other income, net:
Interest income, net
Other, net
Total other income, net
Income before income taxes
Income taxes
Net income
Basic earnings per share
Diluted earnings per share (note 2)
Dividend declared per share
Basic shares outstanding (000’s)
Diluted shares outstanding (000’s)
$422,952
159,730
263,222
$384,341
135,582
248,759
$803,351
302,816
500,535
$742,003
265,263
476,740
122,520
29,294
2,262
154,076
109,146
111,748
29,537
2,454
143,739
105,020
233,041
59,318
4,355
296,714
203,821
213,071
56,900
4,866
274,837
201,903
5,418
947
6,365
115,511
24,330
$ 91,181
$ 0.65
$ 0.64
$ 0.28
140,048
142,202
6,752
(2,311)
4,441
109,461
22,825
$ 86,636
$ 0.61
$ 0.60
$ 0.25
142,202
145,335
11,003
2,617
13,620
217,441
43,001
$174,440
$ 1.25
$ 1.22
$ 0.56
140,104
142,468
13,166
(3,539)
9,627
211,530
43,964
$167,566
$ 1.18
$ 1.15
$ 0.50
142,103
145,412
See the accompanying notes to the unaudited condensed consolidated financial statements.
4
PART I – FINANCIAL INFORMATION
Item 1
For personal use only
RESMED INC. AND SUBSIDIARIES
Condensed Consolidated Statements of Comprehensive Income (Unaudited)
(In US$ thousands)
Six Months Ended
December 31,
2014
2013
Three Months Ended
December 31,
2014
2013
Net income
Other comprehensive income:
Foreign currency translation gain (loss) adjustments
Comprehensive income (loss)
$ 91,181
$ 86,636
$ 174,440
$167,566
(107,949)
$ (16,768)
(51,368)
$ 35,268
(233,057)
$ (58,617)
(13,165)
$154,401
See the accompanying notes to the unaudited condensed consolidated financial statements.
5
PART I – FINANCIAL INFORMATION
Item 1
RESMED INC. AND SUBSIDIARIES
Condensed Consolidated Statements of Cash Flows (Unaudited)
(In US$ thousands)
For personal use only
Six Months Ended
December 31,
2014
2013
Cash flows from operating activities:
Net income
Adjustment to reconcile net income to net cash provided by operating activities:
Depreciation and amortization
Gain on divestment of business
Stock-based compensation costs
Foreign currency revaluation
Excess tax benefit from stock-based compensation arrangements
Changes in operating assets and liabilities, net of effect of acquisitions:
Accounts receivable, net
Inventories, net
Prepaid expenses, net deferred income taxes and other current assets
Accounts payable, accrued expenses and other liabilities
Net cash provided by operating activities
Cash flows from investing activities:
Purchases of property, plant and equipment
Patent registration costs
Business acquisitions, net of cash acquired
Investments in cost-method investments
Proceeds from divestiture of business
Purchases of foreign currency options
Payments on maturity of foreign currency contracts
Net cash used in investing activities
Cash flows from financing activities:
Proceeds from issuance of common stock, net
Excess tax benefit from stock-based compensation arrangements
Purchases of treasury stock
Payment of business combination contingent consideration
Proceeds from borrowings, net of borrowing costs
Repayment of borrowings
Dividend paid
Net cash used in financing activities
Effect of exchange rate changes on cash
Net increase in cash and cash equivalents
Cash and cash equivalents at beginning of period
Cash and cash equivalents at end of period
Supplemental disclosure of cash flow information:
Income taxes paid, net of refunds
Interest paid
Fair value of assets acquired, excluding cash
Liabilities assumed
Goodwill on acquisition
Deferred payments
Fair value of contingent consideration
Total purchase price, excluding contingent consideration
$ 174,440
37,451
(709)
23,084
390
(10,889)
36,450
21,460
1,970
(9,486)
11,067
(64,406)
(4,309)
26,419
192,538
22,061
(29,634)
2,094
(37,891)
174,590
(39,675)
(4,810)
(17,781)
(10,500)
468
(28,300)
(100,598)
(36,426)
(3,343)
(3,172)
(1,525)
(405)
(4,079)
(48,950)
9,931
10,889
(84,055)
(458)
149,000
(19)
(78,477)
6,811
(123,786)
(25,035)
905,730
$ 880,695
10,136
9,486
(93,592)
(442)
492,908
(360,019)
(71,125)
(12,648)
(16,365)
96,627
876,048
$ 972,675
$ 28,930
$ 2,744
$ 15,171
(6,585)
12,315
(1,903)
(1,217)
$ 17,781
$ 61,724
$ 3,238
$ 2,257
(829)
3,227
(1,483)
$ 3,172
See the accompanying notes to the unaudited condensed consolidated financial statements.
6
$ 167,566
PART I – FINANCIAL INFORMATION
Item 1
RESMED INC. AND SUBSIDIARIES
Notes to the Condensed Consolidated Financial Statements
(Unaudited)
(1)
Summary of Significant Accounting Policies
For personal use only
Organization and Basis of Presentation
ResMed Inc. (referred to herein as “we”, “us”, “our” or the “Company”) is a Delaware corporation formed in March 1994 as a holding
company for the ResMed Group. Through our subsidiaries, we design, manufacture and market equipment for the diagnosis and
treatment of sleep-disordered breathing and other respiratory disorders, including obstructive sleep apnea. Our manufacturing
operations are located in Australia, Singapore, France, Germany, Malaysia and the United States. Major distribution and sales sites are
located in the United States, Germany, France, the United Kingdom, Switzerland, Australia, Japan, Norway and Sweden.
The accompanying unaudited condensed consolidated financial statements have been prepared in accordance with U.S. generally
accepted accounting principles (“U.S. GAAP”) for interim financial information and with the instructions to Form 10-Q and Article 10
of Regulation S-X of the U.S. Securities and Exchange Commission (“SEC”). Accordingly, they do not include all of the information
and footnotes required by U.S. GAAP for complete financial statements. In the opinion of management, all necessary adjustments,
which consisted only of normal recurring items, have been included in the accompanying financial statements to present fairly the
results of the interim periods. The results of operations for the interim periods presented are not necessarily indicative of the results that
may be expected for the year ending June 30, 2015.
The condensed consolidated financial statements for the three and six months ended December 31, 2014 and 2013 are unaudited and
should be read in conjunction with the consolidated financial statements and notes thereto included in our Form 10-K for the year
ended June 30, 2014.
New Accounting Pronouncements
In May, 2014, the FASB issued ASU No. 2014-09, Revenue from Contracts with Customers, which requires an entity to recognize the
amount of revenue to which it expects to be entitled for the transfer of promised goods or services to customers. The ASU will replace
most existing revenue recognition guidance in U.S. GAAP when it becomes effective. The new standard is effective for the Company
beginning in the first quarter of fiscal year 2018. Early application is not permitted. The standard permits the use of either the
retrospective or cumulative effect transition method. The Company is evaluating the effect that ASU 2014-09 will have on its
consolidated financial statements and related disclosures. The Company has not yet selected a transition method nor has it determined
the effect of the standard on its ongoing financial reporting.
(2)
Earnings Per Share
Basic earnings per share is computed by dividing the net income available to common stockholders by the weighted average number of
shares of common stock outstanding. For purposes of calculating diluted earnings per share, the denominator includes both the
weighted average number of shares of common stock outstanding and the number of dilutive common stock equivalents such as stock
options and restricted stock units.
Stock options and restricted stock units of 199,443 and 232,176, for the three months ended December 31, 2014 and 2013, respectively,
and stock options and restricted stock units of 176,725 and 216,558 for the six months ended December 31, 2014 and 2013,
respectively, were not included in the computation of diluted earnings per share as the effect of exercising these options would have
been anti-dilutive.
Basic and diluted earnings per share for the three and six months ended December 31, 2014 and 2013 are calculated as follows (in
thousands except per share data):
Three Months Ended
December 31,
2014
Numerator:
Net Income, used in calculating diluted earnings per share
Denominator:
Basic weighted-average common shares outstanding
Effect of dilutive securities:
Stock options and restricted stock units
Diluted weighted average shares
Basic earnings per share
Diluted earnings per share
7
2013
Six Months Ended
December 31,
2014
2013
$ 91,181
$ 86,636
$174,440
$167,566
140,048
142,202
140,104
142,103
2,154
142,202
$ 0.65
$ 0.64
3,133
145,335
$ 0.61
$ 0.60
2,364
142,468
$ 1.25
$ 1.22
3,309
145,412
$ 1.18
$ 1.15
PART I – FINANCIAL INFORMATION
Item 1
RESMED INC. AND SUBSIDIARIES
Notes to the Condensed Consolidated Financial Statements
(Unaudited)
(3) Inventories
For personal use only
Inventories were comprised of the following at December 31, 2014 and June 30, 2014 (in thousands):
Raw materials
Work in progress
Finished goods
Total inventories
December 31, 2014
June 30, 2014
$
$ 53,680
3,358
108,380
$ 165,418
$
68,963
4,438
144,661
218,062
(4) Property, Plant and Equipment
Property, plant and equipment were comprised of the following as of December 31, 2014 and June 30, 2014 (in thousands):
Machinery and equipment
Computer equipment
Furniture and fixtures
Vehicles
Clinical, demonstration and rental equipment
Leasehold improvements
Land
Buildings
Accumulated depreciation and amortization
Property, plant and equipment, net
December 31, 2014
June 30, 2014
$
$ 200,929
133,157
42,631
4,757
101,453
30,361
62,468
266,771
842,527
(408,250)
$ 434,277
$
192,736
137,240
40,091
5,643
89,506
28,860
56,916
243,915
794,907
(386,688)
408,219
(5) Cost-Method Investments
The aggregate carrying amount of our cost-method investments at December 31, 2014 and June 30, 2014, was $25.4 million and
$14.9 million, respectively, and is included in the non-current balance of other assets on the condensed consolidated balance
sheets.
We periodically evaluate the carrying value of our cost-method investments, when events and circumstances indicate that the
carrying amount of an asset may not be recovered. We estimate the fair value of our cost-method investments to assess whether
impairment losses shall be recorded using Level 3 inputs. These investments include our holdings in privately held service and
research companies that are not exchange traded and therefore not supported with observable market prices. However, these
investments are valued by reference to their net asset values that can be market supported and unobservable inputs including
future cash flows. During the six months ended December 31, 2014 and 2013, we did not recognize any impairment losses
related to our cost-method investments. We have determined that the fair value of our investments exceed their carrying values.
The following table shows a reconciliation of the changes in our cost-method investments during the six months ended
December 31, 2014 and 2013 (in thousands):
Six Months Ended December 31,
2014
Balance at the beginning of the period
Investments
Balance at the end of the period
$
$
8
14,850
10,500
25,350
2013
$
$
4,000
1,525
5,525
PART I – FINANCIAL INFORMATION
Item 1
RESMED INC. AND SUBSIDIARIES
Notes to the Condensed Consolidated Financial Statements
(Unaudited)
(6) Goodwill and Other Intangible Assets, net
For personal use only
Goodwill
Changes in the carrying amount of goodwill for the six months ended December 31, 2014, and 2013 were as follows (in
thousands):
Six Months Ended December 31,
Balance at the beginning of the period
Business acquisition
Foreign currency translation adjustments
Balance at the end of the period
2014
2013
$ 289,312
12,315
(29,008)
$ 272,619
$ 274,829
3,227
11,989
$ 290,045
Other Intangible Assets
Other intangible assets were comprised of the following as of December 31, 2014, and June 30, 2014 (in thousands):
Developed/core product technology
Accumulated amortization
Developed/core product technology, net
Trade names
Accumulated amortization
Trade names, net
Non-compete agreements
Accumulated amortization
Non compete agreements, net
Customer relationships
Accumulated amortization
Customer relationships, net
Patents
Accumulated amortization
Patents, net
Total other intangibles, net
December 31, 2014
June 30, 2014
$
$ 76,015
(54,073)
21,942
2,784
(2,697)
87
2,135
(1,768)
367
24,593
(20,877)
3,716
70,734
(51,648)
19,086
$ 45,198
$
67,579
(50,831)
16,748
2,716
(2,420)
296
1,849
(1,667)
182
32,598
(19,453)
13,145
65,795
(47,819)
17,976
48,347
Intangible assets consist of patents, customer relationships, trade names, non-compete agreements and developed/core product
technology. We amortize intangible assets over the estimated useful life of the assets, generally between two and nine years.
There are no expected residual values related to these intangible assets.
9
PART I – FINANCIAL INFORMATION
Item 1
RESMED INC. AND SUBSIDIARIES
Notes to the Condensed Consolidated Financial Statements
(Unaudited)
(7) Long-Term Debt
For personal use only
Long-term debt at December 31, 2014 and June 30, 2014 consists of the following (in thousands):
Current long-term debt
Non-current long-term debt
Total long-term debt
December 31, 2014
June 30, 2014
$
$
$
449,663
449,663
18
300,770
$ 300,788
Credit Facility
On October 31, 2013, we entered into a credit agreement, as borrower, with lenders, including Union Bank, N.A., as
administrative agent, joint lead arranger, swing line lender and letters of credit issuer, and HSBC Bank USA, National
Association, as syndication agent and joint lead arranger. Our obligations under the credit agreement are guaranteed by ResMed
Corp. and ResMed Motor Technologies Inc., two of our U.S. subsidiaries.
The credit agreement provides a $700 million senior unsecured five-year revolving credit facility, with an uncommitted option
to increase the credit facility by an additional $300 million. The credit facility also includes a $25 million sublimit for letters of
credit. The credit facility terminates on October 31, 2018, when all unpaid principal and interest under the loans must be repaid.
The outstanding principal amount due under the credit facility will bear interest at a rate equal to LIBOR plus 1.0% to 2.0%
(depending on the then-applicable leverage ratio). At December 31, 2014, the interest rate that was being charged on the
outstanding principal amount was 1.2%. An applicable commitment fee of 0.15% to 0.25% (depending on the then-applicable
leverage ratio) applies on the unused portion of the credit facility.
When we entered into the credit agreement, we used a portion of the proceeds from the initial funding of the credit facility to
repay the outstanding balance under our previous revolving credit facility with Union Bank, N.A and other lenders. On that
repayment, the previous credit agreement, dated as of February 10, 2011, between us and lenders (including Union Bank, N.A.,
as administrative agent, swing line lender and letter of credit issuer, HSBC Bank USA, National Association, as syndication
agent and Union Bank, N.A., HSBC Bank USA, National Association, Commonwealth Bank of Australia and Wells Fargo
Bank), was terminated and the commitments under the previous credit agreement were also terminated.
Our obligations under the current credit agreement are unsecured but are guaranteed by two of our U.S. subsidiaries. The credit
agreement contains customary covenants, including certain financial covenants and an obligation that we maintain certain
financial ratios, including a maximum leverage ratio of funded debt to EBITDA (as defined in the credit agreement) and an
interest coverage ratio. The entire principal amount of the credit facility and any accrued but unpaid interest may be declared
immediately due and payable if an event of default occurs, as defined in the credit agreement. Events of default under the credit
agreement include failure to make payments when due, the occurrence of a default in the performance of any covenants in the
credit agreement or related documents, or certain changes of control of ResMed Inc., ResMed Corp., ResMed Motor
Technologies Inc., ResMed Limited, ResMed Holdings Ltd/LLC or ResMed EAP Holdings LLC.
At December 31, 2014, there was $449.0 million outstanding under the credit agreement.
(8) Product Warranties
Changes in the liability for warranty costs, which is included in accrued expenses in our condensed consolidated balance sheets,
for the six months ended December 31, 2014 and 2013 are as follows (in thousands):
Six Months Ended December 31,
2014
Balance at the beginning of the period
Warranty accruals for the period
Warranty costs incurred for the period
Foreign currency translation adjustments
Balance at the end of the period
$
$
10
11,798
3,503
(2,857)
(1,367)
11,077
2013
$
$
16,011
4,425
(4,500)
(252)
15,684
PART I – FINANCIAL INFORMATION
Item 1
RESMED INC. AND SUBSIDIARIES
Notes to the Condensed Consolidated Financial Statements
(Unaudited)
(9) Stock-Based Employee Compensation
For personal use only
We measure the compensation expense of all stock-based awards at fair value on the grant date. We estimate the fair value of
stock options and purchase rights granted under the employee stock purchase plan (the “ESPP”) using the Black-Scholes
valuation model. The fair value of restricted stock units is equal to the market value of the underlying shares as determined at the
grant date less the fair value of dividends that holders are not entitled to, during the vesting period. The fair value of
performance restricted stock units which contain a market condition, are estimated using a Monte-Carlo simulation model. We
recognize the fair value as compensation expense using the straight-line method over the service period for awards expected to
vest.
We estimate the fair value of stock options granted under our stock option plans and purchase rights granted under the ESPP
using the following assumptions:
Three Months Ended December 31,
2014
Stock options:
Weighted average grant date fair value
Weighted average risk-free interest rate
Expected option life in years
Dividend yield
Expected volatility
ESPP purchase rights:
Weighted average risk-free interest rate
Expected option life in years
Dividend yield
Expected volatility
$
10.58 $
1.60%
4.9
2.15%
27%
2013
10.90 $
1.44%
4.9
2.06%
30%
Six Months Ended December 31,
2014
2013
10.58 $
1.60%
4.9
2.15%
27%
0.07%
0.08%
0.07%
6 months
6 months
6 months
2.17% 1.44% - 1.96% 2.00% - 2.17%
22%
24% - 28%
22% - 24%
10.90
1.44%
4.9
2.06%
30%
0.08%
6 months
1.44% - 1.96%
24% - 28%
(10) Stockholders’ Equity
Common Stock. During the three months ended December 31, 2014 and 2013 we repurchased 0.7 million and 1.5 million
shares at a cost of $33.5 million and $74.0 million, respectively. Since the inception of our share repurchase programs and
through December 31, 2014, we have repurchased a total of 37.9 million shares at a cost of $1.4 billion. Shares that are
repurchased are classified as treasury stock pending future use and reduce the number of shares outstanding used in calculating
earnings per share. At December 31, 2014, 16.8 million additional shares can be repurchased under the approved share
repurchase program.
Preferred Stock. In April 1997, the board of directors designated 2,000,000 shares of our $0.01 par value preferred stock as
Series A Junior Participating Preferred Stock. No shares were issued or outstanding at December 31, 2014 and June 30, 2014.
Stock Options and Restricted Stock Units. We have granted stock options and restricted stock units to personnel, including
officers and directors, in accordance with ResMed Inc. 2009 Incentive Award Plan (the “2009 Plan”). These options and
restricted stock units have expiration dates of seven years from the date of grant and vest over one to four years. We have
granted the options with an exercise price equal to the market value as determined at the date of grant.
The maximum number of shares of our common stock authorized for issuance under the 2009 Plan is 43.7 million shares. The
number of securities remaining available for future issuance under the 2009 Plan at December 31, 2014 is 14.1 million. The
number of shares of our common stock available for issuance under the 2009 Plan will be reduced by (i) 2.8 shares for each one
share of common stock delivered in settlement of any “full-value award,” which is any award other than a stock option, stock
appreciation right or other award for which the holder pays the intrinsic value and (ii) one share for each share of common stock
delivered in settlement of all other awards. The maximum number of shares, that may be subject to awards granted under the
2009 Plan to any individual during any calendar year, may not exceed 3 million shares of our common stock (except in a
participant’s initial year of hiring, when up to 4.5 million shares of our common stock may be granted).
At December 31, 2014, there were $93.3 million in unrecognized compensation costs related to unvested stock-based
compensation arrangements. This is expected to be recognized over a weighted average period of 2.5 years. The aggregate
intrinsic value of the stock-based compensation arrangements outstanding and exercisable at December 31, 2014 was $249.5
million and $106.5 million, respectively. The aggregate intrinsic value of the options exercised during the six months ended
December 31, 2014 and 2013, was $28.5 million and $50.5 million, respectively.
11
PART I – FINANCIAL INFORMATION
Item 1
For personal use only
RESMED INC. AND SUBSIDIARIES
Notes to the Condensed Consolidated Financial Statements
(Unaudited)
The following table summarizes option activity during the six months ended December 31, 2014:
Weighted Average Weighted Average Remaining
Exercise Price
Contractual Term in Years
Outstanding at beginning of period
Granted
Exercised
Forfeited
Outstanding at end of period
Exercise price range of granted options
Options exercisable at end of period
4,687,220
97,209
(837,924)
(13,823)
3,932,682
52.02
3,282,269
$
$
24.45
52.02
17.81
34.00
26.51
$
23.61
2.6
2.5
The following table summarizes the activity of restricted stock units during the six months ended December 31, 2014:
Weighted Average Grant- Weighted Average Remaining
Date Fair Value
Contractual Term in Years
Outstanding at beginning of period
Granted
Vested
Forfeited
Outstanding at end of period
2,448,331
816,136
(851,619)
(34,936)
2,377,912
$
$
38.58
50.15
36.06
36.91
43.48
1.3
1.7
Employee Stock Purchase Plan (the “ESPP”). Under the ESPP, we offer participants the right to purchase shares of our
common stock at a discount during successive offering periods. Each offering period under the ESPP will be for a period of time
determined by the board of directors’ compensation committee of no less than 3 months and no more than 27 months. The
purchase price for our common stock under the ESPP will be the lower of 85% of the fair market value of our common stock on
the date of grant or 85% of the fair market value of our common stock on the date of purchase. An individual participant cannot
subscribe for more than $25,000 in common stock during any calendar year. At December 31, 2014, the number of shares
remaining available for future issuance under the ESPP is 1.6 million shares.
12
PART I – FINANCIAL INFORMATION
Item 1
RESMED INC. AND SUBSIDIARIES
Notes to the Condensed Consolidated Financial Statements
(Unaudited)
(11) Fair Value Measurements
For personal use only
In determining the fair value measurements of our financial assets and liabilities, we consider the principal and most
advantageous market in which we transact and consider assumptions that market participants would use when pricing the
financial asset or liability. We maximize the use of observable inputs and minimize the use of unobservable inputs when
measuring fair value.
The hierarchies of inputs are as follows:
•
Level 1: Input prices quoted in an active market for identical financial assets or liabilities;
•
Level 2: Inputs other than prices quoted in Level 1, such as prices quoted for similar financial assets and liabilities in
active markets, prices for identical assets and liabilities in markets that are not active or other inputs that are
observable or can be corroborated by observable market data; and
•
Level 3: Input prices quoted that are significant to the fair value of the financial assets or liabilities which are not
observable nor supported by an active market.
The following table summarizes our financial assets and liabilities, as at December 31, 2014 and June 30, 2014, using the
valuation input hierarchy (in thousands):
Level 1
Balances at December 31, 2014
Foreign currency hedging instruments, net
Business acquisition contingent consideration
Balances at June 30, 2014
Foreign currency hedging instruments, net
Business acquisition contingent consideration
Level 2
Level 3
Total
$
$
-
$ 1,135
$
-
$
$(1,129)
$ 1,135
$(1,129)
$
$
-
$(2,270)
$
-
$
$ (480)
$(2,270)
$ (480)
We determine the fair value of our financial assets and liabilities as follows:
Foreign currency hedging instruments – These financial instruments are valued using third-party valuation models based on
market observable inputs, including interest rate curves, on-market spot currency prices, volatilities and credit risk.
Contingent consideration – These liabilities include the fair value estimates of additional future payments that may be required
for some of our previous business acquisitions based on the achievement of certain performance milestones. Each potential
future payment is valued using the estimated probability of achieving each milestone, which is then discounted to present value.
The following is a reconciliation of changes in the fair value of contingent consideration for the six months ended December 31,
2014 and 2013 (in thousands):
Six Months Ended December 31,
2014
Balance at the beginning of the period
Acquisition date fair value of contingent consideration
Changes in fair value included in operating income
Payments
Foreign currency translation adjustments
Balance at the end of the period
$
$
(480)
(1,217)
132
458
(22)
(1,129)
2013
$
$
(7,779)
3,438
442
(144)
(4,043)
We did not have any significant non-financial assets or liabilities measured at fair value on December 31, 2014 or June 30, 2014.
13
PART I – FINANCIAL INFORMATION
Item 1
RESMED INC. AND SUBSIDIARIES
Notes to the Condensed Consolidated Financial Statements
(Unaudited)
(12) Legal Actions and Contingencies
Litigation
For personal use only
In the normal course of business, we are subject to routine litigation incidental to our business. While the results of this litigation
cannot be predicted with certainty, we believe that their final outcome will not, individually or in aggregate, have a material
adverse effect on our consolidated financial statements taken as a whole.
Obligations Under Recourse Provisions
We use independent leasing companies to provide financing to certain customers for the purchase of our products. In some
cases, we are liable in the event of a customer default, to the leasing companies, within certain limits, for unpaid installment
receivables transferred to the leasing companies. The gross amount of receivables sold with recourse during the six months
ended December 31, 2014 and 2013, amounted to $12.8 million and $2.0 million, respectively. We have recognized a receivable
and a liability under these arrangements at December 31, 2014 of $8.6 million. We have recognized a provision in relation to
these receivables at December 31, 2014 and June 30, 2014, of $0.5 million and $0.5 million, respectively.
(13) Derivative Instruments and Hedging Activities
We transact business in various foreign currencies, including a number of major European currencies as well as the Australian
and Singapore dollars. We have significant foreign currency exposure through both our Australian and Singaporean
manufacturing activities, and international sales operations. We have established a foreign currency hedging program using
purchased currency options and forward contracts to hedge foreign-currency-denominated financial assets, liabilities and
manufacturing cash flows. The terms of such foreign currency hedging contracts generally do not exceed three years. The goal
of this hedging program is to economically manage the financial impact of foreign currency exposures denominated mainly in
Euros, Australian and Singapore dollars. Under this program, increases or decreases in our foreign currency denominated
financial assets, liabilities, and firm commitments are partially offset by gains and losses on the hedging instruments.
We do not designate these foreign currency contracts as hedges. We have determined our hedge program to be a non-effective
hedge as defined under the FASB issued authoritative guidance. All movements in the fair value of the foreign currency
instruments are recorded within other income, net in our condensed consolidated statements of income. We do not enter into
financial instruments for trading or speculative purposes.
We held foreign currency instruments with notional amounts totaling $435.2 million and $473.7 million at December 31, 2014
and June 30, 2014, respectively, to hedge foreign currency fluctuations. These contracts mature at various dates prior to
December 31, 2017.
The following table summarizes the amount and location of our derivative financial instruments as of December 31, 2014 and
June 30, 2014 (in thousands):
Foreign currency hedging instruments
Foreign currency hedging instruments
Foreign currency hedging instruments
December 31, 2014
June 30, 2014
$
$
3,423
1,139
(3,427)
1,135
$
$
456
489
(3,215)
(2,270)
Balance Sheet Caption
Other assets - current
Other assets - non current
Accrued expenses
The following table summarizes the amount and location of gains (losses) associated with our derivative financial instruments
for the six months ended December 31, 2014 and December 31, 2013, respectively (in thousands):
Gain /(Loss) Recognized
Income Statement Caption
Six Months Ended December 31,
Foreign currency hedging instruments
Other foreign-currency-denominated transactions
2014
2013
$ (25,295)
27,446
$
2,151
$ (14,459)
10,621
$ (3,838)
Other, net
Other, net
We are exposed to credit-related losses in the event of non-performance by counter parties to financial instruments. We
minimize counterparty credit risk by entering into derivative transactions with major financial institutions and we do not expect
material losses as a result of default by our counterparties.
14
PART I – FINANCIAL INFORMATION
Item 1
RESMED INC. AND SUBSIDIARIES
Notes to the Condensed Consolidated Financial Statements
(Unaudited)
(14) Business Combinations
For personal use only
During the six months ended December 31, 2014 we acquired four distributors of equipment and services for the treatment of
sleep-disordered breathing and respiratory disorders, based in Australia and New Zealand, including ResSleep International Pty
Ltd, which was a related party. These acquisitions have been accounted for as business combinations using purchase accounting
and are included in our consolidated financial statements from their respective acquisition dates. The acquisitions are not
considered a material business combination and accordingly pro forma information is not provided. The acquisitions were
funded through cash on-hand and we have not incurred any material acquisition related costs.
We have completed the preliminary purchase price allocation for the above acquisitions during the period. The cost of the
acquisitions has been allocated to the assets acquired and liabilities assumed based on estimates of their fair values at the date of
acquisition. As part of the preliminary purchase price allocation, we recognized an intangible asset relating to customer
relationships of $12.0 million, with an estimated useful life of 5 years, and goodwill of $12.3 million. The goodwill recognized
as part of these acquisitions, which is not deductible for tax purposes, mainly represents the synergies that are unique to our
combined businesses and the potential for new products and services to be developed in the future.
15
PART I – FINANCIAL INFORMATION
Item 2
RESMED INC. AND SUBSIDIARIES
Management’s Discussion and Analysis of Financial Condition and Results of Operations
Special Note Regarding Forward-Looking Statements
For personal use only
This report contains certain forward-looking statements and information that are based on the beliefs of our management as well as
estimates and assumptions made by, and information currently available to, our management. All statements other than statements
regarding historical facts are forward-looking statements. The words “believe,” “expect,” “anticipate,” “will continue,” “will,”
“estimate,” “plan,” “future” and other similar expressions, and negative statements of such expressions, generally identify forwardlooking statements, including, in particular, statements regarding the development and approval of new products and product
applications, market expansion, pending litigation and the development of new markets for our products, such as cardiovascular and
stroke markets. These forward-looking statements are made in accordance with the safe harbor provisions of the Private Securities
Litigation Reform Act of 1995. You are cautioned not to place undue reliance on these forward-looking statements. Forward-looking
statements reflect the views of our management at the time the statements are made and are subject to a number of risks, uncertainties,
estimates and assumptions, including, without limitation, and in addition to those identified in the text surrounding such statements,
those identified in our annual report on Form 10-K for the fiscal year ended June 30, 2014 and elsewhere in this report.
In addition, important factors to consider in evaluating such forward-looking statements include changes or developments in
healthcare reform, social, economic, market, legal or regulatory circumstances, changes in our business or growth strategy or an
inability to execute our strategy due to changes in our industry or the economy generally, the emergence of new or growing
competitors, the actions or omissions of third parties, including suppliers, customers, competitors and governmental authorities and
various other factors. If any one or more of these risks or uncertainties materialize, or underlying estimates or assumptions prove
incorrect, actual results may vary significantly from those expressed in our forward-looking statements, and there can be no assurance
that the forward-looking statements contained in this report will in fact occur.
Before deciding to purchase, hold or sell our common stock, you should carefully consider the risks described in our annual report on
Form 10-K, in addition to the other cautionary statements and risks described elsewhere in this report and in our other filings with the
SEC, including our subsequent reports on Forms 10-Q and 8-K. These risks and uncertainties are not the only ones we face.
Additional risks and uncertainties not presently known to us or that we currently deem immaterial may also affect our business. If any
of these known or unknown risks or uncertainties actually occurs with material adverse effects on us, our business, financial condition
and results of operations could be seriously harmed. In that event, the market price for our common stock will likely decline and you
may lose all or part of your investment.
16
PART I – FINANCIAL INFORMATION
Item 2
RESMED INC. AND SUBSIDIARIES
Management’s Discussion and Analysis of Financial Condition and Results of Operations
Overview
For personal use only
The following is an overview of our results of operations for the three and six months ended December 31, 2014. Management’s
discussion and analysis of financial condition and results of operations is intended to help the reader understand the results of
operations and financial condition of ResMed Inc. Management’s discussion and analysis is provided as a supplement to, and should
be read in conjunction with, the selected financial data and condensed consolidated financial statements and notes, included in this
report.
We are a leading developer, manufacturer and distributor of medical equipment for treating, diagnosing, and managing sleepdisordered breathing (“SDB”) and other respiratory disorders. During the three and six months ended December 31, 2014, we
continued our efforts to build awareness of the consequences of untreated SDB, and to grow our business in this market. In our
efforts, we have attempted to raise awareness through market and clinical initiatives highlighting the relationship between
SDB/obstructive sleep apnea and co-morbidities, such as cardiac disease, diabetes, hypertension and obesity, as well as the dangers of
sleep apnea in regard to occupational health and safety, especially in the transport industry.
We are committed to ongoing investment in research and development and product enhancements. During the three and six months
ended December 31, 2014, we invested $29.3 million and $59.3 million, respectively, on research and development activities. Since
the development of continuous positive airway pressure (“CPAP”) therapy, we have developed a number of innovative products for
SDB and other respiratory disorders including airflow generators, diagnostic products, mask systems, headgear and other accessories.
Our new product release schedule remains active across both our mask and flow generator categories. We are taking steps to increase
awareness of the health dangers of SDB by sponsoring educational programs targeted at the primary care physician community. We
believe these efforts should further increase awareness of both doctors and patients about the relationship between SDB, obstructive
sleep apnea and co-morbidities such as cardiac disease, diabetes, hypertension and obesity. We also believe these efforts should help
inform the community of the dangers of sleep apnea in occupational health and safety, especially in the transport industry.
During the three months ended December 31, 2014, we continued our roll out of the ResMed Air Solutions Platform with the launch
of our AirCurve™ 10 series of bilevel products. We also continued the global roll-out of our new life support ventilation system, the
Astral platform.
During the three months ended December 31, 2014, our net revenue increased by 10% when compared to the three months ended
December 31, 2013. Gross margin was 62.2% for the three months ended December 31, 2014 compared to 64.7% for the three
months ended December 31, 2013. Diluted earnings per share for the three months ended December 31, 2014 increased to $0.64 per
share, up from $0.60 per share in the three months ended December 31, 2013.
At December 31, 2014, our cash and cash equivalents totaled $880.7 million, our total assets were $2.3 billion and our stockholders’
equity was $1.6 billion.
In order to provide a framework for assessing how our underlying businesses performed excluding the effect of foreign currency
fluctuations, we provide certain financial information on a “constant currency basis”, which is in addition to the actual financial
information presented. In order to calculate our constant currency information, we translate the current period financial information
using the foreign currency exchange rates that were in effect during the previous comparable period. However, constant currency
measures should not be considered in isolation or as an alternative to U.S. dollar measures that reflect current period exchange rates,
or to other financial measures calculated and presented in accordance with U.S. GAAP.
17
PART I – FINANCIAL INFORMATION
Item 2
RESMED INC. AND SUBSIDIARIES
Management’s Discussion and Analysis of Financial Condition and Results of Operations
Net Revenue
For personal use only
Net revenue increased for the three months ended December 31, 2014 to $423.0 million compared to $384.3 million for the three months ended
December 31, 2013, an increase of $38.6 million or 10% (a 14% increase on a constant currency basis). The increase in net revenue is primarily
attributable to an increase in unit sales of our flow generators, masks and accessories, partially offset by a decline in average selling prices.
Movements in international currencies against the U.S. dollar unfavorably impacted revenues by approximately $13.8 million for the three months
ended December 31, 2014.
Net revenue in North and Latin America for the three months ended December 31, 2014 was $231.0 million, compared to $206.6 million for the
three months ended December 31, 2013, an increase of $24.4 million, or 12%. The increase in net revenue is primarily attributable to an increase in
unit sales of our flow generators, masks and accessories, offset by a decline in average selling prices. Net revenue in markets outside North and
Latin America, for the three months ended December 31, 2014, increased to $192.0 million compared to $177.7 million for the three months ended
December 31, 2013, an increase of 8% (a 16% increase in constant currency terms).
Net revenue from the sales of flow generators, including humidifiers, for the three months ended December 31, 2014 totaled $240.0 million, an
increase of 16% compared to the three months ended December 31, 2013 of $207.0 million, including an increase of 25% in North and Latin
America and an increase of 9% elsewhere. Net revenue from the sales of masks and other accessories for the three months ended December 31,
2014 totaled $183.0 million, compared to the three months ended December 31, 2013 of $177.3 million, reflecting an increase of 2% in North and
Latin America and an increase of 6% elsewhere.
The following table summarizes the percentage movements in our net revenue for the three months ended December 31, 2014 compared to the
three months ended December 31, 2013:
North and
Latin America
Flow generators
Masks and other accessories
Total
*
International
25%
2%
12%
9%
6%
8%
Total
16%
3%
10%
International
(Constant
Currency) *
17%
14%
16%
Total
(Constant
Currency)*
20%
6%
14%
Constant currency numbers exclude the impact of movements in international currencies.
Net revenue for the six months ended December 31, 2014, was $803.4 million, compared to $742.0 million for the six months ended December 31,
2013, an increase of 8%. For the six months ended December 31, 2014, revenue from sales of flow generators increased by 14% compared to the
six months ended December 31, 2013, comprised of an increase of 16% in North and Latin America and a 12% increase elsewhere. For the six
months ended December 31, 2014, revenue from sales of mask systems and other accessories increased by 2% compared to the six months ended
December 31, 2013, comprised of a 0% increase in North and Latin America and a 4% increase elsewhere. Movement in international currencies
against the U.S. dollar unfavorably impacted net revenue by approximately $13.4 million during the six months ended December 31, 2014.
Excluding the impact of unfavorable currency movements, total revenue for the six months ended December 31, 2014 increased by 10% compared
to the six months ended December 31, 2013.
The following table summarizes the percentage movements in our net revenue for the six months ended December 31, 2014 compared to the six
months ended December 31, 2013:
North and
Latin America
Flow generators
Masks and other accessories
Total
*
16%
0%
7%
International
12%
4%
9%
Total
14%
2%
8%
International
(Constant
Currency) *
16%
8%
13%
Total
(Constant
Currency)*
16%
3%
10%
Constant currency numbers exclude the impact of movements in international currencies.
Gross Profit
Gross profit increased for the three months ended December 31, 2014 to $263.2 million from $248.8 million for the three months ended
December 31, 2013, an increase of $14.5 million or 6%. Gross profit as a percentage of net revenue for the three months ended December 31, 2014
decreased to 62.2% from 64.7% for the three months ended December 31, 2013.
The decline in gross margins was primarily due to declines in our average selling prices, and unfavorable product mix as sales of our lower margin
products represented a higher proportion of our sales, partially offset by manufacturing and supply chain improvements.
18
PART I – FINANCIAL INFORMATION
Item 2
RESMED INC. AND SUBSIDIARIES
Management’s Discussion and Analysis of Financial Condition and Results of Operations
Selling, General and Administrative Expenses
For personal use only
Selling, general and administrative expenses increased for the three months ended December 31, 2014 to $122.5 million from $111.7
million for the three months ended December 31, 2013, an increase of $10.8 million or 10%. The selling, general and administrative
expenses were favorably impacted by the movement of international currencies against the U.S. dollar, which decreased our expenses
by approximately $5.7 million, as reported in U.S. dollars. Excluding the impact of foreign currency movements, selling, general and
administrative expenses for the three months ended December 31, 2014 increased by 15% compared to the three months ended
December 31, 2013. Selling, general and administrative expenses, as a percentage of net revenue, were 29.0% for the three months
ended December 31, 2014, compared to 29.1% for the three months ended December 31, 2013.
Selling, general and administrative expenses increased for the six months ended December 31, 2014 to $233.0 million from $213.1
million for the six months ended December 31, 2013, an increase of $20.0 million or 9%. The selling, general and administrative
expenses were favorably impacted by the movement of international currencies against the U.S. dollar, which decreased our expenses
by approximately $5.5 million, as reported in U.S. dollars. Excluding the impact of foreign currency movements, selling, general and
administrative expenses for the six months ended December 31, 2014 increased by 12% compared to the six months ended
December 31, 2013. Selling, general and administrative expenses, as a percentage of net revenue, were 29.0% for the six months
ended December 31, 2014, compared to 28.7% for the six months ended December 31, 2013.
The increase in selling, general and administrative expenses was primarily due to additional personnel to support our commercial
activities, higher marketing expenditure associated with our recent product releases, an increase in our variable employee
compensation costs, the impact of recent acquisitions and the release of contingent consideration in the prior year.
Research and Development Expenses
Research and development expenses decreased for the three months ended December 31, 2014 to $29.3 million from $29.5 million
for the three months ended December 31, 2013, a decrease of $0.2 million, or 1%. The research and development expenses were
favorably impacted by the movement of international currencies against the U.S. dollar, which decreased our expenses by
approximately $2.4 million for the three months ended December 31, 2014, as reported in U.S. dollars. Excluding the impact of
foreign currency movements, our research and development expenses increased by 7% compared to the three months ended
December 31, 2013. Research and development expenses, as a percentage of net revenue, were 6.9% for the three months ended
December 31, 2014, compared to 7.7% for the three months ended December 31, 2013.
Research and development expenses increased for the six months ended December 31, 2014 to $59.3 million from $56.9 million for
the six months ended December 31, 2013, an increase of $2.4 million or 4%. The research and development expenses were favorably
impacted by the movement of international currencies against the U.S. dollar, which decreased our expenses by approximately $2.2
million for the six months ended December 31, 2014, as reported in U.S. dollars. Excluding the impact of foreign currency
movements, our research and development expenses increased by 8% compared to the six months ended December 31, 2013.
Research and development expenses, as a percentage of net revenue, were 7.4% for the six months ended December 31, 2014,
compared to 7.7% for the six months ended December 31, 2013.
The increase in research and development expenses was primarily due to an increase in expenses associated with healthcare
informatics product development activities and clinical trials in the area of heart failure.
Amortization of Acquired Intangible Assets
Amortization of acquired intangible assets for the three and six months ended December 31, 2014 totaled $2.3 million and $4.4
million, respectively, compared to $2.5 million and $4.9 million for the three and six months ended December 31, 2013.
Total Other Income, Net
Total other income, net for the three and six months ended December 31, 2014 was $6.4 million and $13.6 million, respectively,
compared to $4.4 million and $9.6 million, for the three and six months ended December 31, 2013. The increase in total other income,
net, during the three and six months ended December 31, 2014, was due primarily to gains on foreign currency transactions and the
gain on sale of a distribution business, partially offset by lower interest income resulting from lower interest rates on cash balances
held and the depreciation of the Australian dollar against the U.S. dollar.
19
PART I – FINANCIAL INFORMATION
Item 2
RESMED INC. AND SUBSIDIARIES
Management’s Discussion and Analysis of Financial Condition and Results of Operations
Income Taxes
For personal use only
Our effective income tax rate for the three months ended December 31, 2014 was approximately 21.1% as compared to
approximately 20.9% for the three months ended December 31, 2013. Our effective income tax rate for the six months ended
December 31, 2014 was approximately 19.8% as compared to approximately 20.8% for the six months ended December 31, 2013.
During the six months ended December 31, 2014, there was a final resolution of a German tax audit relating to the 1997 and 1998
fiscal years. As a result, we recorded a net tax benefit of $3.2 million. Excluding the impact of this one-time tax benefit, our effective
tax rate for the six months ended December 31, 2014 would have been 21.3%. Our effective income tax rate is affected by the
geographic mix of our taxable income, including the lower taxes associated with our Singapore and Malaysia manufacturing
operations. Our Singapore and Malaysia operations operate under certain tax holidays and tax incentive programs that will expire in
whole or in part at various dates through June 30, 2020. As of December 31, 2014, we have not provided for U.S. income taxes for
the undistributed earnings of our foreign subsidiaries. We intend these earnings to be permanently reinvested outside the United
States.
Net Income and Earnings per Share
As a result of the factors above, our net income for the three months ended December 31, 2014 was $91.2 million compared to net
income of $86.6 million for the three months ended December 31, 2013, an increase of 5% over the three months ended
December 31, 2013. Our net income for the six months ended December 31, 2014 was $174.4 million compared to net income of
$167.6 million for the six months ended December 31, 2013, an increase of 4% over the six months ended December 31, 2013.
As a result of the increase in our net income and lower share count due to our stock repurchases, our diluted earnings per share for the
three and six months ended December 31, 2014 were $0.64 and $1.22 per diluted share, respectively, compared to $0.60 and $1.15 for
the three and six months ended December 31, 2013, an increase of 7% and 6%, respectively.
Liquidity and Capital Resources
As of December 31, 2014 and June 30, 2014, we had cash and cash equivalents of $880.7 million and $905.7 million, respectively.
Working capital was $1.3 billion and $1.3 billion at December 31, 2014 and June 30, 2014, respectively.
As of December 31, 2014 and June 30, 2014, our cash and cash equivalent balances held within the United States amounted to $50.6
million and $29.0 million, respectively. Our remaining cash and cash equivalent balances at December 31, 2014 and June 30, 2014, of
$830.1 million and $876.7 million, respectively, were held by our non-U.S. subsidiaries and would be subject to tax if repatriated. If
these funds were needed for our operations in the United States, we would be required to accrue and pay United States taxes to
repatriate these funds. However, we intend to permanently reinvest these funds outside of the United States and our current plans do
not demonstrate a need to repatriate them to fund our United States operations. Our cash and cash equivalent balances are held at
highly rated financial institutions.
Inventories at December 31, 2014 were $218.1 million, an increase of $40.0 million or 22% from the December 31, 2013 balance of
$178.1 million. The increase in inventories was mainly associated with our new product introductions.
Accounts receivable at December 31, 2014 were $340.4 million, an increase of $38.8 million or 13% over the December 31, 2013
accounts receivable balance of $301.6 million. Accounts receivable days outstanding of 73 days at December 31, 2014 was 3 days
higher than the 70 days at December 31, 2013. The increase in our accounts receivable balance and days sales is reflecting the impact
of longer payment terms given to our customers in our domestic market. Our allowance for doubtful accounts as a percentage of total
accounts receivable at December 31, 2014 was 3.5%, compared to 3.0% at June 30, 2014.
During the six months ended December 31, 2014, we generated cash of $192.5 million from operations compared to $174.6 million
for the six months ended December 31, 2013. Movements in foreign currency exchange rates during the six months ended
December 31, 2014 had the effect of decreasing our cash and cash equivalents by $123.8 million, as reported in U.S. dollars. During
the six months ended December 31, 2014 and 2013, we repurchased 1.5 million and 2.0 million shares at a cost of $76.4 million and
$95.1 million, respectively. During the six months ended December 31, 2014 and 2013, we also paid dividends totaling $78.5 million
and $71.1 million, respectively.
20
PART I – FINANCIAL INFORMATION
Item 2
RESMED INC. AND SUBSIDIARIES
Management’s Discussion and Analysis of Financial Condition and Results of Operations
For personal use only
Capital expenditures for the six months ended December 31, 2014 and 2013 amounted to $39.7 million and $36.4 million,
respectively. The capital expenditures for the six months ended December 31, 2014 primarily reflected investment in production
tooling, equipment and machinery, computer hardware and software, and rental and loan equipment. At December 31, 2014, our
balance sheet reflects net property, plant and equipment of $408.2 million compared to $434.3 million at June 30, 2014. At
December 31, 2014, no capital lease obligations exist. Details of contractual obligations at December 31, 2014 are as follows:
In $000’s
Long Term Debt
Interest on Long Term Debt
Operating Leases
Purchase Obligations
Total
Total
$449,663
17,281
61,931
119,289
$648,164
2015
$
5,572
17,898
119,124
$142,594
2016
$
5,572
13,372
165
$19,109
Payments Due by December 31
2017
2018
$
5,572
8,253
$13,825
$449,000
493
5,558
$455,051
2019
Thereafter
$
32
3,356
$3,388
$
663
40
13,494
$14,197
Details of other commercial commitments as at December 31, 2014 are as follows:
In $000’s
Guarantees*
Total
*
Total
2015
$ 12,402
$ 12,402
$ 1,820
$ 1,820
Amount of Commitment Expiration Per Period
2016
2017
2018
2019
$ 1,613
$ 1,613
$
$
-
$
$
2
2
$
$
Thereafter
-
$ 8,967
$ 8,967
The above guarantees mainly relate to requirements under contractual obligations with insurance companies transacting with our
German subsidiaries and guarantees provided under our facility leasing obligations.
Credit Facility
On October 31, 2013, we entered into a credit agreement, as borrower, with lenders, including Union Bank, N.A., as administrative
agent, joint lead arranger, swing line lender and letters of credit issuer, and HSBC Bank USA, National Association, as syndication
agent and joint lead arranger. Our obligations under the credit agreement are guaranteed by ResMed Corp. and ResMed Motor
Technologies Inc., two of our U.S. subsidiaries.
The credit agreement provides a $700 million senior unsecured five-year revolving credit facility, with an uncommitted option to
increase the credit facility by an additional $300 million. The credit facility also includes a $25 million sublimit for letters of credit.
The credit facility terminates on October 31, 2018, when all unpaid principal and interest under the loans must be repaid. The
outstanding principal amount due under the credit facility will bear interest at a rate equal to LIBOR plus 1.0% to 2.0% (depending on
the then-applicable leverage ratio). At December 31, 2014, the interest rate that was being charged on the outstanding principal
amount was 1.2%. An applicable commitment fee of 0.15% to 0.25% (depending on the then-applicable leverage ratio) applies on the
unused portion of the credit facility.
When we entered into the credit agreement, we used a portion of the proceeds from the initial funding of the credit facility to repay
the outstanding balance under our previous revolving credit facility with Union Bank, N.A and other lenders. On that repayment, the
previous credit agreement, dated as of February 10, 2011, between us and lenders (including Union Bank, N.A., as administrative
agent, swing line lender and L/C Issuer, HSBC Bank USA, National Association, as syndication agent and Union Bank, N.A., HSBC
Bank USA, National Association, Commonwealth Bank of Australia and Wells Fargo Bank), was terminated and the commitments
under that previous credit agreement were also terminated.
Our obligations under the current credit agreement are unsecured but are guaranteed by two of our U.S. subsidiaries. The credit
agreement contains customary covenants, including certain financial covenants and an obligation that we maintain certain financial
ratios, including a maximum leverage ratio of funded debt to EBITDA (as defined in the credit agreement) and an interest coverage
ratio. The entire principal amount of the credit facility and any accrued but unpaid interest may be declared immediately due and
payable if an event of default occurs, as defined in the credit agreement. Events of default under the credit agreement include failure
to make payments when due, the occurrence of a default in the performance of any covenants in the credit agreement or related
documents, or certain changes of control of ResMed Inc., ResMed Corp., ResMed Motor Technologies Inc., ResMed Limited,
ResMed Holdings Ltd/LLC or ResMed EAP Holdings LLC.
At December 31, 2014, we were in compliance with our debt covenants and there was $449.0 million outstanding under the credit
agreement.
We expect to satisfy all of our liquidity requirements through a combination of cash on hand, cash generated from operations and debt
facilities.
Common Stock
For personal use only
During the six months ended December 31, 2014, we repurchased 1.5 million shares at a cost of $76.4 million. At December 31,
2014, we have repurchased a total of 37.9 million shares at a cost of $1.4 billion. Shares that are repurchased are classified as treasury
stock pending future use and reduce the number of shares outstanding used in calculating earnings per share. At December 31, 2014,
16.8 million additional shares can be repurchased under the current share repurchase program.
21
PART I – FINANCIAL INFORMATION
Item 2
RESMED INC. AND SUBSIDIARIES
Management’s Discussion and Analysis of Financial Condition and Results of Operations
Critical Accounting Principles and Estimates
For personal use only
The preparation of financial statements in conformity with U.S. GAAP requires us to make estimates and judgments that affect our
reported amounts of assets and liabilities, revenues and expenses and related disclosures of contingent assets and liabilities. On an
ongoing basis we evaluate our estimates, including those related to allowance for doubtful accounts, inventory reserves, warranty
obligations, goodwill, potentially impaired assets, intangible assets, income taxes and contingencies.
We state these accounting policies in the notes to the financial statements and at relevant sections in this discussion and analysis. The
estimates are based on the information that is currently available to us and on various other assumptions that we believe to be
reasonable under the circumstances. Actual results could vary from those estimates under different assumptions or conditions.
For a full discussion of our critical accounting policies, see our Annual Report on Form 10-K for the year ended June 30, 2014.
Recently Issued Accounting Pronouncements
See note 1 to the condensed consolidated financial statements for a description of recently issued accounting pronouncements,
including the expected dates of adoption and estimated effects on our results of operations, financial positions and cash flows.
Off-Balance Sheet Arrangements
As of December 31, 2014, we are not involved in any significant off-balance sheet arrangements, as defined in Item 303(a)(4)(ii) of
Regulation S-K promulgated by the SEC.
22
Item 3
PART I – FINANCIAL INFORMATION
RESMED INC. AND SUBSIDIARIES
Quantitative and Qualitative Disclosures About Market Risk
Foreign Currency Market Risk
For personal use only
Our reporting currency is the U.S. dollar, although the financial statements of our non-U.S. subsidiaries are maintained in their
respective local currencies. We transact business in various foreign currencies, including a number of major European currencies as well
as the Australian and Singapore dollar. We have significant foreign currency exposure through our Australian and Singapore
manufacturing activities and our international sales operations. We have established a foreign currency hedging program using
purchased currency options and forward contracts to hedge foreign-currency-denominated financial assets, liabilities and manufacturing
cash flows. The goal of this hedging program is to economically manage the financial impact of foreign currency exposures
predominantly denominated in euros, Australian dollars and Singapore dollars. Under this program, increases or decreases in our
foreign-currency-denominated financial assets, liabilities, and firm commitments are partially offset by gains and losses on the hedging
instruments. We do not enter into financial instruments for trading or speculative purposes. The foreign currency derivatives portfolio is
recorded in the condensed consolidated balance sheets at fair value and included in other assets or other liabilities. All movements in the
fair value of the foreign currency derivatives are recorded within other income, net, on our condensed consolidated statements of
income.
The table below provides information (in U.S. dollars) on our significant foreign-currency-denominated balances by legal entity
functional currency as of December 31, 2014 (in thousands):
AUD Functional:
Assets
Liabilities
Forward Contracts
Net Total
USD Functional:
Assets
Liability
Forward Contracts
Net Total
EURO Functional:
Assets
Liability
Forward Contracts
Net Total
GBP Functional:
Assets
Liability
Forward Contracts
Net Total
SGD Functional :
Assets
Liability
Forward Contracts
Net Total
SEK Functional :
Assets
Liability
Forward Contracts
Net Total
MYR Functional:
Assets
Liability
Forward Contracts
Net Total
Australian
Dollar
(AUD)
-
U.S.
Dollar
(USD)
204,975 159,151
(73,122) (45,140)
(130,000) (96,803)
1,853
17,208
-
8
(2)
6
3,739
(821)
2,918
-
738
738
178
(1,029)
(851)
(83)
(83)
23
Singapore
Dollar
(SGD)
Euro
(EUR)
(27)
(27)
-
(404)
(404)
Canadian
Dollar
(CAD)
British
Pound
(GBP)
Malaysian
Ringgit
(MYR)
(9,599) (10,080)
9,349
(9,599)
(731)
-
14,571
(1,021)
13,550
-
(11)
(11)
4,609
(32)
(4,674)
(97)
2,903
(1)
2,902
-
42,761
(40,674)
2,087
-
-
-
-
122,622
(92,157)
(25,000)
5,465
64,232
(37,813)
(24,201)
2,218
-
-
(7)
(7)
-
(4)
(4)
1,374
(337)
1,037
-
-
-
-
(3)
(3)
-
-
-
2,778
(500)
2,278
35
35
PART I – FINANCIAL INFORMATION
Item 3
RESMED INC. AND SUBSIDIARIES
Quantitative and Qualitative Disclosures About Market Risk
For personal use only
The table below provides information about our foreign currency derivative financial instruments and presents the information in U.S.
dollar equivalents. The table summarizes information on instruments and transactions that are sensitive to foreign currency exchange
rates, including foreign currency call options, collars and forward contracts held at December 31, 2014. The table presents the
notional amounts and weighted average exchange rates by contractual maturity dates for our foreign currency derivative financial
instruments, including the forward contracts used to hedge our foreign currency denominated assets and liabilities. These notional
amounts generally are used to calculate payments to be exchanged under the contracts (in thousands, except exchange rates).
Foreign Exchange Contracts
Receive AUD/Pay USD
Contract amount
Ave. contractual exchange rate
Receive AUD/Pay Euro
Contract amount
Ave. contractual exchange rate
Receive SGD/Pay Euro
Contract amount
Ave. contractual exchange rate
Receive SGD/Pay USD
Contract amount
Ave. contractual exchange rate
Receive GBP/Pay AUD
Contract amount
Ave. contractual exchange rate
Receive EUR/Pay GBP
Contract amount
Ave. contractual exchange rate
Fair Value Assets /
(Liabilities)
December 31, 2014 June 30, 2014
Year 1
Year 2
Year 3
Total
130,000
AUD 1 = USD 0.8138
-
-
130,000
AUD 1 = USD 0.8138
450
328
145,000
AUD 1 = Euro 0.7001
48,000
AUD 1 = Euro 0.7295
48,000
AUD 1 = Euro 0.7200
241,000
AUD 1 = Euro 0.7098
591
(2,574)
24,000
SGD 1 = Euro 0.6137
-
-
24,000
SGD 1 = Euro 0.6137
416
(90)
25,000
SGD 1 = USD 0.7612
-
-
25,000
SGD 1 = USD 0.7612
(191)
59
9,000
AUD 1 = GBP 0.5233
-
-
9,000
AUD 1 = GBP 0.5233
(14)
18
5,000
EUR 1 = GBP 0.7966
-
-
5,000
EUR 1 = GBP 0.7966
(117)
(11)
Interest Rate Risk
We are exposed to risk associated with changes in interest rates affecting the return on our cash and cash equivalents and debt. At
December 31, 2014, we held cash and cash equivalents of $880.7 million, principally comprised of bank term deposits and at-call
accounts, and they are invested at short-term fixed and variable interest rates. At December 31, 2014, we had total long-term debt,
including the current portion of those obligations of $449.7 million, of which $449.0 million is subject to variable interest rates. A
hypothetical 10% change in interest rates during the three months ended December 31, 2014, would not have had a material impact
on pretax income. We have no interest rate hedging agreements.
24
PART I – FINANCIAL INFORMATION
Item 4
RESMED INC. AND SUBSIDIARIES
Controls and Procedures
For personal use only
We maintain disclosure controls and procedures that are designed to provide reasonable assurance that information required to be
disclosed in our Exchange Act reports is recorded, processed, summarized and reported within the time periods specified in the SEC’s
rules and forms and that information is accumulated and communicated to our management, including our chief executive officer and
chief financial officer, as appropriate, to allow timely decisions regarding required disclosure. In designing and evaluating the
disclosure controls and procedures, management recognizes that any controls and procedures, no matter how well designed and
operated, can provide only reasonable assurance of achieving the desired control objectives, and in reaching a reasonable level of
assurance management necessarily was required to apply its judgment in evaluating the cost benefit relationship of possible controls
and procedures.
As required by Rule 13a-15(b) of the Exchange Act, we carried out an evaluation, under the supervision and with the participation of
our management, including our chief executive officer and chief financial officer, of the effectiveness of the design and operation of
our disclosure controls and procedures as of the end of the period covered by this report. Based on the foregoing, our chief executive
officer and chief financial officer concluded that our disclosure controls and procedures were effective at the reasonable assurance
level as of December 31, 2014.
There has been no change in our internal controls over financial reporting during our most recent fiscal quarter that has materially
affected, or is reasonably likely to materially affect, our internal controls over financial reporting.
25
Item 1-6
PART II – OTHER INFORMATION
RESMED INC. AND SUBSIDIARIES
For personal use only
Item 1
Legal Proceedings
We have initiated several legal proceedings to enforce our intellectual property rights. Litigation is inherently uncertain.
Accordingly, we cannot predict the outcome of these matters. But we do not expect the outcome of these matters to have a
material adverse effect on our consolidated financial statements when taken as a whole.
In 2013, we filed actions in the U.S. and Germany against Chinese manufacturer BMC Medical Co., Ltd to stop the
infringement of several ResMed patents. The U.S. International Trade Commission initiated an investigation, and in
December 2014, ruled that certain of BMC’s masks infringed ResMed’s patents and should be excluded from importation or
sale in the US. BMC notified the commission that it has discontinued US sales of the mask products affected by the
Commission’s order. The International Trade Commission also ruled that the patent claim asserted against BMC’s humidifier
patent was anticipated by prior art, invalidated that claim, and declined to exclude BMC’s humidifier products from
importation or sale. The ruling is subject to appeal. In 2013, we obtained a preliminary injunction prohibiting BMC from
marketing and selling certain flow generators and mask headgear accused of patent infringement in Germany. The
preliminary injunction against BMC’s mask headgear remains in effect, but in November 2014 the court dissolved the
preliminary injunction against the sale of BMC’s flow generators. We have appealed that ruling. Proceedings in Germany
continue.
Item 1A Risk Factors
Item 2
The discussion of our business and operations should be read together with the risk factors contained in our annual report on
Form 10-K for the fiscal year ended June 30, 2014, which was filed with the SEC and describes the various risks and
uncertainties to which we are or may become subject. At December 31, 2014, there have been no material changes to the risk
factors set forth in our annual report on Form 10-K for the year ended June 30, 2014.
Unregistered Sales of Equity Securities and Use of Proceeds
Purchases of equity securities. The following table summarizes purchases by us of our common stock during the three months
ended December 31, 2014:
Period
October 1 - 31, 2014
November 1 - 30, 2014
December 1 - 31, 2014
Total
(1)
Total Number
of Shares
Purchased
416,982
75,000
175,000
666,982
Average Price
Paid per Share
Total Number of Shares
Purchased as Part of
Publicly Announced
Programs (1)
Maximum Number of Shares
that May Yet Be Purchased
Under the Program(1)
48.16
53.40
53.93
51.31
37,694,964
37,769,964
37,944,964
37,944,964
17,021,049
16,946,049
16,771,049
16,771,049
On February 21, 2014, our board of directors approved our current share repurchase program, authorizing us to acquire up to an
aggregate of 20 million shares of our common stock. The program allows us to repurchase shares of our common stock from time
to time for cash in the open market, or in negotiated or block transactions, as market and business conditions warrant and subject to
applicable legal requirements. There is no expiration date for this program, and the program may be accelerated, suspended,
delayed or discontinued at any time at the discretion of our board of directors. All share repurchases after February 21, 2014 have
been executed under this program. Since the inception of the share buyback programs, we have repurchased 37.9 million shares at
a total cost of $1.4 billion.
Item 3
Item 4
Item 5
Defaults Upon Senior Securities
None
Mine Safety Disclosures
None
Other Information
None
26
PART II – OTHER INFORMATION
Item 1-6
RESMED INC. AND SUBSIDIARIES
Item 6
Exhibits
For personal use only
Exhibits (numbered in accordance with Item 601 of Regulation S-K)
3.1
First Restated Certificate of Incorporation of ResMed Inc., as amended. (Incorporated by reference to
Exhibit 3.1 to the Registrant’s Report on Form 10-Q for the quarter ended September 30, 2013)
3.2
Fifth Amended and Restated Bylaws of ResMed Inc. (Incorporated by reference to Exhibit 3.1 to the
Registrant’s Current Report on Form 8-K/A filed on September 17, 2012)
31.1
Certification of Chief Executive Officer Pursuant to Section 302 of the Sarbanes-Oxley Act of 2002.
31.2
Certification of Chief Financial Officer Pursuant to Section 302 of the Sarbanes-Oxley Act of 2002.
32
Certification of Chief Executive Officer and Chief Financial Officer Pursuant to Section 906 of the
Sarbanes-Oxley Act of 2002.
101
The following financial statements from ResMed Inc.’s Quarterly Report on Form 10-Q for the quarter
ended December 31, 2014, filed on January 29, 2015, formatted in XBRL: (i) Condensed Consolidated
Balance Sheets, (ii) Condensed Consolidated Statements of Income, (iii) Condensed Consolidated
Statements of Comprehensive Income, (iv) Condensed Consolidated Statements of Cash Flows, (v) the
Notes to the Condensed Consolidated Financial Statements.
27
PART II – OTHER INFORMATION
Signatures
Signatures
We have authorized the persons whose signatures appear below to sign this report on our behalf, in accordance with the Securities
Exchange Act of 1934.
For personal use only
January 29, 2015
ResMed Inc.
/s/ MICHAEL J. FARRELL
Michael J. Farrell
Chief executive officer
(Principal Executive Officer)
/s/ BRETT A. SANDERCOCK
Brett A. Sandercock
Chief financial officer
(Principal Financial Officer)
28
Exhibit 31.1
RESMED INC. AND SUBSIDIARIES
CERTIFICATION OF CHIEF EXECUTIVE OFFICER
Pursuant to Section 302 of the Sarbanes-Oxley Act of 2002
For personal use only
I, Michael J. Farrell, certify that:
1.
I have reviewed this quarterly report on Form 10-Q of ResMed Inc.;
2.
Based on my knowledge, this report does not contain any untrue statement of a material fact or omit to state a material fact
necessary to make the statements made, in light of the circumstances under which such statements were made, not misleading
with respect to the period covered by this report;
3.
Based on my knowledge, the financial statements, and other financial information included in this report, fairly present in all
material respects the financial condition, results of operations and cash flows of the registrant as of, and for, the periods
presented in this report;
4.
The registrant’s other certifying officer and I are responsible for establishing and maintaining disclosure controls and procedures
(as defined in Exchange Act Rules 13a-15(e) and 15d-15(e)) and internal control over financial reporting (as defined in
Exchange Act Rules 13a-15(f) and 15d-15(f)) for the registrant and have:
(a)
Designed such disclosure controls and procedures, or caused such disclosure controls and procedures to be designed under
our supervision, to ensure that material information relating to the registrant, including its consolidated subsidiaries, is
made known to us by others within those entities, particularly during the period in which this report is being prepared;
(b) Designed such internal controls over financial reporting, or caused such internal controls over financial reporting to be
designed under our supervision, to provide reasonable assurance regarding the reliability of financial reporting and the
preparation of financial statements for external purposes in accordance with generally accepted accounting principles;
(c)
Evaluated the effectiveness of the registrant’s disclosure controls and procedures and presented in this report our
conclusions about the effectiveness of the disclosure controls and procedures, as of the end of the period covered by this
report based on such evaluation; and
(d) Disclosed in this report any change in the registrant’s internal control over financial reporting that occurred during the
registrant’s most recent fiscal quarter (the registrant’s fourth fiscal quarter in the case of an annual report) that has
materially affected, or is reasonably likely to materially affect, the registrant’s internal control over financial reporting; and
5.
The registrant’s other certifying officer and I have disclosed, based on our most recent evaluation of internal control over
financial reporting, to the registrant’s auditors and the audit committee of the registrant’s board of directors (or persons
performing the equivalent functions):
(a)
All significant deficiencies and material weaknesses in the design or operation of internal control over financial reporting
which are reasonably likely to adversely affect the registrant’s ability to record, process, summarize and report financial
information; and
(b) Any fraud, whether or not material, that involves management or other employees who have a significant role in the
registrant’s internal control over financial reporting.
January 29, 2015
/s/ MICHAEL J. FARRELL
Michael J. Farrell
Chief executive officer
(Principal Executive Officer)
Exhibit 31.2
RESMED INC. AND SUBSIDIARIES
CERTIFICATION OF CHIEF FINANCIAL OFFICER
Pursuant to Section 302 of the Sarbanes-Oxley Act of 2002
For personal use only
I, Brett A. Sandercock, certify that:
1.
I have reviewed this quarterly report on Form 10-Q of ResMed Inc.;
2.
Based on my knowledge, this report does not contain any untrue statement of a material fact or omit to state a material fact
necessary to make the statements made, in light of the circumstances under which such statements were made, not misleading
with respect to the period covered by this report;
3.
Based on my knowledge, the financial statements, and other financial information included in this report, fairly present in all
material respects the financial condition, results of operations and cash flows of the registrant as of, and for, the periods
presented in this report;
4.
The registrant’s other certifying officer and I are responsible for establishing and maintaining disclosure controls and procedures
(as defined in Exchange Act Rules 13a-15(e) and 15d-15(e)) and internal control over financial reporting (as defined in
Exchange Act Rules 13a-15(f) and 15d-15(f)) for the registrant and have:
(a)
Designed such disclosure controls and procedures, or caused such disclosure controls and procedures to be designed under
our supervision, to ensure that material information relating to the registrant, including its consolidated subsidiaries, is
made known to us by others within those entities, particularly during the period in which this report is being prepared;
(b) Designed such internal controls over financial reporting, or caused such internal controls over financial reporting to be
designed under our supervision, to provide reasonable assurance regarding the reliability of financial reporting and the
preparation of financial statements for external purposes in accordance with generally accepted accounting principles;
(c)
Evaluated the effectiveness of the registrant’s disclosure controls and procedures and presented in this report our
conclusions about the effectiveness of the disclosure controls and procedures, as of the end of the period covered by this
report based on such evaluation; and
(d) Disclosed in this report any change in the registrant’s internal control over financial reporting that occurred during the
registrant’s most recent fiscal quarter (the registrant’s fourth fiscal quarter in the case of an annual report) that has
materially affected, or is reasonably likely to materially affect, the registrant’s internal control over financial reporting; and
5.
The registrant’s other certifying officer and I have disclosed, based on our most recent evaluation of internal control over
financial reporting, to the registrant’s auditors and the audit committee of the registrant’s board of directors (or persons
performing the equivalent functions):
(a)
All significant deficiencies and material weaknesses in the design or operation of internal control over financial reporting
which are reasonably likely to adversely affect the registrant’s ability to record, process, summarize and report financial
information; and
(b) Any fraud, whether or not material, that involves management or other employees who have a significant role in the
registrant’s internal control over financial reporting.
January 29, 2015
/s/ BRETT A. SANDERCOCK
Brett A. Sandercock
Chief financial officer
(Principal Financial Officer)
Exhibit 32
RESMED INC. AND SUBSIDIARIES
CERTIFICATION OF CHIEF EXECUTIVE OFFICER
PURSUANT TO SECTION 906 OF THE SARBANES-OXLEY ACT OF 2002
For personal use only
Pursuant to 18 U.S.C. § 1350, as created by Section 906 of the Sarbanes-Oxley Act of 2002, the undersigned officer of ResMed Inc.,
a Delaware corporation (the “Company”), hereby certifies, to his knowledge, that:
(i)
the accompanying Quarterly Report on Form 10-Q of the Company for the period ended December 31, 2014 (the “Report”) fully
complies with the requirements of Section 13(a) or Section 15(d), as applicable, of the Securities Exchange Act of 1934, as
amended; and
(ii) the information contained in the Report fairly presents, in all material respects, the financial condition and results of operations
of the Company.
January 29, 2015
/s/ MICHAEL J. FARRELL
Michael J. Farrell
Chief executive officer
(Principal Executive Officer)
A signed original of this written statement required by Section 906 has been provided to ResMed Inc. and will be retained by ResMed
Inc. and furnished to the Securities and Exchange Commission or its staff upon request. This certification will not be deemed “filed”
for purposes of Section 18 of the Securities Exchange Act of 1934, as amended, or otherwise subject to the liability of that section,
nor will this certification be deemed to be incorporated by reference into any filing under the Securities Act of 1933, as amended, or
the Securities Exchange Act of 1934, as amended, except to the extent that the registrant specifically incorporates it by reference.
RESMED INC. AND SUBSIDIARIES
CERTIFICATION OF CHIEF FINANCIAL OFFICER
PURSUANT TO SECTION 906 OF THE SARBANES-OXLEY ACT OF 2002
Pursuant to 18 U.S.C. § 1350, as created by Section 906 of the Sarbanes-Oxley Act of 2002, the undersigned officer of ResMed Inc.,
a Delaware corporation (the “Company”), hereby certifies, to his knowledge, that:
(i)
the accompanying Quarterly Report on Form 10-Q of the Company for the period ended December 31, 2014 (the “Report”) fully
complies with the requirements of Section 13(a) or Section 15(d), as applicable, of the Securities Exchange Act of 1934, as
amended; and
(ii) the information contained in the Report fairly presents, in all material respects, the financial condition and results of operations
of the Company.
January 29, 2015
/s/ BRETT A. SANDERCOCK
Brett A. Sandercock
Chief financial officer
(Principal Financial Officer)
A signed original of this written statement required by Section 906 has been provided to ResMed Inc. and will be retained by ResMed
Inc. and furnished to the Securities and Exchange Commission or its staff upon request. This certification will not be deemed “filed”
for purposes of Section 18 of the Securities Exchange Act of 1934, as amended, or otherwise subject to the liability of that section,
nor will this certification be deemed to be incorporated by reference into any filing under the Securities Act of 1933, as amended, or
the Securities Exchange Act of 1934, as amended, except to the extent that the registrant specifically incorporates it by reference.
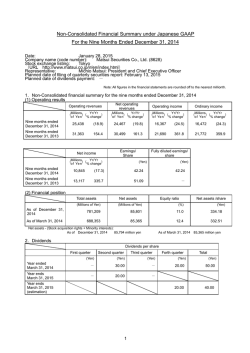
© Copyright 2026