
Foreign exchange - National Bank of Canada
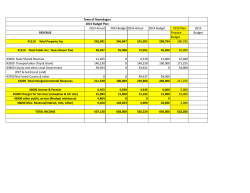
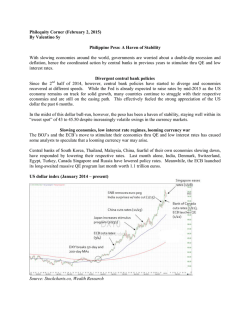
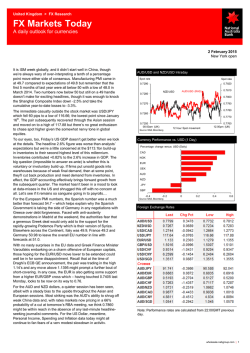
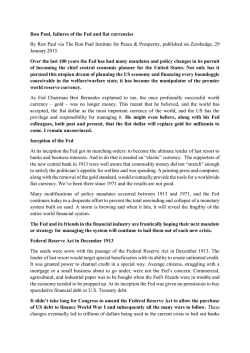
February 2015 Competitive devaluation The U.S. dollar continues to benefit from the divergence of monetary policy. The stronger U.S. economy has raised the probability of rate hikes by the Fed at a time when several other major central banks have seemingly adopted competitive devaluation strategies by not only increasing stimulus but also signalling their intent to continue on that path. So, the greenback has room to run over the near to medium term. That said, we expect a moderation in the rate of USD appreciation this year. Low inflation will cap the Fed’s abilities to significantly tighten monetary policy, while some unwinding of the massive speculative long positions could also take some steam out of the greenback. The European Central Bank’s quantitative easing program, slated to start in March, is significant. While the ECB’s balance sheet may not surpass the Fed’s in absolute terms, it will do so in relative terms ― as a percentage of the size of the respective economies, the ECB’s balance sheet will be larger than the Fed’s. Such currency debasement policies should hurt the euro. Recall that the trade-weighted U.S. dollar sank 18% from peak to trough during the Fed’s own QE program. The Canadian dollar has lost more than 20% of its value against the U.S. dollar in the last two years. That said, the loonie’s decline hasn’t been as drastic against other currencies considering competitive devaluations by other central banks. So, while the Bank of Canada said its surprise January rate cut was an “insurance policy” against downside risks to inflation and financial stability, the loonie’s relative competitiveness and preservation of market share may also have been at the back of Governor Poloz’s mind. We expect the BoC to deliver another rate cut at its March meeting, something that should keep the Canadian dollar under pressure over the near term. That’s not the say the loonie will remain on a downtrend. A recovery in oil prices should help offset headwinds generated by unfavourable yields and provide some support to the Canadian dollar. Stéfane Marion/Krishen Rangasamy NBF Currency Outlook* Current 2015Q1 2015Q2 2015Q3 2015Q4 2016Q1 1.24 0.80 1.26 0.80 1.27 0.79 1.28 0.78 1.27 0.79 1.25 0.80 EURUSD 1.15 1.14 1.13 1.12 1.10 1.10 USDJPY 117 118 120 122 125 125 AUDUSD 0.78 0.76 0.75 0.75 0.74 0.74 GBPUSD 1.51 1.50 1.49 1.48 1.47 1.47 USDCNY 6.26 6.27 6.28 6.28 6.29 6.29 AUDCAD 0.96 0.96 0.95 0.96 0.94 0.93 3-Feb-15 USDCAD US cents per CAD * forec asts for end of period Source: NBF Economic s and Strategy F FOREX X A Atypical surge s for greenbac ck Rec cord speculative e bets in favourr of U.S. dollar Net lo ong non-commercial positions p on USD 80 0,000 The trade-weig ghted U.S. dollar has now w seen gains s fo or seven straight months, allowing it re each its 2009 9 cyycle peak. Th he more than n 12% appre eciation since e Ju uly last year is i impressive, more so con nsidering thatt su uch gains are e atypical outtside of a pe eriod of crisis. The last time the t USD saw w such a surg ge was during g th he global recession of 2008/2009 and, before that,, th he Asian finan ncial crisis of 1998. contracts 70 0,000 60 0,000 50 0,000 40 0,000 30 0,000 20 0,000 10 0,000 0 -10 0,000 -20 0,000 -30 0,000 U U.S. dollar surge e atypical outside of a crisis T Trade weighted U.S. dollar, d 7-month change 20 18 16 14 12 10 8 6 4 2 0 -2 -4 -6 -8 -10 -12 % 1998 200 00 2002 2004 20 006 2008 2010 20 012 2014 Global recession Asian financial crisis 1996 1996 NB BF Economics and Strattegy (data via Datastream m) 1998 Current surge 2000 2002 2004 2006 2008 2010 0 2012 2014 h the entire Can the greenbacck’s surge exxtend through 5? To be sure e, it now seem ms easier for the Fed to 2015 surp prise on the up pside on rate es. Markets ha ave indeed signiificantly trimm med their exp pectations abo out the fed fund s rate ― the e fed funds ffutures now sshow rates endi ng the year below 0.50% %, i.e. not m much of an incre ease from the e current 0-0.2 25% range. T That’s quite dovissh compared d to where FOMC particip pants think ratess should be b by the end of tthe year. NBF Economics and Strategy (data via Datastream) This time, how wever, the worrld economy doesn’t d seem m to o be in crisis mode. m While global g growth h is admittedly y no ot stellar, parrtly due to co ontinued stag gnation in the e Eurozone and a softer eco onomy in Chin na (in light off re ebalancing efforts by Be eijing), the overall o global ou utlook nonetheless remains positive. The world’s s la argest econom my, the U.S., is on track to grow this s ye ear at the fastest f pace in a decad de. Emerging g ecconomies sh hould also continue c to benefit from m im mproving U.S. demand, mo ore competitiv ve currencies s ag gainst the USD, U and lo ower oil pric ces. Cheaperr en nergy is also o helping keep inflation low, allowing g ce entral banks in most ma ajor economies to assistt grrowth by keeping monetary m po olicy highly y acccommodativ ve. So if it’s not crisis-related d safe haven n flows, whatt exxactly is behind this USD surge? The divergence d off m monetary policy is clearrly a major driver. The e sttronger U.S. economy has s raised the probability off ra ate hikes by the Fed at a time when several otherr m major central banks b have no ot only loosen ned monetary y po olicy but also o signalled their intent in continuing c on n th hat path over the near to medium m term. Speculators s ha ave also am mplified the greenback’s ascent, via a re ecord net long g positions. Markkets don’t se eem to believve the FOMC C, perhaps due to the drag to the econo omy that is exxpected to oaring greenb back. Indeed, exporters com e from the so are a already starting to feel the e pinch according to the Fed’ s latest Beige Book. Also o, the USD su urge of the past year could worsen the already milld inflation outlo ook. The annu ual inflation ra ate as measu ured by the PCE E deflator in D December was at its lowesst since the 2008 8/09 recessio on, and that’ss partly due to sinking enerrgy prices. Bu ut prices havve been very mild even exclu uding transittory factors such as e energy, as evide enced by the e core PCE w which showed an annual inflattion rate of jjust 1.3% in December, the lowest 2 FOREX since March last year. And given the negative impact of the USD’s appreciation on import prices, odds are that PCE inflation will remain low and well below the Fed’s 2% target for the next several quarters. Eurozone: ECB ramps up the printing press Central bank balance sheet as a % of GDP Central bank balance sheet 4.8 Forecast* US$ trillion 34 % 32 Fed 4.4 4.0 3.6 28 26 ECB 24 U.S.: Import prices likely to contract this year 3.2 Trade-weighted U.S. dollar and import price index 2.8 20 2.4 18 8 7 6 5 4 3 2 1 0 -1 -2 -3 -4 -5 -6 -7 -8 y/y % chg. Inverse axis y/y % chg. -12 Import prices ex-petroleum (L) 2005 2006 2007 2008 2009 2010 2011 -10 -8 -6 Trade-weighted USD -4 four-month lag (R) -2 0 2 4 6 8 10 12 14 16 18 20 2012 2013 2014 2015 NBF Economics and Strategy (data via Datastream) All told, low inflation will cap the Fed’s abilities to significantly tighten monetary policy. So, while the USD has room to run in synch with diverging monetary policies, we expect a moderation in the rate of appreciation this year. Some unwinding of the massive speculative long positions may also take some steam out of the greenback. ECB launches QE 22 16 2.0 Fed 14 1.6 12 1.2 10 8 0.8 0.4 ...but will surpass the Fed’s relative to the size of the economy 30 ECB’s balance sheet will remain smaller than the Fed’s in absolute terms ... Forecast** ECB 6 00 01 02 03 04 05 06 07 08 09 10 11 12 13 14 15 16 *ECB’s QE at €60 bn/month from March 2015 to September 2016, unchanged thereafter; EURUSD at 1.10 end-2015 and 1.05 end-2016 4 00 01 02 03 04 05 06 07 08 09 10 11 12 13 14 15 16 ** ECB’s QE at €60 bn/month from March 2015 to September 2016, unchanged thereafter; nominal GDP grows 2% in eurozone in both 2015 and 2016 NBF Economics and Strategy (data via Bloomberg) January’s annual inflation rate of -0.6%, the lowest since July 2009, wasn’t all about low energy prices. Indeed, the annual core inflation rate was just 0.6% in January, the lowest on records. The failure by the zone’s governments to implement growth-friendly reforms and policies should continue to cap employment, growth and hence inflation. The political uncertainties brought, yet again, by Greece, won’t help either. All told, expect the ECB’s QE program to be extended well beyond 2016. Such currency debasement policies should hurt the euro. Recall that the trade-weighted U.S. dollar sank 18% from peak to trough during the Fed’s own QE program. Eurozone: Heading towards deflation Consumer price index 4.5 y/y % chg. 4.0 Having tried and failed over the last several years at rekindling credit and economic growth by using conventional measures, the European Central Bank finally decided in favour of a more aggressive approach. The ECB announced in January that it was starting quantitative easing via a plan to purchase €60 bn of private and public bonds per month on the secondary market. The central bank intends to carry out the program from March 2015 to September 2016 (i.e. taking total purchases to €1.1 trillion), although it made clear the program could be extended past that date or end sooner depending on whether or not economic objectives are met. So, the QE program is effectively open-ended. While the ECB’s balance sheet may not surpass the Fed’s in absolute terms, it will do so in relative terms ― as a percentage of the size of the respective economies, the ECB’s balance sheet will be larger than the Fed’s. Such drastic action, while belated in our view, had to be taken considering the mounting threat of deflation within the Eurozone. 3.5 3.0 2.5 2.0 1.5 1.0 Core 0.5 0.0 -0.5 -1.0 00 01 02 03 04 05 06 07 08 09 10 11 12 13 Headline 14 15 NBF Economics and Strategy (data via Datastream) Bank of Canada sinks loonie The Canadian dollar has lost more than 20% of its value against the U.S. dollar in the last two years. Such a slump is unprecedented for the loonie. While part of the decline was due to the strengthening USD, and declining oil prices, the Bank of Canada’s policies also explain part of the rout. The central bank’s communications have been largely dovish since Governor Poloz‘s arrival at the helm a year and 3 FOREX half ago. And in January, the Bank of Canada took its dovish stance a step further by dispatching a surprise interest rate cut. Loonie slump unprecedented 24-month change in value of C$ versus USD 35 % 30 25 20 15 10 5 0 -5 expected November GDP, provide the central bank ample ammunition to support further stimulus. We, accordingly, expect the BoC to deliver another rate cut at its March meeting, something that should keep the Canadian dollar under pressure over the near term. That would also help partly restore the C$’s competitiveness relative to other major currencies that have also sunk due to loose monetary policies by their respective central banks. Note that while the loonie is at a multi-year low against the USD, its decline hasn’t been as drastic against other currencies including the yen, the Australian dollar and Norwegian krone. -10 -15 Loonie depreciation largely against USD -20 Trade-weighted Canadian dollar -25 1996 1998 2000 2002 2004 2006 2008 2010 2012 2014 132 index 128 NBF Economics and Strategy (data via Datastream) Total 124 The central bank supported its decision by saying that it is taking some insurance in light of downside risks to inflation and financial stability brought by the oil price collapse. The latter can indeed have negative spillovers even beyond the oil patch. For instance, the housing market could be vulnerable if employment takes a hit from the expected moderation in economic growth. Revised employment data from Statistics Canada not only show that employment last year was weaker, but the dependence on Western Canada was even greater than previously thought ― 84% of the jobs created came from the four westernmost provinces (versus 71% before revisions). That’s bad news for the 2015 employment outlook because Western provinces are unlikely to repeat the feat considering what happened to energy prices. Excluding USD 120 116 112 108 104 100 96 92 2007 2008 2009 2010 2011 2012 2013 2014 NBF Economics and Strategy (data via Bank of Canada) That’s not the say the Canadian dollar will remain on a downtrend. In our view, the oil price collapse isn’t commensurate with demand and supply fundamentals. And with global demand continuing to hold firm, we expect WTI oil to bounce back to $60/barrel by the end of the year. That should help offset headwinds generated by unfavourable yields and provide some support to the Canadian dollar. Canada: More bad news from the labour market Employment creation according to Labour Force Survey 400 thousands 2014 job creation by provinces, in thousands 350 70 250 60 Private 150 50 40 100 50 30 Total 0 20 -50 -100 10 -150 0 -200 -10 -250 -300 … and 84% of those jobs were in Western Canada 80 300 200 -20 04 05 06 07 08 09 10 11 12 13 Oil price collapse does not reflect state of global economy OECD leading economic indicators versus Brent oil price Labour market created just 121K net new jobs last year ... 14 BC AB SK MB ON QC NB NS PE NL NBF Economics and Strategy (data via Statistics Canada) The string of bad data that came after the Bank of Canada’s surprise decision, including the downward revision to employment and the weaker-than- 102.5 Index World (L) 102.0 101.5 OECD (L) 101.0 US$/Barrel 170 160 150 140 100.5 100.0 130 120 99.5 99.0 98.5 110 100 90 98.0 97.5 97.0 80 70 60 Oil price (R) 96.5 96.0 95.5 95.0 2006 2007 2008 2009 2010 2011 2012 2013 2014 50 40 30 20 2015 NBF Economics and Strategy (data via OECD) 4 FOREX Annex Euro Canadian dollar 1.7 1.10 1.6 1.05 1.00 1.5 0.95 1.4 0.90 1.3 0.85 1.2 0.80 1.1 0.75 1.0 0.70 0.9 0.8 0.65 1994 1996 1998 2000 2002 2004 2006 2008 2010 2012 2014 0.60 1994 1996 1998 Japanese yen 1.15 140 1.05 135 1.00 130 2004 2006 2008 2010 2012 2014 0.95 2008 2010 2012 2014 2008 2010 2012 2014 1.10 125 0.90 120 0.85 115 110 0.80 0.75 105 0.70 100 95 0.65 90 0.60 85 0.55 80 0.50 1994 1996 1998 2000 2002 2004 2006 2008 2010 2012 2014 0.45 1994 1996 1998 British pound 2.1 2.0 1.9 1.8 1.7 1.6 1.5 1.4 1994 1996 1998 2000 2002 2004 2006 2000 2002 2004 2006 Chinese yuan 2.2 1.3 2002 Australian dollar 150 145 75 2000 2008 2010 2012 2014 8.8 8.6 8.4 8.2 8.0 7.8 7.6 7.4 7.2 7.0 6.8 6.6 6.4 6.2 6.0 5.8 5.6 1994 1996 1998 2000 2002 2004 2006 NBF Economics and Strategy (data via Datastream) 5 FOREX ECONOMICS AND STRATEGY GROUP 514-879-2529 Stéfane Marion Chief Economist & Strategist [email protected] Paul-André Pinsonnault Senior Fixed Income Economist [email protected] Krishen Rangasamy Senior Economist [email protected] Marc Pinsonneault Senior Economist [email protected] Matthieu Arseneau Senior Economist [email protected] General: National Bank Financial Markets is a business undertaken by National Bank Financial Inc. (“NBF”), an indirect wholly owned subsidiary of National Bank of Canada, and a division of National Bank of Canada. This research has been produced by NBF. National Bank of Canada is a public company listed on Canadian stock exchanges. The particulars contained herein were obtained from sources which we believe to be reliable but are not guaranteed by us and may be incomplete. The opinions expressed are based upon our analysis and interpretation of these particulars and are not to be construed as a solicitation or offer to buy or sell the securities mentioned herein. Canadian Residents: In respect of the distribution of this report in Canada, NBF accepts responsibility for its contents. To make further inquiry related to this report or effect any transaction, Canadian residents should contact their NBF Investment advisor. U.S. Residents: With respect to the distribution of this report in the United States, National Bank of Canada Financial Inc. (NBCFI) is regulated by the Financial Industry Regulatory Authority (FINRA) and a member of the Securities Investor Protection Corporation (SIPC). This report has been prepared in whole or in part by, research analysts employed by non-US affiliates of NBCFI that are not registered as broker/dealers in the US. These non-US research analysts are not registered as associated persons of NBCFI and are not licensed or qualified as research analysts with FINRA or any other US regulatory authority and, accordingly, may not be subject (among other things) to FINRA restrictions regarding communications by a research analyst with the subject company, public appearances by research analysts and trading securities held a research analyst account. All of the views expressed in this research report accurately reflect the research analysts’ personal views regarding any and all of the subject securities or issuers. No part of the analysts’ compensation was, is, or will be, directly or indirectly, related to the specific recommendations or views expressed in this research report. The analyst responsible for the production of this report certifies that the views expressed herein reflect his or her accurate personal and technical judgment at the moment of publication. Because the views of analysts may differ, members of the National Bank Financial Group may have or may in the future issue reports that are inconsistent with this report, or that reach conclusions different from those in this report. To make further inquiry related to this report, United States residents should contact their NBCFI registered representative. UK Residents: In respect of the distribution of this report to UK residents, National Bank Financial Inc. has approved the contents (including, where necessary, for the purposes of Section 21(1) of the Financial Services and Markets Act 2000). National Bank Financial Inc. and/or its parent and/or any companies within or affiliates of the National Bank of Canada group and/or any of their directors, officers and employees may have or may have had interests or long or short positions in, and may at any time make purchases and/or sales as principal or agent, or may act or may have acted as market maker in the relevant securities or related financial instruments discussed in this report, or may act or have acted as investment and/or commercial banker with respect thereto. The value of investments can go down as well as up. Past performance will not necessarily be repeated in the future. The investments contained in this report are not available to retail customers. This report does not constitute or form part of any offer for sale or subscription of or solicitation of any offer to buy or subscribe for the securities described herein nor shall it or any part of it form the basis of or be relied on in connection with any contract or commitment whatsoever. This information is only for distribution to Eligible Counterparties and Professional Clients in the United Kingdom within the meaning of the rules of the Financial Conduct Authority. National Bank Financial Inc. is authorised and regulated by the Financial Conduct Authority and has its registered office at 71 Fenchurch Street, London, EC3M 4HD. National Bank Financial Inc. is not authorised by the Prudential Regulation Authority and the Financial Conduct Authority to accept deposits in the United Kingdom. Copyright: This report may not be reproduced in whole or in part, or further distributed or published or referred to in any manner whatsoever, nor may the information, opinions or conclusions contained in it be referred to without in each case the prior express written consent of National Bank Financial.

© Copyright 2026