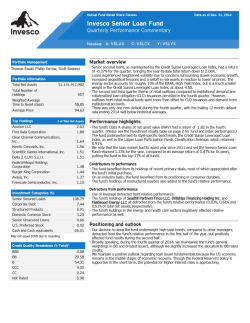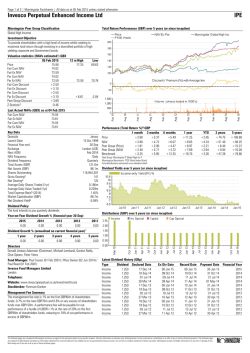
Invesco Global Core Equity Fund Quarterly Performance Update (PDF)
GCE-UPD-1-E_Communication 1/28/2015 8:34 AM Page 1
Mutual Fund Retail Share Classes
Data as of Dec. 31, 2014
Invesco Global Core Equity Fund
Quarterly Performance Commentary
Nasdaq: A: AWSAX
C: AWSCX
Y: AWSYX
Market overview
Portfolio Management
- Global equity markets finished the year weak as most markets outside the US declined in US
dollar terms during the fourth quarter largely due to currency effects. The MSCI World Index
gained 1.01% during the three months to end 2014 with a gain of 4.94%.
Erik Esselink, Brian Nelson
Portfolio Information
Total Net Assets
$1,102,211,004
Total Number of
Holdings
89
Top Holdings
% of Total Net Assets
American Express Co.
Berkshire Hathaway Inc.
IBM Corp.
Qualcomm Inc.
ABB Ltd.
Group Danone
Progressive Corp.
Northern Trust Corp.
ResMed Inc.
Rio Tinto Ltd.
Top Contributors
3.02
2.97
2.32
2.22
2.16
2.01
1.94
1.88
1.87
1.84
% of Total Net Assets
1. Resmed Inc.
2. Berkshire Hathaway Inc.
3. Fiat Chrysler Automobiles
4. Celgene Corp.
5. Kroger Co.
Top Detractors
1.87
2.97
0.87
1.58
1.03
% of Total Net Assets
1. Halliburton Co.
2. International Business Machines
Corp.
3. Sanofi
4. Concho Resources Inc.
5. Abercrombie & Fitch Co.
1.39
2.32
0.69
1.44
0.58
Performance highlights
- The fund’s Class A shares at net asset value (NAV) lagged the index for the fourth quarter.
(Please see the investment results table on page 2 for fund and index performance.)
- From a sector perspective, holdings in the financials and telecommunication services sectors
added to relative results during the quarter. Within the financials sector, several insurance
companies provided solid gains. To a lesser degree, the portfolio’s underweight allocation to
energy also aided relative performance.
- Stock selection in the consumer discretionary, industrials and information technology sectors
had the largest negative effect on relative return during the quarter.
- From a geographic perspective, holdings within the US detracted from relative performance
and accounted for the entire performance shortfall versus the index. Conversely, the portfolio
benefited from strong stock selection in several markets, including the UK, Taiwan, Canada
and Spain.
Contributors to performance
- Celgene Corp. outperformed due to general strength in the biotechnology group as well as a
good earnings report and growing belief that patent issues affecting a key drug will be settled.
- Also in the health care group, Resmed Inc., a specialist in sleep related disorders, reported
solid earnings and launched a new product cycle that has generated optimism about nearterm earnings.
- From a geographic perspective, strong stock selection in the UK contributed to relative
performance.
Detractors from performance
- Pharmaceutical firm Sanofi detracted from the fund’s relative performance, as the company
reported weakening US sales of Lantus, the company’s insulin drug for the treatment of
diabetes. Additionally, in late October, the company ousted its CEO in a move that surprised
many investors and precipitated a sharp selloff.
- Another top detractor, Halliburton Co., was significantly affected by the collapse in oil prices,
as energy was the worst performing index sector during the quarter.
Positioning and outlook
- There were no significant geographic shifts in the portfolio; however, several sector allocations
were adjusted. Specifically, the fund’s exposure to consumer discretionary, information
technology and energy stocks increased slightly, funded by reductions in health care,
materials and utilities.
- We remain focused on companies that provide an attractive return on their invested capital,
maintain a long-term perspective and trade at a good valuation. Though markets are likely to
remain volatile, these companies should be well-positioned to navigate an evolving economic
backdrop.
GCE-UPD-1-E_Communication 1/28/2015 8:34 AM Page 2
The Fund’s Positioning Versus the
MSCI World Index
Investment Results
Average Annual Total Returns (%) as of Dec. 31, 2014
Period
Inception
10 Years
5 Years
3 Years
1 Year
Quarter
Class A Shares
Inception:
12/29/00
Class C Shares
Inception:
12/29/00
Max
Load
5.50%
4.76
3.15
4.49
9.51
-5.12
-6.50
Max
CDSC
1.00%
4.44
2.97
4.89
10.77
-1.21
-2.01
NAV
5.18
3.74
5.68
11.59
0.38
-1.04
(% underweight/overweight)
Class Y Shares
Inception:
10/03/08
Style-Specific
Index
Int'l Common Stk
Domestic Common Stk
Cash
Int'l Pref Stk
Other
49.56
49.53
1.08
0.00
-0.17
4.34
Industrials
NAV
4.44
2.97
4.89
10.77
-0.33
-1.13
NAV
3.89
5.95
11.89
0.73
-0.89
MSCI World Index
6.03
10.20
15.47
4.94
1.01
Performance quoted is past performance and cannot guarantee comparable future results;
current performance may be lower or higher. Visit invesco.com/performance for the most recent
month-end performance. Performance figures reflect reinvested distributions and changes in net
asset value (NAV). Investment return and principal value will vary, and you may have a gain or a
loss when you sell shares. Index returns do not reflect any fees, expenses or sales charges. No
contingent deferred sales charge (CDSC) will be imposed on redemptions of Class C shares
following one year from the date shares were purchased. Performance shown at NAV does not
include applicable CDSC or front-end sales charges, which would have reduced the performance.
Class Y shares have no sales charge; therefore, performance is at NAV. Performance shown
prior to the inception date of Class Y shares is that of Class A shares and includes the 12b-1
fees applicable to Class A shares. Class A share performance reflects any applicable fee waivers
or expense reimbursements. Had fees not been waived and/or expenses reimbursed currently or
in the past, returns would have been lower. Returns less than one year are cumulative; all others
are annualized.
Index source: FactSet Research Systems Inc.
Asset Mix (%)
Consumer
Discretionary
Expense Ratios
% Net
% Total
Class A Shares
Class C Shares
Class Y Shares
1.30
2.05
1.05
1.30
2.05
1.05
2.30
Health Care
0.62
Consumer
Staples
0.45
Financials
0.19
Energy
-0.29
IT
-0.75
Telecom
Services
Materials
Utilities
-1.11
-3.30
-3.37
-5
0
5
Per the current prospectus
A negative in Cash or Other, as of the date shown, is
normally due to fund activity that has accrued or is
pending settlement.
For more information you can visit us at www.invesco.com/us
Class Y shares are available only to certain investors. See the prospectus for more information.
Asset allocation/diversification does not guarantee a profit or eliminate the risk of loss.
The fund holdings are organized according to the Global Industry Classification Standard, which was developed by and is the exclusive property and service mark of MSCI
Inc. and Standard & Poor’s.
The MSCI World IndexSM is an unmanaged index considered representative of stocks of developed countries. An investment cannot be made directly in an index.
GCE-UPD-1-E_Communication 1/28/2015 8:34 AM Page 3
About risk
Derivatives may be more volatile and less liquid than
traditional investments and are subject to market,
interest rate, credit, leverage, counterparty and
management risks. An investment in a derivative could
lose more than the cash amount invested.
An investment in developing/emerging market
countries carries greater risks compared to more
developed economies.
The risks of investing in securities of foreign
issuers can include fluctuations in foreign currencies,
political and economic instability, and foreign taxation
issues.
The fund is subject to certain other risks. Please see
the current prospectus for more information regarding
the risks associated with an investment in the fund.
Explore Intentional Investing with Invesco®
NOT FDIC INSURED | MAY LOSE VALUE | NO BANK GUARANTEE
Before investing, investors should carefully read the prospectus and/or summary prospectus and carefully consider the investment objectives,
risks, charges and expenses. For this and more complete information about the fund(s), investors should ask their advisors for a
prospectus/summary prospectus or visit invesco.com/fundprospectus.
Note: Not all products available at all firms. Advisors, please contact your home office.
Opinions expressed are those of the fund's portfolio management. Holdings are subject to change and are not buy/sell recommendations.
All data provided by Invesco unless otherwise noted. For US use only.
Invesco Global Core Equity Fund
GCE-UPD-1-E
01/15
invesco.com/us
Invesco Distributors, Inc.
© Copyright 2026
