
RIT Capital Partners RCP
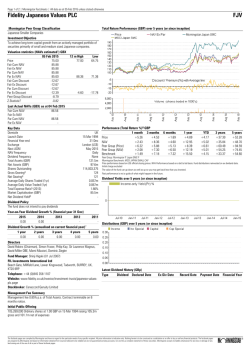
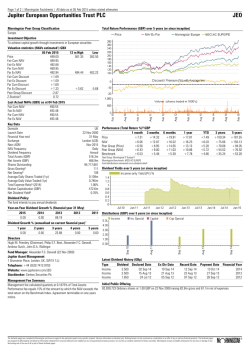
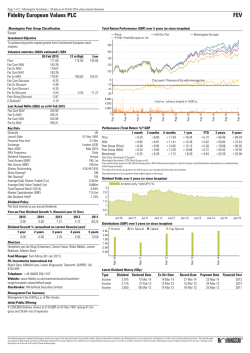
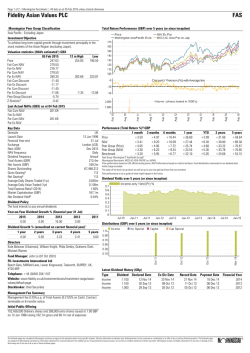
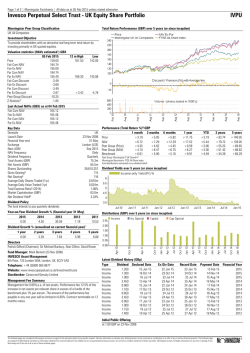
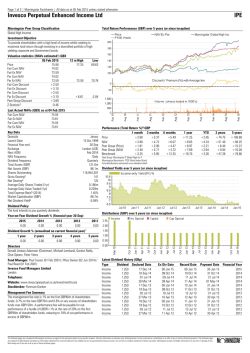
Page 1 of 2 | Morningstar Factsheets | All data as at 05 Feb 2015 unless stated otherwise
RIT Capital Partners
RCP
Morningstar Peer Group Classification
Global
Total Return Performance (GBP) over 5 years (or since inception)
Investment Objective
To achieve long-term capital growth through investment in international
quoted securities & unquoted holdings.
Valuation statistics (NAVs estimated1) GBX
05 Feb 2015
Price
1,455.00
Fair Cum NAV
1,539.47
Fair Ex NAV
1,536.47
Par Cum NAV
1,539.47
Par Ex NAV
1,527.85
Fair Cum Discount
-5.81
Fair Ex Discount
-5.63
Par Cum Discount
-5.81
Par Ex Discount
-4.77
Peer Group Discount
-5.78
-0.81
Z-Statistic2
12 m High
1,455.00
Low
1,242.00
1,539.22
1,331.76
-0.30
-8.39
Last Actual NAVs (GBX) as at 31 Dec 2014
Fair Cum NAV
1483.00
Fair Ex NAV
Par Cum NAV
1483.00
Par Ex NAV
Key Data
Domicile
Launch Date
Financial Year-end
Exchange
Next AGM
NAV Frequency
Dividend Frequency
Total Assets (GBP)
Net Assets (GBP)
Shares Outstanding
Gross Gearing3
Net Gearing4
Average Daily Shares Traded (1yr)
Average Daily Value Traded (1yr)
Total Expense Ratio5 (2013)
Market Capitalisation (GBP)
Net Dividend Yield6
UK
15 Jun 1988
31 Dec
London (LSE)
Apr 2015
Monthly
Semi-annual
2,534.3m
2,373.5m
155,351,431
107
121
0.120m
2.631m
1.25%
2,260.4m
2.02%
Performance (Total Return %)8 GBP
1 month 3 months
Price
+4.30
+2.83
NAV
+3.56
+7.40
Peer Group (Price)
+3.67
+5.39
Peer Group (NAV)
+3.56
+6.60
Benchmark
+3.25
+5.95
6 months
+10.50
+13.91
+12.31
+12.02
+12.35
1 year
+19.72
+15.08
+16.85
+15.81
+19.70
YTD
+4.15
+3.05
+2.96
+3.55
+3.26
3 years
+26.34
+34.46
+48.89
+42.66
+47.28
5 years
+61.47
+57.69
+86.48
+72.12
+78.66
Peer Group: Morningstar IT Global Growth P
Morningstar Benchmark: FTSE World Index World
Fund distributions reinvested on ex-dividend date8
Dividend Yields over 5 years (or since inception)
Dividend Policy
The fund intends to pay semi-annual dividends
Year-on-Year Dividend Growth % (financial year 31 Dec)
2015
0.00
2014
5.00
2013
75.00
2012
300.00
2011
0.00
Distributions (GBP) over 5 years (or since inception)
Dividend Growth % (annualised on current financial year)7
1 year
0.00
2 years
2.47
3 years
22.48
4 years
64.65
5 years
49.02
Directors
Lord Rothschild (Chairman), John Cornish, Jean Laurent-Bellue, Lord
Myners, John Makinson, Michael Marks CBE, Mike Power, Sandra
Robertson, Hannah Rothschild, Baroness Rothschild, Mike Wilson
Fund Manager: Not Disclosed (15 Jun 1988)
J Rothschild Capital Management
27 St James's Place, London, UK, SW1A 1NR
Telephone: +44 (0)20 7493 8111
Website: www.ritcap.co.uk
Stockbroker: JP Morgan Cazenove
Management Fee Summary
Fee structures within the long-only equity funds, whether structured as
segregated accounts or otherwise typically involve a 1% per annum
management fee with a 0% to 10% performance fee. The hedged equity
funds are slightly higher typically a 1% to 2% management fee and a 15%
to 20% performance fee. Private equity fees are structured differently and
will usually have a 1% to 2% annual charge as well as a 20% carried
interest above an 8% hurdle.
Latest Dividend History (GBp)
Type
Income
Income
Income
Income
Income
Dividend Declared Date
14.700
15 Aug 14
14.700
06 Mar 14
14.000
16 Aug 13
14.000
07 Mar 13
28.000
01 Jun 12
Ex Div Date
01 Oct 14
02 Apr 14
02 Oct 13
03 Apr 13
13 Jun 12
Record Date
03 Oct 14
04 Apr 14
04 Oct 13
05 Apr 13
15 Jun 12
Payment Date
24 Oct 14
29 Apr 14
18 Oct 13
26 Apr 13
24 Aug 12
Initial Public Offering
on 15 Jun 1988
The factbook pages are compiled by Morningstar and have no regard to the particular needs of any specific recipient. All price information is indicative only. Nothing herein is to be construed as a solicitation or an offer to buy or sell any financial products. The factbook pages
are prepared by Morningstar and based on information obtained from sources believed to be reliable but are not guaranteed as being accurate, nor are they a complete statement of these securities. Morningstar accepts no liability whatsoever for any loss or damage of any
kind arising out of the use of all or part of these factbook pages.
Financial Year
2014
2014
2013
2013
2012
Page 2 of 2 | Morningstar Factsheets | All data as at 05 Feb 2015 unless stated otherwise
RIT Capital Partners
RCP
Risk & Return9
Discrete Monthly Price & NAV Total Return % (GBP)
Sector Breakdown (%)
Discrete Yearly Price & NAV Total Return % (GBP)
Geographic Breakdown (%)
Risk & Correlation
Alpha (NAV) 11
Beta (NAV)12
R-squared (NAV)13
Sharpe (NAV)14
Price Volatility15
NAV Volatility15
Benchmark Volatility15
Peer Group Price Volatility15
Peer Group NAV Volatility15
3 months
0.02
1.05
0.94
2.11
12
13
12
11
11
6 months
0.01
1.01
0.94
2.10
13
12
11
12
11
1 year
0.12
0.61
0.68
2.32
12
11
10
10
9
3 years
0.13
0.62
0.76
1.52
15
11
10
10
9
5 years
0.06
0.69
0.73
0.93
18
13
13
12
12
Additional Performance (Total Return%8) GBX
Largest Holdings (% Portfolio10) as at 31 Dec 2013
BB Life Sciences
Lansdowne Developed Markets Fund Limited
Cedar Rock Capital
Investment property
Blackrock European Hedge Fund
Tekne Offshore
US Treasury Bill
Viking Long Fund III
Titan Partners
Roche Holding AG
Total
Capital Structure
Number of Shares
155,351,431
Loan CCY
USD
3.2%
3.2%
2.5%
2.4%
2.3%
2.2%
2.2%
2.2%
2.2%
2.0%
24.4%
Period
2015
2014
2013
2012
2011
2010
Since FTSE 2009 Low (13 Mar 09)
Since Sub-Prime (20 Nov 07)
Since FTSE 2007 Peak (13 Oct 07)
Price
+4.15
+13.30
+13.97
-5.37
+2.42
+15.17
+97.18
+43.97
+39.54
NAV Peer Price
+3.05
+2.96
+9.39
+11.47
+18.61
+23.34
+5.58
+12.29
-8.37
-8.53
+19.28
+20.13
+89.70
+160.95
+49.65
+63.40
+42.83
+53.49
Peer NAV Benchmark
+3.55
+3.26
+8.55
+11.29
+21.11
+22.36
+12.55
+11.83
-8.98
-5.79
+18.74
+16.28
+147.47
+160.36
+57.51
+77.14
+47.07
+64.56
Wind-up Provisions/Buy Back Policy
The Company has no fixed life. The Company is authorised to purchase up to 14.99% of its issued share capital.
Share Type
Ord 100p
£m
160.4
Redemption
Coupon
-
Net Dividend Yield – This is calculated by dividing the current financial years dividends (this will include prospective dividends) by the current price.
Dividend Growth – The annualised percentage growth in dividends. Based upon the current financial year, including any future estimates or forecasts.
Performance – Calculated using start and end period Share Prices or NAV Dividends are reinvested on the ex-dividend date at the prevailing Share Price or NAV.
Risk & Return – 1 Year ex income par NAV total return performance against 1 Year NAV volatility. Please see notes 8 and 15 for performance and volatility definitions
respectively.
2
10 Portfolio – In order to calculate the portfolio value we deduct any holdings in cash only (Note that Fixed Interest is not included).
11 Alpha – The difference between the fund’s average excess total return and the benchmark’s average excess total return.
3
12 Beta – The sensitivity of the fund to broad market movements. A Beta of 0.5 would imply the fund will move by half as much as the index.
4
13 R-squared – A measure of correlation between the fund and index. A value of 0.8 means that 80% of the fund’s NAV changes can be explained by changes in the index.
14 Sharpe – A risk-adjusted return measure, calculated by dividing the fund’s average monthly excess total return over the risk-free rate by the standard deviation of those returns.
5
The figure shown is the annualized Sharpe Ratio.
15 Volatility – The annualized standard deviation of the logged daily returns, adjusting for distributions from capital.
The factbook pages are compiled by Morningstar and have no regard to the particular needs of any specific recipient. All price information is indicative only. Nothing herein is to be construed as a solicitation or an offer to buy or sell any financial products. The factbook pages
are prepared by Morningstar and based on information obtained from sources believed to be reliable but are not guaranteed as being accurate, nor are they a complete statement of these securities. Morningstar accepts no liability whatsoever for any loss or damage of any
kind arising out of the use of all or part of these factbook pages.
1
NAV Estimation - Fair value of debt refers to the market price of the debt if it is traded or, if it is not traded, an
estimation of its value calculated using points over gilt methodology.
Cum Income NAVs include net revenue in the financial year to date. All estimates are fully diluted for the effects of
warrants, convertibles or treasury shares. NAV estimations are created and maintained by Morningstar. For more
detailed methodology document please contact [email protected]
Z-Statistic 1y – Shows whether the fund’s current discount is significantly higher or lower than the average over the
past year, calculated as (Current Discount – Mean) / Std Dev
Gross Gearing – The ratio of estimated gross Assets to the Net Assets, expressed as a percentage
Net Gearing – The ratio of estimated Gross Assets minus cash and fixed interest to the Net Assets, expressed as a
percentage. Cash and fixed interest represents not-equity exposure.
Total Expense Ratio – (Total Expenses – Performance Fees – Cost of Leverage – Tax – Restructuring Costs) /
Average Net Assets
6
7
8
9
© Copyright 2026