
Northern Plains: Origins, Evolution and Response to Climate Change
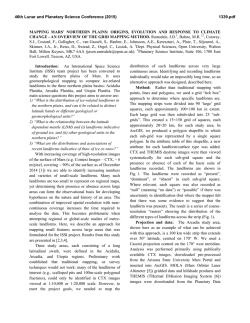
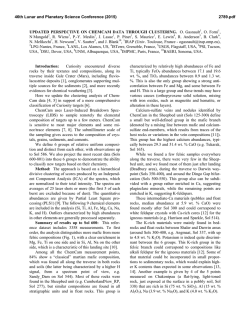
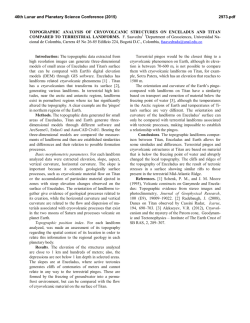
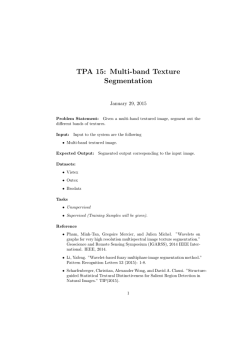
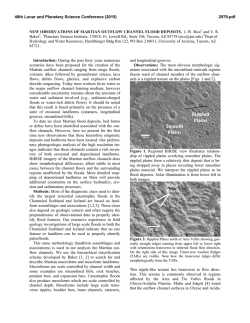
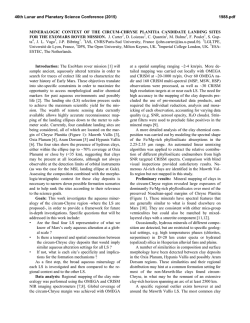
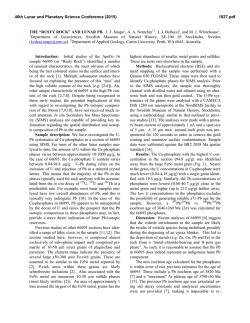
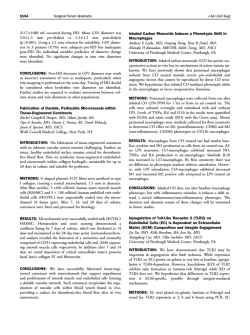
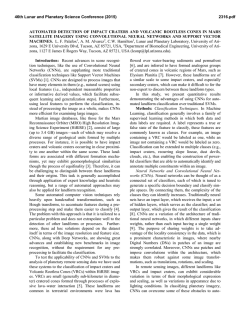
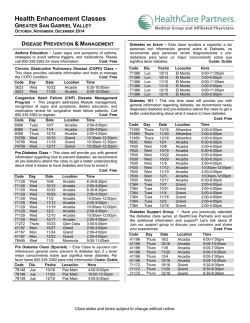
46th Lunar and Planetary Science Conference (2015)
1384.pdf
MAPPING MARS’ NORTHERN PLAINS: ORIGINS, EVOLUTION AND RESPONSE TO CLIMATE CHANGE – A
NEW OVERVIEW OF RECENT ICE-RELATED LANDFORMS IN ARCADIA PLANITIA. Balme, M.R.1, J.D. Rams-
dale1, S.J. Conway1, C. Gallagher2, A. Kereszturi3, F. Costard4, S. van Gasselt5, E. Hauber6, A.E. Johnsson7, C. Orgel5,6, T. Platz5, A. Séjourné4, J.A. Skinner8, Z. Swirad9, D. Reiss10, A. Losiak11. 1Dept. Physical Sciences, Open University, Milton Keynes, UK ([email protected]), 2University College Dublin, Ireland, 3CSFK, Hungarian Academy of Science, Hungary, 4Univ. Paris-Sud, France, 5Freie Universität Berlin, Germany, 6DLR, Germany,7Univ.
Gothenburg, Sweden, 8USGS, USA, 9Durham University, UK, 10Univ. Münster, Germany,11Institute of Geological
Sciences, Polish Academy of Sciences, Poland.
Introduction: The northern plains of Mars host
many landforms and surfaces thought to contain water
ice [1] but the distribution and origins of these ice-related features are not well understood. To try to measure
the distribution of ice-related landforms, and to compare
and contrast different latitude zones and regions of the
northern plains, an International Space Science Institute
(ISSI) team project has been convened to study the
northern plains. This project uses geomorphological
mapping to compare ice-related landforms in the three
major northern plains basins: Acidalia Planitia, Arcadia
Planitia, and Utopia Planitia. We have used “grid mapping”, described in more detail by [2], to determine the
locations of various ice-related surface and features.
Here, preliminary results from the Arcadia study area
(Fig. 1) are presented. Results from Utopia and Acidalia
are given in [3] and [4], and from impact crater studies
in these swaths in [5].
Fig. 1 Arcadia Planitia Study area. The swath is 300
km wide and extends from 30° to 80° N.
Method overview: The study area is a long northsouth swath that maintains a constant width and covers
50° of latitude (Fig. 1). The mapping mainly uses CTX
[6] images (6m/pixel) for small-scale landforms, and
THEMIS [7] daytime images (~100m/pixel) for larger
features. These data have near-continuous coverage. A
20×20km grid was overlain on the study area and the
presence or absence of various features in each gridsquare noted. This was done in ArcGIS 10.1 software,
and used a Cassini projection. The features mapped
were: scalloped pits/depressions (indicating ‘cryokarst’
processes [e.g. 8]), 100m-scale polygons (indicating
thermal contraction fractures in ice-rich regolith [e.g.,
9], km-scale polygons (trough/ridge patterns perhaps related to ice/water [e.g. 10]), textured surfaces (including
‘basketball’, “etched” and “wrinkled” terrains caused
by degradation of ice-rich surfaces [e.g., 11]), Viscous
flow features (lineated/concentric features, probably
due to flow of massive ice [e.g. 12]), pits (other small
pits thought to form by deflation of an icy-surface),
thumbprint terrain (arcuate ridge/cone-chain pattern,
perhaps related to ice [e.g. 13]) small mounds (appearing to form erosional remnants), and large pitted
mounds (similar in morphology to putative mud volcanoes [e.g., 14]). Finally, each grid was assessed as to
whether it was “mantled” by putative ice/dust material
[e.g., 15]. This was done independently of morphological designations such as “textured” by assessing
whether the local topography was draped by such a
mantle) Also, a few non ice-related features were
mapped, such as “dunes” and “bedrock” (which was
used to indicate that a surface appeared free of ice-influenced modification). In addition to the grid mapping,
a basic geological map of the swath was produced that
combined pre-existing mapping [e.g., 16] with new observations of gross morphological features such as
larger impact craters and channel networks.
Results: Fig. 2 shows summary and example results
from the study. Results of particular note are 1) “textured” surfaces are ubiquitous down to about 35°N, and
match the distribution of mantling drapes. 2) Small pits
are common in the south and middle of the study area
swath, but become less frequent to the north. 3) 100mscale polygons are found mainly near the North of the
study area, in contrast to results from Utopia [3]. Also,
unlike Utopia, there are very few scalloped depressions.
4) Small mounds – morphologically somewhat similar
to erosional outliers – correlate with albedo and relief
patterns that form a contributory network between 40°
and 50°N. This might suggest there was an extensive,
erosional fluvial system in this region.
46th Lunar and Planetary Science Conference (2015)
1384.pdf
Conclusions: The grid mapping has provided a
rich dataset that we have only just begun to fully use.
Future studies will compare these spatial data with
other information such as roughness, topographic
height, slope, geological unit type, sub-surface
RADAR returns, and climate model data. Also, the
three mapped strips will be contrasted with one another in order to assess whether the dominant control
on landform/surface type is latitude (i.e. climate or insolation strength) or substrate.
Acknowledgements: This work was performed
by an International Team supported by ISSI (International Space Science Institute), Bern, Switzerland.
Fig. 2. Summary and example data from Arcadia Planitia grid-mapping. a) summary of all landforms and surface types, b) “mantled” designation, c) “textured”
morphological type terrain, and d) “pitted” morphological type terrain. Background map takes simplified contacts from [16] and additional mapping (e.g., of channel-like features) from this study.
References: [1] Lasue, J. et al. (2013) Space Sci.
Rev., 174, 155-212. [2] Ramsdale, J. et al. (2015, this
volume) LPS XLVI, Abstr. #1339. [3] Séjourné, A. et
al. (2015, this volume) LPS XLVI, Abstr. #1328. [4]
Hauber, E. et al. (2015, this volume) LPS XLVI, Abstr.
#1359. [5] Skinner, J.A. et al. (2015, this volume) LPS
XLVI, Abstr. #1700. [6] Malin, M. C. et al. (2007)
JGR 112, doi:10.1029/2006JE002808. [7] Christensen, P.R. et al., (2001), JGR, 106, 23,823-23,872. [8]
Costard, F. and J. Kargel (1995) Icarus 114, 93-112.
[9] Seibert, N.M and J. Kargel (2001) GRL, 28, 899902. [10] Lane, M.D. and P.R. Christensen (2012)
JGR, 105, DOI: 10.1029/1999JE001197. [11] Kostama,
V-P.
et
al.,
(2006),
GRL,
33,
doi:10.1029/2006GL025946. [12] Squyres, S.W. and
M.H. Carr, (1986) Science, 231, 249-252. [13] Kargel,
J.S. and R.G. Strom, (1992) Geology, 20, 3-7 [14] Orgel, C. et al. (2015, this volume) LPS XLVI, Abstr. #
1862 [15] Head, J.W., et al., (2003) Nature, 412, 411414 [16] Tanaka K. L. et al. (2014) USGS SIM 3292,
1:20M scale
© Copyright 2026