
MICHAEL KORS HOLDINGS LTD
February 1, 2015
NYSE: KORS
MICHAEL KORS HOLDINGS LTD
BUY
A+
A
A-
HOLD
B+
B
Annual Dividend Rate
NA
B-
C+
C
Annual Dividend Yield
NA
SELL
C-
D+
D
Beta
2.00
Sector: Consumer Goods & Svcs
KORS BUSINESS DESCRIPTION
Michael Kors Holdings Limited is engaged in the
design, marketing, distribution, and retailing of
branded women's apparel and accessories, and
men's apparel. The company operates in three
segments: Retail, Wholesale, and Licensing.
STOCK PERFORMANCE (%)
3 Mo.
Price Change
-5.91
Weekly Price: (US$)
D-
E+
E
E-
F
Market Capitalization
$14.9 Billion
BUY
RATING SINCE
TARGET PRICE
52-Week Range
$65.10-$101.04
Sub-Industry: Apparel, Accessories & Luxury Goods
SMA (50)
SMA (100)
12/17/2013
$83.77
Price as of 1/29/2015
$72.53
Source: S&P
1 Year
2 Years
100
95
90
85
TARGET
TARGET
TARGETPRICE
PRICE$83.77
$83.77
PRICE
$83.77
TARGET
80
75
1 Yr.
-7.89
3 Yr (Ann)
34.44
Last Qtr
42.72
41.96
40.84
12 Mo.
49.34
56.47
54.47
3 Yr CAGR
NA
NA
NA
RETURN ON EQUITY (%)
KORS
Q2 2014
34.98
Q2 2013
36.20
Q2 2012
32.02
Ind Avg
23.12
22.08
21.57
S&P 500
14.59
13.97
13.23
70
65
60
GROWTH (%)
Revenues
Net Income
EPS
55
50
Rating History
HOLD
BUY
Volume in Millions
75
50
25
2013
2014
2015
0
COMPUSTAT for Price and Volume, TheStreet Ratings, Inc. for Rating History
P/E COMPARISON
RECOMMENDATION
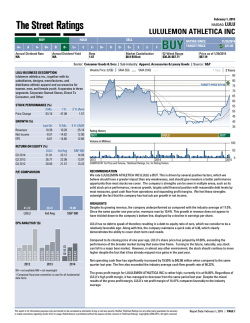
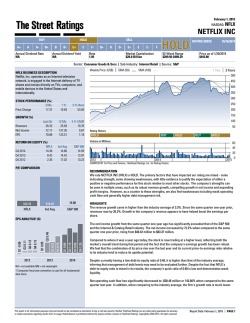
We rate MICHAEL KORS HOLDINGS LTD (KORS) a BUY. This is driven by several positive factors, which we
believe should have a greater impact than any weaknesses, and should give investors a better performance
opportunity than most stocks we cover. The company's strengths can be seen in multiple areas, such as its
robust revenue growth, largely solid financial position with reasonable debt levels by most measures,
impressive record of earnings per share growth, compelling growth in net income and expanding profit
margins. We feel these strengths outweigh the fact that the company shows weak operating cash flow.
19.09
30.41
19.08
KORS
Ind Avg
S&P 500
HIGHLIGHTS
The revenue growth came in higher than the industry average of 17.0%. Since the same quarter one year
prior, revenues rose by 42.7%. Growth in the company's revenue appears to have helped boost the earnings
per share.
EPS ANALYSIS¹ ($)
2012
2013
Q2 1.00
Q1 0.91
Q4 0.78
Q3 1.11
Q2 0.71
Q1 0.61
Q4 0.50
Q3 0.64
Q2 0.49
Q1 0.34
KORS has no debt to speak of therefore resulting in a debt-to-equity ratio of zero, which we consider to be a
relatively favorable sign. Along with this, the company maintains a quick ratio of 4.17, which clearly
demonstrates the ability to cover short-term cash needs.
MICHAEL KORS HOLDINGS LTD has improved earnings per share by 40.8% in the most recent quarter
compared to the same quarter a year ago. The company has demonstrated a pattern of positive earnings per
share growth over the past two years. We feel that this trend should continue. During the past fiscal year,
MICHAEL KORS HOLDINGS LTD increased its bottom line by earning $3.21 versus $1.97 in the prior year. This
year, the market expects an improvement in earnings ($4.18 versus $3.21).
2014
NA = not available NM = not meaningful
1 Compustat fiscal year convention is used for all fundamental
data items.
The net income growth from the same quarter one year ago has significantly exceeded that of the S&P 500
and the Textiles, Apparel & Luxury Goods industry. The net income increased by 42.0% when compared to the
same quarter one year prior, rising from $145.81 million to $206.99 million.
The gross profit margin for MICHAEL KORS HOLDINGS LTD is rather high; currently it is at 61.05%. It has
increased from the same quarter the previous year. Along with this, the net profit margin of 19.59% is above
that of the industry average.
This report is for information purposes only and should not be considered a solicitation to buy or sell any security. Neither TheStreet Ratings nor any other party guarantees its accuracy
or makes warranties regarding results from its usage. Redistribution is prohibited without the express written consent of TheStreet Ratings. Copyright(c) 2006-2015. All rights reserved.
Report Date: February 1, 2015
PAGE 1
February 1, 2015
NYSE: KORS
MICHAEL KORS HOLDINGS LTD
Sector: Consumer Goods & Svcs Apparel, Accessories & Luxury Goods Source: S&P
Annual Dividend Rate
NA
Annual Dividend Yield
NA
PEER GROUP ANALYSIS
50%
REVENUE GROWTH AND EBITDA MARGIN*
KORS
V
FA
Price as of 1/29/2015
$72.53
INDUSTRY ANALYSIS
The textiles, apparel, and luxury goods industry includes very well-known brands such as Nike (NKE), Coach
(COH), Luxottica Group (LUX), Ralph Lauren (RL), Fossil (FOSL), Under Armour (UA), HanesBrands (HBI),
Columbia Sportswear (COLM), Crocs (CROX), and Movado Group (MOV).
R
VO
FA
LE
AB
-10%
UN
Revenue Growth (TTM)
LE
LULU
LUX
15%
32.5%
EBITDA Margin (TTM)
Companies with higher EBITDA margins and
revenue growth rates are outperforming companies
with lower EBITDA margins and revenue growth
rates. Companies for this scatter plot have a market
capitalization between $5.1 Billion and $30.8 Billion.
Companies with NA or NM values do not appear.
*EBITDA – Earnings Before Interest, Taxes, Depreciation and
Amortization.
50%
REVENUE GROWTH AND EARNINGS YIELD
KORS
PEER GROUP: Textiles, Apparel & Luxury Goods
Recent
Ticker
Company Name
Price ($)
KORS
MICHAEL KORS HOLDINGS LTD 72.53
PVH
PVH CORP
112.94
LULU
LULULEMON ATHLETICA INC
67.19
GIL
GILDAN ACTIVEWEAR INC
58.57
FOSL
FOSSIL GROUP INC
99.99
VFC
VF CORP
71.39
LUX
LUXOTTICA GROUP SPA
60.06
UA
UNDER ARMOUR INC
72.80
HBI
HANESBRANDS INC
116.07
COH
COACH INC
38.94
RL
RALPH LAUREN CORP
170.03
Market
Cap ($M)
14,935
9,312
8,880
7,174
5,108
30,831
28,929
12,814
11,594
10,731
10,444
Price/
Earnings
19.09
26.95
41.22
20.06
14.62
24.37
38.75
86.15
29.31
19.09
20.49
Net Sales
TTM ($M)
3,905.44
8,233.36
1,715.72
2,359.99
3,507.27
11,993.40
9,711.80
2,871.93
5,324.75
4,494.04
7,584.00
Net Income
TTM ($M)
785.39
350.04
237.87
359.55
371.10
1,293.07
749.24
184.50
404.52
568.62
753.00
The peer group comparison is based on Major Apparel, Accessories & Luxury Goods companies of comparable size.
V
FA
AB
OR
LE
UA
HBI
R
VO
FA
LULU
PVH
GIL
VFC RL
FOSL
LE
AB
-10%
UN
Revenue Growth (TTM)
52-Week Range
$65.10-$101.04
While textiles may have once been a large portion of this industry group, that segment is down to a few
players such as Unifi (UFI), Culp (CFI), Crown Crafts (CRWS), and Hallwood Group (HWG). Most of the industry
is focused on brands for shoes, clothing, eyewear, and wrist watches. Companies in the group tend to own a
variety of proprietary brands in order to design, develop, market, and distribute products targeted to specific
consumer segments.
HBI
FOSL
RL
GIL
VFC
PVH
Market Capitalization
$14.9 Billion
The companies in the textiles, apparel, and luxury goods industry sell their products through multiline
retailers and over the internet. Some of the larger players in this industry group cross over into the specialty
retailer category with exclusively branded stores of their own such as Nike, Coach, Fossil, and Ralph Lauren.
AB
OR
UA
Beta
2.00
LUX
1%
COH
7%
Earnings Yield (TTM)
Companies that exhibit both a high earnings yield
and high revenue growth are generally more
attractive than companies with low revenue growth
and low earnings yield. Companies for this scatter
plot have revenue growth rates between -9.8% and
49.3%. Companies with NA or NM values do not
appear.
This report is for information purposes only and should not be considered a solicitation to buy or sell any security. Neither TheStreet Ratings nor any other party guarantees its accuracy
or makes warranties regarding results from its usage. Redistribution is prohibited without the express written consent of TheStreet Ratings. Copyright(c) 2006-2015. All rights reserved.
Report Date: February 1, 2015
PAGE 2
February 1, 2015
NYSE: KORS
MICHAEL KORS HOLDINGS LTD
Sector: Consumer Goods & Svcs Apparel, Accessories & Luxury Goods Source: S&P
Annual Dividend Rate
NA
Annual Dividend Yield
NA
COMPANY DESCRIPTION
Michael Kors Holdings Limited is engaged in the design,
marketing, distribution, and retailing of branded
women's apparel and accessories, and men's apparel.
The company operates in three segments: Retail,
Wholesale, and Licensing. The Retail segment is
involved in the sale of women's apparel; accessories,
which include handbags and small leather goods, such
as wallets; footwear; and licensed products comprising
watches, fragrances, and eyewear. This segment
operates 176 company-owned retail stores and 176
locations operated through its licensing partners. The
Wholesale segment sells accessories, which include
handbags and small leather goods, footwear, and
women's and men's apparel to department stores and
specialty shops in North America and Europe. The
Licensing segment licenses its trademarks on products,
such as fragrances, cosmetics, eyewear, leather goods,
jewelry, watches, coats, men's suits, swimwear, furs,
and ties, as well as licenses rights to third parties to sell
the company's products in geographical regions, such as
Korea, the Philippines, Singapore, Malaysia, Indonesia,
Australia, the Middle East, Russia, Turkey, China, Hong
Kong, Macau Taiwan, Latin America and the Caribbean,
and India. The company sells its products under the
names of MICHAEL KORS, MICHAEL MICHAEL KORS,
and various other related trademarks and logos. Michael
Kors Holdings Limited was founded in 1981 and is based
in Tsim Sha Tsui, Hong Kong.
MICHAEL KORS HOLDINGS LTD
Tower 6, 19th Floor, Unit 1902, The Gateway, Harbo
Tsim Sha Tsui
VGB
Phone: 852 3928 5563
http://www.michaelkors.com
Employees: 9000
Beta
2.00
Market Capitalization
$14.9 Billion
52-Week Range
$65.10-$101.04
Price as of 1/29/2015
$72.53
STOCK-AT-A-GLANCE
Below is a summary of the major fundamental and technical factors we consider when determining our
overall recommendation of KORS shares. It is provided in order to give you a deeper understanding of our
rating methodology as well as to paint a more complete picture of a stock's strengths and weaknesses. It is
important to note, however, that these factors only tell part of the story. To gain an even more comprehensive
understanding of our stance on the stock, these factors must be assessed in combination with the stock’s
valuation. Please refer to our Valuation section on page 5 for further information.
FACTOR
SCORE
5.0
Growth
out of 5 stars
weak
Measures the growth of both the company's income statement and
cash flow. On this factor, KORS has a growth score better than 90% of
the stocks we rate.
strong
2.5
Total Return
out of 5 stars
weak
Measures the historical price movement of the stock. The stock
performance of this company has beaten 40% of the companies we
cover.
strong
3.5
Efficiency
out of 5 stars
weak
Measures the strength and historic growth of a company's return on
invested capital. The company has generated more income per dollar of
capital than 60% of the companies we review.
strong
2.5
Price volatility
out of 5 stars
weak
Measures the volatility of the company's stock price historically. The
stock is less volatile than 40% of the stocks we monitor.
strong
5.0
Solvency
out of 5 stars
weak
Measures the solvency of the company based on several ratios. The
company is more solvent than 90% of the companies we analyze.
strong
0.5
Income
out of 5 stars
weak
Measures dividend yield and payouts to shareholders. This company
pays no dividends.
strong
THESTREET RATINGS RESEARCH METHODOLOGY
TheStreet Ratings' stock model projects a stock's total return potential over a 12-month period including both
price appreciation and dividends. Our Buy, Hold or Sell ratings designate how we expect these stocks to
perform against a general benchmark of the equities market and interest rates. While our model is
quantitative, it utilizes both subjective and objective elements. For instance, subjective elements include
expected equities market returns, future interest rates, implied industry outlook and forecasted company
earnings. Objective elements include volatility of past operating revenues, financial strength, and company
cash flows.
Our model gauges the relationship between risk and reward in several ways, including: the pricing drawdown
as compared to potential profit volatility, i.e.how much one is willing to risk in order to earn profits; the level of
acceptable volatility for highly performing stocks; the current valuation as compared to projected earnings
growth; and the financial strength of the underlying company as compared to its stock's valuation as
compared to projected earnings growth; and the financial strength of the underlying company as compared
to its stock's performance. These and many more derived observations are then combined, ranked, weighted,
and scenario-tested to create a more complete analysis. The result is a systematic and disciplined method of
selecting stocks.
This report is for information purposes only and should not be considered a solicitation to buy or sell any security. Neither TheStreet Ratings nor any other party guarantees its accuracy
or makes warranties regarding results from its usage. Redistribution is prohibited without the express written consent of TheStreet Ratings. Copyright(c) 2006-2015. All rights reserved.
Report Date: February 1, 2015
PAGE 3
February 1, 2015
NYSE: KORS
MICHAEL KORS HOLDINGS LTD
Sector: Consumer Goods & Svcs Apparel, Accessories & Luxury Goods Source: S&P
Annual Dividend Rate
NA
Annual Dividend Yield
NA
Consensus EPS Estimates² ($)
IBES consensus estimates are provided by Thomson Financial
1.34
4.18 E
4.88 E
Q3 FY14
2015(E)
2016(E)
Beta
2.00
Market Capitalization
$14.9 Billion
52-Week Range
$65.10-$101.04
Price as of 1/29/2015
$72.53
FINANCIAL ANALYSIS
MICHAEL KORS HOLDINGS LTD's gross profit margin for the second quarter of its fiscal year 2014 is
essentially unchanged when compared to the same period a year ago. The company has grown sales and net
income significantly, outpacing the average growth rates of competitors within its industry. MICHAEL KORS
HOLDINGS LTD is extremely liquid. Currently, the Quick Ratio is 4.17 which clearly shows the ability to cover
any short-term cash needs. The company's liquidity has increased from the same period last year.
At the same time, stockholders' equity ("net worth") has greatly increased by 61.95% from the same quarter
last year. Overall, the key liquidity measurements indicate that the company is very unlikely to face financial
difficulties in the near future.
STOCKS TO BUY: TheStreet Quant Ratings has identified a handful of stocks that can potentially TRIPLE in the
next 12-months. To learn more visit www.TheStreetRatings.com.
INCOME STATEMENT
Net Sales ($mil)
EBITDA ($mil)
EBIT ($mil)
Net Income ($mil)
Q2 FY14
1,056.61
339.62
305.56
206.99
Q2 FY13
740.30
239.52
221.46
145.81
Q2 FY14
1,012.39
2,689.43
0.00
2,245.13
Q2 FY13
618.84
1,707.77
0.00
1,386.30
Q2 FY14
61.05%
32.14%
28.92%
1.45
29.20%
34.98%
Q2 FY13
60.77%
32.35%
29.91%
1.53
29.39%
36.20%
Q2 FY14
6.55
0.00
NA
NA
Q2 FY13
6.17
0.00
NA
NA
Q2 FY14
206
0.00
1.00
10.91
NA
4,065,850
Q2 FY13
204
0.00
0.71
6.80
NA
3,430,569
BALANCE SHEET
Cash & Equiv. ($mil)
Total Assets ($mil)
Total Debt ($mil)
Equity ($mil)
PROFITABILITY
Gross Profit Margin
EBITDA Margin
Operating Margin
Sales Turnover
Return on Assets
Return on Equity
DEBT
Current Ratio
Debt/Capital
Interest Expense
Interest Coverage
SHARE DATA
Shares outstanding (mil)
Div / share
EPS
Book value / share
Institutional Own %
Avg Daily Volume
2 Sum of quarterly figures may not match annual estimates due to
use of median consensus estimates.
This report is for information purposes only and should not be considered a solicitation to buy or sell any security. Neither TheStreet Ratings nor any other party guarantees its accuracy
or makes warranties regarding results from its usage. Redistribution is prohibited without the express written consent of TheStreet Ratings. Copyright(c) 2006-2015. All rights reserved.
Report Date: February 1, 2015
PAGE 4
February 1, 2015
NYSE: KORS
MICHAEL KORS HOLDINGS LTD
Sector: Consumer Goods & Svcs Apparel, Accessories & Luxury Goods Source: S&P
Annual Dividend Rate
NA
Annual Dividend Yield
NA
RATINGS HISTORY
Our rating for MICHAEL KORS HOLDINGS LTD has
not changed since 12/17/2013. As of 1/29/2015, the
stock was trading at a price of $72.53 which is
28.2% below its 52-week high of $101.04 and 11.4%
above its 52-week low of $65.10.
2 Year Chart
HOLD: $61.67
BUY: $82.91
$100
2013
Beta
2.00
Market Capitalization
$14.9 Billion
1
2
3
premium
2014
MOST RECENT RATINGS CHANGES
Date
Price
Action
12/17/13
$82.91
Upgrade
2/14/13
$61.67
Initiated
Price reflects the closing price as of the date listed, if available
RATINGS DEFINITIONS &
DISTRIBUTION OF THESTREET RATINGS
(as of 1/29/2015)
47.87% Buy - We believe that this stock has the
opportunity to appreciate and produce a total return of
more than 10% over the next 12 months.
29.29% Hold - We do not believe this stock offers
conclusive evidence to warrant the purchase or sale of
shares at this time and that its likelihood of positive total
return is roughly in balance with the risk of loss.
22.83% Sell - We believe that this stock is likely to
decline by more than 10% over the next 12 months, with
the risk involved too great to compensate for any
possible returns.
TheStreet Ratings
14 Wall Street, 15th Floor
New York, NY 10005
www.thestreet.com
Research Contact: 212-321-5381
Sales Contact: 866-321-8726
5
1
2
3
4
5
1
2
3
premium
4
5
Price/Sales
1
2
premium
3
4
5
Price to Earnings/Growth
4
5
discount
1
2
3
premium
4
5
discount
KORS 0.64
Peers 4.31
• Discount. The PEG ratio is the stock’s P/E divided
by the consensus estimate of long-term earnings
growth. Faster growth can justify higher price
multiples.
• KORS trades at a significant discount to its peers.
Earnings Growth
1
2
3
4
lower
5
higher
KORS 54.47
Peers 85.60
• Lower. Elevated earnings growth rates can lead to
capital appreciation and justify higher
price-to-earnings ratios.
• However, KORS is expected to significantly trail its
peers on the basis of its earnings growth rate.
Sales Growth
discount
KORS 3.82
Peers 2.82
• Premium. In the absence of P/E and P/B multiples,
the price-to-sales ratio can display the value
investors are placing on each dollar of sales.
• KORS is trading at a significant premium to its
industry.
3
KORS 22.91
Peers 28.29
• Discount. The P/CF ratio, a stock’s price divided by
the company's cash flow from operations, is useful
for comparing companies with different capital
requirements or financing structures.
• KORS is trading at a discount to its peers.
discount
KORS 6.65
Peers 6.82
• Average. A lower price-to-book ratio makes a stock
more attractive to investors seeking stocks with
lower market values per dollar of equity on the
balance sheet.
• KORS is trading at a valuation on par with its peers.
2
premium
discount
KORS 14.86
Peers 29.29
• Discount. A lower price-to-projected earnings ratio
than its peers can signify a less expensive stock or
lower future growth expectations.
• KORS is trading at a significant discount to its
peers.
Price/Book
1
Price/CashFlow
discount
premium
To
Buy
Hold
4
KORS 19.09
Peers 30.41
• Discount. A lower P/E ratio than its peers can
signify a less expensive stock or lower growth
expectations.
• KORS is trading at a significant discount to its
peers.
Price/Projected Earnings
From
Hold
--
Price as of 1/29/2015
$72.53
VALUATION
BUY. The current P/E ratio indicates a significant discount compared to an average of 30.41 for the Textiles,
Apparel & Luxury Goods industry and a value on par with the S&P 500 average of 19.08. For additional
comparison, its price-to-book ratio of 6.65 indicates a significant premium versus the S&P 500 average of 2.69
and a discount versus the industry average of 6.82. The price-to-sales ratio is well above both the S&P 500
average and the industry average, indicating a premium. Upon assessment of these and other key valuation
criteria, MICHAEL KORS HOLDINGS LTD proves to trade at a discount to investment alternatives within the
industry.
Price/Earnings
$75
52-Week Range
$65.10-$101.04
1
2
3
lower
4
5
higher
KORS 49.34
Peers 13.07
• Higher. A sales growth rate that exceeds the
industry implies that a company is gaining market
share.
• KORS has a sales growth rate that significantly
exceeds its peers.
DISCLAIMER:
The opinions and information contained herein have been obtained or derived from sources believed to be reliable, but
TheStreet Ratings cannot guarantee its accuracy and completeness, and that of the opinions based thereon. Data is provided
via the COMPUSTAT® Xpressfeed product from Standard &Poor's, a division of The McGraw-Hill Companies, Inc., as well as
other third-party data providers.
TheStreet Ratings is a division of TheStreet, Inc., which is a publisher. This research report contains opinions and is provided
for informational purposes only. You should not rely solely upon the research herein for purposes of transacting securities or
other investments, and you are encouraged to conduct your own research and due diligence, and to seek the advice of a
qualified securities professional, before you make any investment. None of the information contained in this report constitutes,
or is intended to constitute a recommendation by TheStreet Ratings of any particular security or trading strategy or a
determination by TheStreet Ratings that any security or trading strategy is suitable for any specific person. To the extent any of
the information contained herein may be deemed to be investment advice, such information is impersonal and not tailored to the
investment needs of any specific person. Your use of this report is governed by TheStreet, Inc.'s Terms of Use found at
http://www.thestreet.com/static/about/terms-of-use.html.
This report is for information purposes only and should not be considered a solicitation to buy or sell any security. Neither TheStreet Ratings nor any other party guarantees its accuracy
or makes warranties regarding results from its usage. Redistribution is prohibited without the express written consent of TheStreet Ratings. Copyright(c) 2006-2015. All rights reserved.
Report Date: February 1, 2015
PAGE 5

© Copyright 2026