
CIO Weekly US
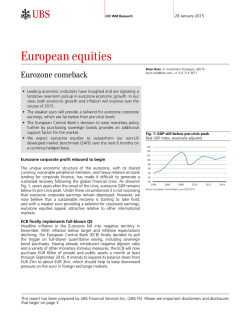
CIO Weekly We welcome your feedback. United States CIO WM Research | 30 January 2015 Top of the Morning daily podcast Deeper dive How does ECB QE compare to its counterparts, and will it work? What we are watching 02 • “Week in Review/Preview“ with Brian Nick, Senior Strategist US economic growth www.ubs.com/topofthemorning Global leading indicators Global central banks03 Dashboard What you need to know – Review 05 “Greek democracy today chose to stop going gently into the night. Greek democracy resolved to rage against the dying of the light.” Yanis Varoufakis, Greece’s new finance minister 1 Left-wing, anti-austerity party Syriza won 149 seats in the fears of a supply glut and weighed on WTI and Brent prices. We expect Brent to drop to USD 40/bbl over the next three months. 300-seat Greek parliament and formed a coalition government with the Independent Greeks, a right-wing party that also opposes 4 The Federal Reserve signaled that it would keep short-term the bailout agreement. Greek equity markets suffered their worst day on record on Wednesday on reports that bank deposit outflows may have interest rates near zero at least until mid-year. It judged “that it can been as high as EUR 11bn in January (equivalent to around 7% of all be patient” before hiking rates, meaning that it is unlikely to act in March household deposits). Greek banks are borrowing some EUR 75bn a or April, but remains open to a move at the June meeting. It upgraded its month in emergency liquidity funding from the assessment of current economic activity, but European Central Bank, but will soon be required added “international developments” (i.e. the rela“CIO believes that Greece to seek more costly assistance from the Central tive strength of the US dollar) as a policy considerBank of Greece when the current bailout packation. The market reaction was somewhat conis unlikely to secure age expires. We believe that Greece is unlikely to fused, with the dollar rallying and equity markets major concessions in the secure major concessions in the upcoming negofalling (indicating a hawkish interpretation), but at tiations, though a euro exit or large default is the same time with government bond yields dropupcoming negotiations, unlikely. For more information please refer to our ping and the market implied “lift-off” date getthough a euro exit or publication “Greece: Syriza wins election.” ting nudged further out into the future. If the Fed large default is unlikely.” does indeed manage to hike rates before year end, it will be flying in the face of actions else2 Russia’s foreign-currency credit rating where in the world. Since the beginning of the year, 13 global central was downgraded by S&P to one notch below investment grade for banks have eased policy, most notably the European Central Bank. the first time in a decade. In response, the Russian government unveiled 60 measures to support the economy and stimulate structural reform, including a RUB 1trn recapitalization of the banking system and a RUB 300bn injection of capital into Vnesheconombank, the state development bank. In other news, EU leaders noted “evidence of [Russia’s] conLevel 1-w chg YTD chg tinued and growing support” for separatists in eastern Ukraine and called Market moves on the EU to consider “further restrictive measures.” With downward S&P 500 2,021 –2.01% –1.73% DJIA 17,417 –2.23% –2.16% pressure on global oil prices ongoing, the ruble fell 9% against the US Nasdaq 4,683 –1.38% –1.05% dollar this week. Which got us thinking … 3 King Abdullah Abdulaziz of Saudi Arabia died last Friday. Crude oil prices temporarily bounced higher on the news. However, the new King Salman announced that he would maintain the policies of his predecessor, causing prices to retreat. News later in the week that US commercial crude oil stocks surged to an 84-year high while domestic production reached a 42-year high heightened ab Nikkei 225 Eurostoxx 50 MSCI EM Gold Brent crude oil US 10-year yield VIX 17,674 3,372 973 $ 1276/oz $ 49.1/bbl 1.751% 18.80 0.93% 1.48% –1.05% –0.86% 1.26% –11bps +2.4pts 1.28% 7.16% 1.77% 6.40% –14.30% –42bps –0.4pts Source: Bloomberg, as of 30 January 2015, EST 4 am This week’s editorial Storm warnings Mike Ryan, CFA, Chief Investment Strategist, Wealth Management Americas 04 This report has been prepared by UBS Financial Services Inc. and UBS AG. Please see important disclaimer on page 9. Sections of this report were originally published outside the US and have been customized for US distribution. Deeper dive 30 January 2015 How does ECB QE compare to its counterparts, and will it work? course, ECB President Mario Draghi left the door open to extending it if inflation expectations have not improved by September 2016. Chris Wright Strategist Last week the European Central Bank’s (ECB) Governing Council launched a historic full-blown quantitative easing (QE) program – a mere six years after the US Federal Reserve and the Bank of England did so. What does the ECB hope to achieve? The ECB’s goal is to “see a sustained adjustment in the path of inflation.” In theory, buying sovereign bonds from the private sector drives down yields, making them less attractive to own; investors will thus be encouraged to move up the risk curve, bringing down the yield on all debt instruments and inflating equity prices. In principle, rising asset prices should create a wealth effect, leading to more spending and less saving; and lower debt costs should boost demand for borrowing, also increasing spending and investment. Additional benefits can be gained from a positive signaling effect, giving confidence to the economy, and from a weaker currency. How big? The ECB’s program, at EUR 1.1trn, is larger than the market was expecting, giving credence to the ECB pledge that it will do “whatever it takes.” However, when compared to the US and UK’s programs as a percent of GDP, it is not even half the size at just 11% (US 25%, UK 22%, although they did begin six years ago). Of Why it might not work Whether QE has been successful in doing this elsewhere is debatable, but its prospects for success in the Eurozone are even more questionable. The potential for a meaningful wealth effect is far smaller than in the US, since financial assets account for just 49% of net household wealth compared to 82% in Tobias Hochstrasser Strategist ECB has plenty of room for catch-up with its QE Central bank balance sheets/GDP, indexed to 100 at January 2007 the US. Also, debt costs are already at rock bottom. While it is true that US government yields were also at all-time lows when the Fed started QE, a 10-year bond still yielded 3%. An equivalent German bond today yields less than 0.4%, and a Portuguese one just 2.5%. In addition, since 85% of lending to non-financial firms in the Eurozone is via bank loans (the figure in the US is half this), lower yields in the public market won’t necessarily feed through to borrowers as fast as they would in the US. There is doubt whether QE has even worked in the US. While US bond yields continued to fall, US GDP has not sustainably accelerated (although one could argue that QE prevented deceleration). Inflation has also not meaningfully picked up outside periods of USD weakness. This raises the question whether the only immediate economic benefit of QE comes from a weaker currency and the “importing” of inflation. Me first, then you After the financial crisis, the only time US inflation climbed over 2% for more than two months was during the Fed’s QE2 program when the dollar weakened almost 10%. The same is true for Japan after Prime Minister Shinzo Abe’s unleashed his Benefits from the wealth effect are likely to be far smaller in the Eurozone Financial assets as a percentage of net household wealth 90% 600 80% 500 70% 60% 400 50% 300 40% 30% 200 20% 100 10% 0 2007 0% 2008 Eurozone 2009 2010 UK 2011 US Source: Thomson Reuters, UBS, as of 29 January 2015 2 CIO WM Research 2012 2013 2014 US Eurozone Japan Source: ECB, Federal Reserve, Open Europe, UBS, as of 29 January 2015 Please see important disclaimer and disclosures at the end of the document. The bottom line / What we are watching substantial QE “arrow.” If the ECB is now trying to do the same, it will take further comfort from OECD data indicating that a 10% fall in the euro will equate to a 0.3% inflation boost in the first year, 0.7% in the second, and 1.0% in the third. The flaw in this strategy is that currency strength is a purely relative game. Not every country can weaken its currency at the same time. And the Eurozone could risk a fallout from its main trading part- 30 January 2015 ners (US, UK, and China) if it persists with such a policy. The theory of time That QE benefits asset owners is a given. And since it is expected to lead to a sustained currency weakening, ECB QE is certainly positive for our overweight of Eurozone equities, half of whose revenue comes from outside the region; it also benefits short EURUSD positions. But it will take time for this program to work. By leaving the door open to extending QE, the ECB appears to be aware of this. Deleveraging in the Eurozone has slowed, and demand for credit is now increasing. By supporting the economy for a sustained period, the ECB hopes to buy the region enough time to complete its recovery. The report, “ECB QE: A Historic Day,” published 22 January has further details. Chris Wright and Tobias Hochstrasser The bottom line The ECB QE program looks large in absolute terms, but is smaller than those of other major central banks relative to GDP. Its immediate benefit to the economy is not obvious due to the realities of the Eurozone credit market. Eurozone QE will weaken the euro, which Preferred investment views Asset Class Most preferred Equities Least preferred •US1 () • US small and mid caps1 () •Eurozone1 () •Transformational technologies2 () • The rising Millennials2 () •E-Commerce • Cancer therapeutics • US capex • Emerging markets Fixed income • • • • • Government bonds • Emerging market corporate bonds • Emerging market sovereign bonds3 () Foreign exchange •USD •GBP US investment grade3 () US high yield3 () Mortgage interest-only US senior loans •EUR •CHF1 () Cash Recent upgrades Recent downgrades 2 3 What we are watching – Preview 1 US employment report. The number of jobs created for the month of January and the unemployment rate are two key indicators that we'll be paying attention to in this report. We'll be looking for any insight into the current state of the US labor market. Alternative investments 1 could boost exports and import inflation into member countries, and it will support the region’s equity market. Changes made on 19 January 2015 Added on 12 January 2015 Changes made on 15 December 2014 For more information, please see the most recent UBS House View: Investment Strategy Guide. Source: UBS CIO WMR, as of 22 January 2015 2 Global leading indicators. Final purchasing managers’ indices for January around the world will be published on 2 February. While the ISM manufacturing index is expected to indicate ongoing robust growth in the US, we expect signs of slowing growth in China and of sluggish growth in the Eurozone. 3 Global central banks. Apart from the Fed, most central banks have recently eased their policies. The next central banks in focus will be the Reserve Bank of Australia on 3 February and the Bank of England on 5 February. 4 Greece. With the election of the Left-wing Syriza party all eyes are on the new administration's negotiations with the Troika. 5 Earnings. 102 S&P 500 companies are reporting earnings next week. As earnings are the key driver of long-term equity returns we'll be watching this data closely. Sections of this report were originally published outside the US on 29 January 2015 and have been customized for US distribution. Recent issues of “Deeper dive” • Who's losing out from the falling oil price? (16 January 2015) • What would surprise us in 2015? (9 January 2015) 3 CIO WM Research • Super bulls, negative rates, oil, Russia, and some potholes: 2014 in review (19 December 2014) • What does falling crude mean for US shale? (5 December 2014) Please see important disclaimer and disclosures at the end of the document. Editorial 30 January 2015 Storm warnings Mike Ryan, CFA Chief Investment Strategist, Wealth Management Americas Most of us in the Northeast spent the early part of this past week hunkering down for what weather channel junkies warned us would be the storm of the century (“storm-ageddon”). Grocery store shelves were stripped of milk, sales of snow shovels surged and cars queued up at gas stations with anxious motorists looking to top off the tank in preparation for a storm that was expected to bring three feet of snow and 50mph winds. Governors in four states across the region declared “states of emergency” and imposed travels bans and curfews. Thousands of flights were cancelled, train service was suspended and the New York City subway system shut down for only the second time in history. While children rummaged around basements for sleighs and boots, the adults of the household surfed through Netflix for season 2 of “House of Cards.” We were ready for the worst…but apparently the storm wasn’t. While eastern Long Island and coastal New England got hit pretty hard (especially Nantucket), most major metropolitan areas in the region were spared. Above ground power lines remained intact, streets were quickly plowed and rail service was quickly restored. What had been advertised as perhaps the worst storm in New York City’s history, probably wouldn’t even have made it into the top three of last year’s winter weather events. Markets seem to have been battling their own storm warnings over the past several weeks. Concerns over the impact of declining energy prices, the Greek national election, corporate earnings season, the Fed’s policy decision and softer than expected economic data have alternatively weighed upon risk assets. While none should be casually dismissed, and all require some sort of preparedness, we see each of these “blowing over” in much the same way that the “non-blizzard” of 2015 did. So let’s assess these storm warnings. Energy prices continued to trend lower this week, with WTI crude reaching a new cyclical low of $44.50. There are those who argue that the precipitous decline in crude prices is a sort of “canary in the coal mine” (no pun intended) reflective of an approaching sharp deceleration in growth. We disagree. While 4 CIO WM Research slackening demand explains some of the drop, much of the decline in energy costs is the result of excess supply. It is our view that the selloff in crude is still a net positive for the US economy, as lower energy costs provide additional support to the consumer – a view that appears to have been corroborated by last week’s consumer sentiment reading. The kick-off to earnings season was accompanied by a somewhat higher level of angst than usual due to the rising dollar and falling energy prices. Although companies that are especially exposed to both the greenback and energy revenues had already been aggressively guiding down expectations for weeks, there was still concern that this could be the quarter that earnings failed to meet market expectations. But with over 50% of the S&P having already reported, those fears now appear to have been overblown. The percentage of companies reporting revenues and profits in excess of expectations has been no worse than average since this expansion began in 2009. Overall earnings growth in Q4 2014 is likely to come in around 6%, which was our estimate coming into reporting season. And early revisions to Q1 2015 earnings are not on a particularly worrying trajectory. Lastly, as we braced for the blizzard last Monday we were greeted with the news that Greek voters had elected a new government led by the SYRIZA party and its new Prime Minister, Alexis Tsipras. Tsipras is expected to demand a renegotiation of the deal Greece struck in 2012 with European policymakers. The so-called Troika provided an aid and debt relief package in exchange for internal reforms and a more austere budget. For many non-Greeks, this renegotiation represents an unwelcome revisiting of the problems that plagued global financial markets from 2010 to 2012. Fortunately, the news’ market impact appears to have been localized to Greek assets. Credit spreads on bonds issued by Italy, Portugal and other European countries, which fluctuated wildly in prior installments of this Greek drama, barely budged this week. While the final negotiations may involve some further tinkering with Greece’s sovereign debt and an easing of reform demands, we assess the probability of Greece leaving the euro area altogether to be quite low, as are the chances that the impact spreads to greater Europe. Of course, we are far from done with this winter, and more storms may be on their way. As investors, we always want make preparations for the worst-case scenario. But while overpreparing for a storm probably leads to nothing more than wasted government resources and an inconvenienced citizenry, over-preparing for a worst-case scenario in your investment portfolio can cause rash decisions resulting in foregone returns. Kind Regards, Mike Ryan Please see important disclaimer and disclosures at the end of the document. Dashboard 30 January 2015 Strategy and performance Cross asset and equities Tactical Asset Allocation Market Returns Asset Classes MTD YTD 2014 Tactical Asset Allocation Market Returns US Equity Sectors Weekly MTD YTD 2014 Equity –0.6% –0.6% 4.4% Cons. Discr. –0.4% –2.0% –2.0% 10.1% Fixed Income –0.4% –0.4% 0.5% Cons. Staples –2.7% 0.8% 0.8% 15.9% Commodities –5.3% –5.3% –17.9% ––– –– underweight – n neutral + ++ +++ overweight Total return indices in USD Note: Indexes used to calculate returns are MSCI All Country World (for Equity), Barclays Capital Global Aggregate Index (for Fixed Income), Dow Jones-UBS Commodity Index Total Return Source: UBS Chief Investment Office/CIO WMR, as of 29 January 2015 Tactical Asset Allocation MTD YTD –2.5% –2.5% –2.5% 21.0% Materials –2.3% –1.4% –1.4% 7.2% 2014 Telecom –3.0% –0.6% –0.6% 2.9% Utilities –1.5% 13.0% Large-Cap Value –2.6% –2.6% 13.9% Large-Cap Growth –0.4% –0.4% 13.6% Mid-Cap –0.2% –0.2% 13.6% Small-Cap –1.2% –1.2% 5.2% 1.0% 1.0% –4.8% 1.8% 1.8% –2.1% – ––– –– underweight n neutral + ++ +++ overweight Total return indices in USD Note: Indexes used to calculate returns are MSCI All Country World (for Equity), Barclays Capital Global Aggregate Index (for Fixed Income), Dow Jones-UBS Commodity Index Total Return Source: UBS Chief Investment Office/CIO WMR, as of 29 January 2015 S&P 500 forecast CIO WMR 6-month rolling price target 2125 2013 earnings per share actual USD 110 2014 earnings per share estimate USD 119 2015 earnings per share estimate USD 127 Source: UBS CIO WMR, as of 29 January 2015 Tactical deviations from benchmark: Scale for charts – Symbol Description/Definition + moderate overweight vs. benchmark ++ overweight vs. benchmark +++ strong overweight vs. benchmark – –– ––– moderate underweight vs. benchmark n Neutral, i.e. on benchmark underweight vs. benchmark strong underweight vs. benchmark Notes This represents the tactical asset allocation for a moderate, taxable investor without alternative investments. Each bar represents a +/- 2% tactical tilt or part thereof (i.e., one bar = 0.5% to 2%, 2 bars = 2.5% to 4%, 3 bars = over 4%). See the latest UBS House View: Investment Strategy Guide for an interpretation of the tactical deviations and an explanation of the corresponding benchmark allocation. Tactical time horizon is approximately six months. Total return market performance is from Bloomberg as of close of business on source date, using representative indices, and is provided for information only. Past performance is no indication of future performance. 5 CIO WM Research –1.4% 2.8% 2.8% 25.3% –1.7% –2.0% –2.0% 10.3% –1.5% Emerging Markets –2.7% –5.4% –5.4% 15.7% Healthcare Industrials US Int’l Developed –3.4% –5.5% –5.5% –6.9% Technology Market Returns Equities Energy Financials 0.9% ––– –– – underweight n neutral + 4.7% 4.7% 29.3% ++ +++ Total return indices in USD overweight Note: S&P 500 Sector Indexes used to calculate returns. Source: UBS CIO WMR, as of 29 January 2015 Tactical Asset Allocation Market Returns International Developed Equities MTD YTD 2014 EMU 1.2% 1.2% –7.8% UK 0.2% 0.2% –4.9% –3.8% Japan 1.8% 1.8% Australia –2.1% –2.1% –2.9% Canada –7.6% –7.6% 2.9% Switzerland 1.3% 1.3% 0.3% NA NA NA Other ––– –– underweight – n neutral + ++ +++ overweight Total return indices in USD Note: MSCI Region or Country Indexes used to calculate returns. Preference in hedged terms (excluding currency movements). Source: UBS Chief Investment Office/WMR, as of 29 January 2015 The overweight and underweight recommendations represent tactical deviations that can be applied to any appropriate benchmark portfolio allocation. They reflect CIO WMR’s assessment of market opportunities and risks in the respective asset classes and market segments. The benchmark allocation is not specified here. Please see the most recent UBS House View: Investment Strategy Guide for definitions/ explanations of benchmark allocation. They should be chosen in line with the risk profile of the investor. Note that the Regional Bond Strategy is provided on an unhedged basis (i.e., it is assumed that investors carry the underlying currency risk of such investments). Thus, the deviations from the benchmark reflect our views of the underlying equity and bond markets in combination with our assessment of the associated currencies. + – Indicates +/– change Terms and Abbreviations EMU = European Monetary Union and is comprised of European countries that have adopted the Euro as their currency, Int’l = international, MTD = month-to-date, USD = US dollar, YTD = year-to-date. Please see important disclaimer and disclosures at the end of the document. Dashboard 30 January 2015 Strategy and performance Fixed income and currencies Tactical Asset Allocation Market Returns Fixed income MTD YTD 2014 Tactical Asset Allocation Market Returns USD Taxable Fixed Income MTD YTD 2014 US 1.8% 1.8% 5.9% Treasuries 2.4% 2.4% 6.0% Government 2.1% 2.1% 4.8% TIPS 2.7% 2.7% 4.5% Municipal 1.7% 1.7% 9.0% Agencies 1.4% 1.4% 4.1% IG Corporates* 2.4% 2.4% 7.4% Agency MBS 0.6% 0.6% 6.1% HY Corporates 0.6% 0.6% 2.5% IG Corporate 2.3% 2.3% 7.5% Int’l Developed –1.9% –1.9% –3.2% HY Corporates 0.7% 0.7% 2.5% Emerging Markets 0.7% 0.7% Preferred Securities 2.0% 2.0% 15.4% – ––– –– underweight n neutral + 3.9% ++ +++ overweight Total return indices in USD Note: Indexes used to calculate returns are Barclays Capital (BarCap) US Aggregate, BarCap US Aggregate Government, BarCap Municipal Bond, BarCap US Aggregate Credit (for IG), BarCap US Aggregate Corp HY, BarCap Global Aggregate ex-USD (for Int’l Developed), BarCap Emerging Markets Government and BarCap Global Emerging Markets USD (50% of each for Emerging Markets). Source: UBS Chief Investment Office/CIO WMR, as of 29 January 2015 Market Returns Tactical Asset Allocation Foreign exchange MTD YTD 2014 NA NA USD NA EUR –6.4% –6.4% –12.3% GBP –3.3% –3.3% –5.6% JPY –1.2% –1.2% 13.9% CHF –7.1% –7.1% 12.0% Other NA ––– –– underweight – + n neutral NA NA ++ +++ overweight Change against USD Source: UBS Chief Investment Office/CIO WMR, as of 29 January 2015 Tactical deviations from benchmark: Scale for charts – Symbol Description/Definition + moderate overweight vs. benchmark ++ overweight vs. benchmark +++ strong overweight vs. benchmark – –– ––– moderate underweight vs. benchmark n Neutral, i.e. on benchmark underweight vs. benchmark strong underweight vs. benchmark Notes This represents the tactical asset allocation for a moderate, taxable investor without alternative investments. Each bar represents a +/- 2% tactical tilt or part thereof (i.e., one bar = 0.5% to 2%, 2 bars = 2.5% to 4%, 3 bars = over 4%). See the latest UBS House View: Investment Strategy Guide for an interpretation of the tactical deviations and an explanation of the corresponding benchmark allocation. Tactical time horizon is approximately six months. Emerging markets comprises corporate and sovereign bonds. In Foreign exchange, other refers to other developed currencies. Total return market performance is from Bloomberg as of close of business on source date, using representative indices, and is provided for information only. Past performance is no indication of future performance. 6 CIO WM Research ––– –– – underweight n neutral + ++ +++ overweight Total return indices in USD Note: Indexes used to calculate returns are Bank of America Merrill Lynch (BoA ML) US Treasury, BoA ML US Inflation-Linked Treasury, BoA ML US Composite Agency, BoA ML US Mortgage Backed Securities, BoA ML US Corporate, BoA ML US High Yield Constrained, BoA ML Fixed Rate Preferred Securities. Source: UBS CIO WMR, as of 29 January 2015 Market Returns Tactical Asset Allocation International Developed Fixed Income MTD YTD 2014 –4.9% –4.9% –2.7% UK 0.7% 0.7% 7.5% Japan 1.5% 1.5% –8.7% NA NA NA EMU Other –– ––– underweight – n neutral + ++ +++ Total return indices in USD overweight Note: BarCap Region or Country Indexes used to calculate returns. Source: UBS Chief Investment Office/CIO WMR, as of 29 January 2015 The overweight and underweight recommendations represent tactical deviations that can be applied to any appropriate benchmark portfolio allocation. They reflect CIO WMR’s assessment of market opportunities and risks in the respective asset classes and market segments. The benchmark allocation is not specified here. Please see the most recent UBS House View: Investment Strategy Guide for definitions/ explanations of benchmark allocation. They should be chosen in line with the risk profile of the investor. Note that the Regional Bond Strategy is provided on an unhedged basis (i.e., it is assumed that investors carry the underlying currency risk of such investments). Thus, the deviations from the benchmark reflect our views of the underlying equity and bond markets in combination with our assessment of the associated currencies. The scale above does not pertain to the USD taxable fixed income table. The symbols in that table describe varying degrees of preference in a USD taxable fixed income portfolio. + – Indicates +/– change Terms and Abbreviations EMU = European Monetary Union and is comprised of European countries that have adopted the Euro as their currency, HY = high yield, Int’l = international IG = investment grade, MBS = mortgage-backed securities, MTD = month-to-date, USD = US dollar, YTD = year-to-date. Please see important disclaimer and disclosures at the end of the document. Dashboard 30 January 2015 Earnings calendar The Earnings Calendar provides publicly announced reporting dates and times of companies covered by Wealth Management Research Americas. Reporting dates and times are subject to change by the reporting companies. Date Company Ticker Company Ticker Company Ticker 2-Feb-2015 Alexandria Real Estate Equities, Inc. ARE American Capital Agency Corp. AGNC Anadarko Petroleum Corp. APC 2-Feb-2015 EastGroup Properties, Inc. EGP Exxon Mobil Corp. XOM UDR, Inc. UDR 3-Feb-2015 Aetna, Inc. AET Aflac, Inc. AFL Airgas, Inc. ARG 3-Feb-2015 Annaly Capital Management, Inc. NLY CBL & Associates Properties, Inc. CBL Centene Corp. CNC 3-Feb-2015 Emerson Electric Co. EMR Equity Residential EQR Ford Motor Co. F 3-Feb-2015 Gannett Co., Inc. GCI Gilead Sciences, Inc. GILD McGraw Hill Financial, Inc. MHFI 3-Feb-2015 The Walt Disney Co. DIS United Parcel Service, Inc. UPS W.R. Berkley Corp. WRB 3-Feb-2015 Wisconsin Energy Corp. WEC 4-Feb-2015 Boston Scientific Corp. BSX Cincinnati Financial Corp. CINF CVS Health Corp. CVS 4-Feb-2015 Essex Property Trust, Inc. ESS General Motors Co. GM Humana, Inc. HUM 4-Feb-2015 Marathon Petroleum Corp. MPC Merck & Co., Inc. MRK Prudential Financial, Inc. PRU 4-Feb-2015 Suncor Energy, Inc. SU The Allstate Corp. ALL The Clorox Co. CLX 4-Feb-2015 The Southern Co. SO Two Harbors Investment Corp. TWO Under Armour, Inc. UA 4-Feb-2015 Yum! Brands, Inc. YUM 5-Feb-2015 Apartment Investment & Management Co. AIV Apollo Global Management LLC APO Cigna Corp. CI 5-Feb-2015 CME Group, Inc. CME Costco Wholesale Corp. COST Dunkin' Brands Group, Inc. DNKN 5-Feb-2015 Entergy Corp. ETR Estee Lauder Cos., Inc. EL Home Loan Servicing Solutions Ltd. HLSS 5-Feb-2015 Home Properties, Inc. HME Intercontinental Exchange, Inc. ICE Kimco Realty Corp. KIM 5-Feb-2015 McKesson Corp. MCK Philip Morris International, Inc. PM Piedmont Office Realty Trust, Inc. PDM 5-Feb-2015 Post Properties, Inc. PPS PPL Corp. PPL 6-Feb-2015 Dominion Resources, Inc. D Marsh & McLennan Cos., Inc. MMC Source: Bloomberg, UBS, as of 29 January 2015 7 CIO WM Research Please see important disclaimer and disclosures at the end of the document. Dashboard 30 January 2015 Key economic indicators Date Indicator Period Time (ET) Unit Consensus Previous 02-Feb-15 Personal Income December 8:30 AM m/m 0.2% 0.4% 02-Feb-15 Personal Spending December 8:30 AM m/m –2.0% 0.6% 02-Feb-15 Construction Expenditures December 10:00 AM m/m 0.7% –0.3% 03-Feb-15 Factory Orders December 10:00 AM m/m –2.0% –0.7% 03-Feb-15 Light Vehicle Sales January level 16.85mn 16.8mn 04-Feb-15 ADP Employment Report January 8:15 AM change 220k 241k 04-Feb-15 Nonmanufacturing ISM January 10:00 AM level 56.5 56.5 05-Feb-15 Jobless Claims For week, 31 January 8:30 AM level 300k 265k 05-Feb-15 Trade Balance December 8:30 AM level –$38.0bn –$39.0bn 05-Feb-15 Nonfarm Business Productivity 4Q 2014 8:30 AM q/q 0.9% 2.3% 05-Feb-15 Unit Labor Costs 4Q 2014 8:30 AM q/q 1.0% –1.0% 06-Feb-15 Nonfarm Payrolls January 8:30 AM m/m 231k 252k 06-Feb-15 Private Payrolls January 8:30 AM m/m 222k 240k 06-Feb-15 Unemployment Rate January 8:30 AM level 5.6% 5.6% 06-Feb-15 Average Hourly Earnings January 8:30 AM m/m 0.3% –0.2% 06-Feb-15 Average Weekly Hours January 8:30 AM level 34.6 34.6 06-Feb-15 Consumer Credit December 3:00 PM level $15.0bn $14.1bn Source: Bloomberg, UBS, as of 29 January 2015 UBS forecast estimates are published on Friday evenings in Economic Perspectives by economists employed by UBS Investment Research, a part of UBS Investment Bank. m/m = month-over-month, q/q = quarter-over-quarter, k = thousand, bn = billion, y/y = year-over-year, mn = million 8 CIO WM Research Please see important disclaimer and disclosures at the end of the document. Appendix 30 January 2015 Investing in Emerging Markets Investors should be aware that Emerging Market assets are subject to, amongst others, potential risks linked to currency volatility, abrupt changes in the cost of capital and the economic growth outlook, as well as regulatory and sociopolitical risk, interest rate risk and higher credit risk. Assets can sometimes be very illiquid and liquidity conditions can abruptly worsen. WMR generally recommends only those securities it believes have been registered under Federal U.S. registration rules (Section 12 of the Securities Exchange Act of 1934) and individual State registration rules (commonly known as “Blue Sky” laws). Prospective investors should be aware that to the extent permitted under US law, WMR may from time to time recommend bonds that are not registered under US or State securities laws. These bonds may be issued in jurisdictions where the level of required disclosures to be made by issuers is not as frequent or complete as that required by US laws. For more background on emerging markets generally, see the WMR Education Notes, “Emerging Market Bonds: Understanding Emerging Market Bonds,” 12 August 2009 and “Emerging Markets Bonds: Understanding Sovereign Risk,” 17 December 2009. Investors interested in holding bonds for a longer period are advised to select the bonds of those sovereigns with the highest credit ratings (in the investment grade band). Such an approach should decrease the risk that an investor could end up holding bonds on which the sovereign has defaulted. Sub-investment grade bonds are recommended only for clients with a higher risk tolerance and who seek to hold higher yielding bonds for shorter periods only. Disclaimer Chief Investment Office (CIO) Wealth Management (WM) Research is published by UBS Wealth Management and UBS Wealth Management Americas, Business Divisions of UBS AG (UBS) or an affiliate thereof. CIO WM Research reports published outside the US are branded as Chief Investment Office WM. In certain countries UBS AG is referred to as UBS SA. This publication is for your information only and is not intended as an offer, or a solicitation of an offer, to buy or sell any investment or other specific product. The analysis contained herein does not constitute a personal recommendation or take into account the particular investment objectives, investment strategies, financial situation and needs of any specific recipient. It is based on numerous assumptions. Different assumptions could result in materially different results. We recommend that you obtain financial and/or tax advice as to the implications (including tax) of investing in the manner described or in any of the products mentioned herein. Certain services and products are subject to legal restrictions and cannot be offered worldwide on an unrestricted basis and/or may not be eligible for sale to all investors. All information and opinions expressed in this document were obtained from sources believed to be reliable and in good faith, but no representation or warranty, express or implied, is made as to its accuracy or completeness (other than disclosures relating to UBS and its affiliates). All information and opinions as well as any prices indicated are current only as of the date of this report, and are subject to change without notice. Opinions expressed herein may differ or be contrary to those expressed by other business areas or divisions of UBS as a result of using different assumptions and/or criteria. At any time, investment decisions (including whether to buy, sell or hold securities) made by UBS AG, its affiliates, subsidiaries and employees may differ from or be contrary to the opinions expressed in UBS research publications. Some investments may not be readily realizable since the market in the securities is illiquid and therefore valuing the investment and identifying the risk to which you are exposed may be difficult to quantify. UBS relies on information barriers to control the flow of information contained in one or more areas within UBS, into other areas, units, divisions or affiliates of UBS. Futures and options trading is considered risky. Past performance of an investment is no guarantee for its future performance. Some investments may be subject to sudden and large falls in value and on realization you may receive back less than you invested or may be required to pay more. Changes in FX rates may have an adverse effect on the price, value or income of an investment. This report is for distribution only under such circumstances as may be permitted by applicable law. Distributed to US persons by UBS Financial Services Inc., a subsidiary of UBS AG. UBS Securities LLC is a subsidiary of UBS AG and an affiliate of UBS Financial Services Inc. UBS Financial Services Inc. accepts responsibility for the content of a report prepared by a non-US affiliate when it distributes reports to US persons. All transactions by a US person in the securities mentioned in this report should be effected through a US-registered broker dealer affiliated with UBS, and not through a non-US affiliate. The contents of this report have not been and will not be approved by any securities or investment authority in the United States or elsewhere. UBS specifically prohibits the redistribution or reproduction of this material in whole or in part without the prior written permission of UBS and UBS accepts no liability whatsoever for the actions of third parties in this respect. Version as per May 2014. © UBS 2015. The key symbol and UBS are among the registered and unregistered trademarks of UBS. All rights reserved. 9 CIO WM Research Please see important disclaimer and disclosures at the end of the document.


© Copyright 2026