
UBS House View: On icy roads.
UBS HouseView Investment Strategy Guide February 2015 On icy roads Also inside In Context: Spreading the wealth In Focus: The Decade Ahead: In front of the curve US Edition CIO Wealth Management Research CONTENTS A MESSAGE FROM THE REGIONAL CIO TACTICAL PREFERENCES 1 FEATURE 2 On icy roads by Mark Haefele IN CONTEXT 7 Spreading the wealth by Mike Ryan PREFERRED INVESTMENT VIEWS 8 MONTH IN REVIEW 9 AT A GLANCE 9 GLOBAL ECONOMIC OUTLOOK 10 ASSET CLASSES OVERVIEW 12 Equities Fixed income Commodities Foreign exchange IN FOCUS 18 The Decade Ahead: In front of the curve by Stephen Freedman and Andrea Fisher TOP THEMES 20 Liability optimization The rising Millennials Transformational technologies KEY FORECASTS 22 DETAILED ASSET ALLOCATION 23 PERFORMANCE MEASUREMENT 31 APPENDIX 34 PUBLICATION DETAILS 38 Dear reader, In our “CIO Year Ahead” publication we argued that 2015 would be marked by continued divergence in global economic and policy outlooks, greater dispersion of returns within and across asset classes and increased volatility in financial markets. Although we are barely a month into the New Year, each of these themes has already begun to play out in fairly dramatic fashion. In this month’s Feature article, we offer some perspective on how to navigate this increasingly challenging investment backdrop. Although it remains our view that sharply lower oil prices are a net positive for global growth, the negative effects on commodity producers and dampening impact on inflation have tended to dominate in the near term. Meanwhile, the Swiss National Bank’s surprise decision to sever the franc’s peg to the euro, coupled with the European Central Bank’s long-anticipated move to embrace quantitative easing, suggests central banks will continue to impact investment outcomes in 2015. But while we retain our pro-risk portfolio stance, we have looked to “spread the wealth” a bit by reducing our dependence on the US. The combination of a weaker euro, lower oil prices, improving bank credit conditions, easing sovereign-crisis fears, and a more expansive monetary policy represents a fairly strong tailwind for both the Eurozone economy and equity markets. While there have been more than a few “false dawns” for Europe over the past several years, we view the current environment as more sustainable. In our Focus article, we set our sights a bit longer and discuss the most recent “refresh” of our Decade Ahead themes. By focusing on a multivariate set of structural drivers, we seek to identify the sorts of themes that we believe will have a meaningful impact on wealth opportunities over the next decade. We highlight three of these themes this month: rising millennials; transformational technologies; and liability optimization. While the first two focus on how best to grow the asset side of the balance sheet, the last addresses how best to manage the liability side. So whether your focus is set on the year ahead or on the Decade Ahead, there is something for you in this month’s report. Enjoy! This report has been prepared by UBS Financial Services Inc. (“UBS FS”) and UBS AG. Please see important disclaimers and disclosures beginning on page 35. 2 UBS HOUSE VIEW FEBRUARY 2015 Mike Ryan, CFA Chief Investment Strategist, WMA Regional CIO, Wealth Management US TACTICAL ASSET ALLOCATION Tactical preferences With US growth remaining solid and central banks still providing plenty of liquidity, we continue to recommend a preference for equities over bonds. We prefer US over foreign stocks and high yield to government bonds. e om c n di e x Fi v’t Go Int’l Developed Emerg Markets i Mark ng ets US HY Corp Tot al US Mid cap EUR US Large cap Value GBP Asset Classes Tactical asset allocation al Tot CHF cap Large th w o r G JPY sh Ca tal To Oth er ities u q E US hange ign exc Fore USD US Small cap l ta To Int’ Dev l Ma elope rke d ts Em Ma ergi rke ng ts US Com mo dit ies nal itio rad nt No tal To uni US M US IG Corp THIS MONTH 1) Equities We upgrade international developed markets to overweight and trim US equities. 2) Fixed income We prefer high yield corporate and investment grade credit to Treasuries and emerging debt. 3) Foreign exchange We close our preference for the Canadian dollar over the Swiss franc. LEGEND Overweight: Tactical recommendation to hold more of the asset class than specified in the moderate risk strategic asset allocation (see page 23) Underweight: Tactical recommendation to hold less of the asset class than specified in the moderate risk strategic asset allocation (see page 23) Neutral: Tactical recommendation to hold the asset class in line with its weight in the moderate risk strategic asset allocation (see page 23) There has been a change in the methodology for displaying the overweight and underweight recommendations since the 21 November 2015 edition of “UBS House View.” As of this publication, each bar represents a +/- 2% tactical tilt or part thereof (i.e., one bar = 0.5% to 2%, 2 bars = 2.5% to 4%, 3 bars = over 4%). NOTE: TACTICAL TIME HORIZON IS APPROXIMATELY SIX MONTHS FEBRUARY 2015 UBS HOUSE VIEW 1 On icy roads Global markets have served up an avalanche of events in 2015, from a plunging oil price and euro, to rallying government bonds, to the removal of the Swiss franc floor. The diverging world brings into focus why maintaining a long-term and disciplined approach to investment is so important. Mark Haefele Global Chief Investment Officer Wealth Management By following the key tenets of diversification, rebalancing and considered asset-class selection, CIO portfolios were only marginally impacted by the recent turmoil. We believe the underlying environment of low oil prices, low government bond yields, and improving economic growth should continue to provide a supportive backdrop for global equities. If you start to slide on icy roads, make sure you keep looking ahead to where you want to go. That was the advice my father gave me many years ago. I was reminded of it again in the first week of January as unusually snowy weather blanketed Zurich. But the slippery conditions have extended beyond the Swiss streets. Global markets have already served up an avalanche of events in 2015, from a plunging oil price and euro, to rallying government bonds, to a dramatic change in gears by the Swiss National Bank (SNB) that shifted the franc sharply higher. Those of you who read our CIO Year Ahead: The Diverging World will know that divergences in policy could drive a year of higher volatility and greater dispersion in asset prices. Still, January’s blizzard of news surpassed expectations. The diverging world brings into focus why maintaining a long-term and disciplined approach to investment is so important. To our minds this means following the principles of diversification, rebalancing and considered asset-class selection. I am pleased that by following these key tenets, CIO portfolios were only marginally impacted by the recent turmoil. From a shorter-term tactical perspective, the European Central Bank’s (ECB) recently enhanced quantitative easing (QE) program is the latest confirmation that the SNB’s decision does not reflect a wider shift among central banks to reverse their policies. We believe the underlying environment of low oil prices, low government bond yields, and improving economic growth (in developed markets in particular) should continue to provide a supportive backdrop for global equities. This diverging world is posing challenges, but it will also offer opportunities to generate returns. By focusing on the road ahead, we can find the best way to navigate forward. Looking ahead All eyes are on Europe. Last week’s SNB decision, the announcement of quantitative easing by the ECB on 22 January, and the upcoming Greek election mean that European markets will likely be setting the tone for global risk appetite in the weeks ahead. 2 UBS HOUSE VIEW FEBRUARY 2015 FEATURE >> The ECB has finally found a genuine means of expanding its balance sheet I’ll begin with the announcement from the ECB. President Mario Draghi has pledged to purchase EUR 60bn of investment grade-rated securities each month until September 2016. There is also the option to extend the program if the inflation outlook hasn’t improved by then. Some of you may recall my letter from last year entitled Draghi’s Dominoes where I looked at the three “dominoes” that needed to fall before we can see sustained growth in the Eurozone. The first one – the ECB finding a genuine means of expanding its balance sheet (see Fig.1) – has now fallen. >> QE will pressure the euro, and provide a tailwind for Eurozone equities We recently upgraded Eurozone equities to overweight. While the market’s preliminary reaction to Draghi’s plan has only provided a marginal boost, we believe a sustained bout of QE will continue to pressure the euro, and also provide another tailwind for Eurozone equities. European growth may still be weak, but European firms now enjoy an enviable combination of a highly competitive currency, falling energy prices, and record low government bond yields. >> A default in Greece is unlikely As ever, political discord is causing apprehension; this time, it’s the Greek election. We think the chance of Greece “diverging” its way out of the Eurozone is low. Greece does not face large interest payments to the private sector in the months ahead, with just EUR 0.6bn due on 24 February. So, based on Greece’s reported cash balance, a default is unlikely. Other creditors, like the ECB and the International Monetary Fund, should be willing to let the Greek political process play out. Furthermore, both of the leading Greek political parties have reiterated their commitment to the euro in recent weeks. Meanwhile, the dust is still settling after the SNB’s dramatic about-turn decision to abandon the CHF 1.20 per euro minimum exchange rate. Two of the tactical asset allocation positions that we have been recommending to global investors – an overweight in Swiss equities and an underweight in the Swiss franc – have been negatively affected. >> Swiss franc strength will damage the prospects for Swiss equities From here, the franc’s strength will undoubtedly damage the prospects for Swiss equities, which we downgraded to neutral. Swiss corporate earnings, which consensus forecasts had Fig. 1: The ECB balance sheet will grow once again ECB balance sheet (EUR, bn) 3500 3000 2500 2000 1500 Jan 15 Jul 14 Jan 14 Jul 13 Jan 13 Jul 12 Jan 12 Jul 11 Jan 11 Jul 10 1000 Jan 10 >> The ECB has announced it will buy EUR 1.2 trillion of bonds over 20 months Source: Bloomberg, UBS, as of 22 January 2015 FEBRUARY 2015 UBS HOUSE VIEW 3 FEATURE seen rising 10–12% in 2015, are now likely to decline by 5–7%. Within Swiss equities, a low-yield environment should at least prove supportive for those companies that can grow their dividends despite the strength of the franc. With respect to the currency, we retain an underweight position in the Swiss franc. We believe that the franc is overvalued at current levels, and government bond yields with a tenor as long as almost 15 years have a negative yield. That said, we note that in the near term its perception as a “safe-haven” could attract flows into the currency, and we have therefore halved the size of our underweight position. >> The outlook is improving for UK equities Elsewhere, we believe the outlook is also starting to brighten for UK equities. While the British pound has been rising against the euro, it has also been falling against the US dollar. Since British-listed companies earn a greater share of their revenues in dollars than in euros, the level of sterling is turning from a curse into a blessing for the UK market. We therefore closed our underweight position in UK equities. While the stormiest market news of late has been concentrated in Europe, this has not meant lower volatility globally. It’s worth remembering that last year the S&P500 ended January down more than 3%, only to enjoy approximately 14% total return for the year. So, while this year’s start says little about where we are going to end, we still don’t expect it to be a smooth ride. >> Lower oil prices should be positive for US equities and the US economy Fundamentally, we still believe that a lower oil price will be positive for US equities and the economy (see Fig.2), even if weak recent retail sales figures suggest it has been slow to filter through to consumer spending. We remain confident in our overweight position in US equities, and expect the market to end the year up around 7–8%. We also remain overweight in US high yield (HY) credit. The credit market is exposed to oil prices, with 13% of the US HY index in the energy sector. But with energy sector spreads now implying a default rate of 10% over the next 12 months, we believe risks are priced in. Bearing in mind the potential for sector consolidation and cost cutting, we believe the current yield pickup over government bonds of approximately 540 basis points is attractive. Fig. 2: Low US gasoline prices should boost consumer spending US average unleaded gasoline price (USD per gal) 4.5 4.0 3.5 >> US gasoline prices are at a six-year low 3.0 2.5 2.0 1.5 Source: Bloomberg, as of 22 January 2015 4 UBS HOUSE VIEW FEBRUARY 2015 Jan 15 Jul 14 Jan 14 Jul 13 Jan 13 Jul 12 Jan 12 Jul 11 Jan 11 Jul 10 Jan 10 1.0 FEATURE The decline in oil is also likely to be firmly on the radar at the Federal Reserve, which formally begins its 2015 meetings next week. It is worth noting that central banks across the world, from the Bank of Canada to the Bank of England, have been growing more dovish thanks to lower headline inflation prints. In theory, they should ignore the impact of lower energy prices, but this has not proved to be the case for many so far. So while we do not expect any major policy shift at the Fed meeting, we will be listening closely for the committee’s response to the impact of energy prices on inflation, as well as the rapid decline in market-implied medium-term inflation expectations, the reason for which remains something of a mystery. >> Interest rate cuts in China should cushion the slowdown in growth Finally, volatility has also been elevated in China, and the onshore equity market is continuing its speculative gyrations. Against this backdrop, UBS recently hosted our Greater China Conference in Shanghai. Sentiment there was that, regardless of what the onshore market does, Chinese growth is clearly likely to be slower this year than last, but the question remains by how much. We think the government’s interest rate cuts will prevent the kind of slowdown that would shock the global growth story. More broadly in emerging markets (EM), we maintain an underweight position in EM equities and in EM US dollar-denominated bonds. While EM equities trade on a hefty, approximately 30% discount to developed markets, we don’t think this valuation gulf is likely to close any time soon. Emerging markets in general continue to face headwinds such as declining commodity prices, a stronger US dollar, slowing growth in China, and difficult business conditions in Brazil and Russia. >> A disciplined investment process is crucial in a diverging world Driving discipline As recent events have shown, sticking to a disciplined investment process is more important in the diverging world. The following are the most important principles that have driven our longer-term portfolio performance: >> Portfolios should be well diversified First, remain well diversified. Individual price moves have gotten larger as consensus expectations have narrowed and policies diverge. For investors seeking to sidestep uncompensated volatility, it will be critical that they avoid overexposure to any individual asset, asset class, or region. They should also consider diversifying into alternatives where we have recently increased allocations. >> Portfolios should be rebalanced regularly and systematically Second, rebalance portfolios regularly and systematically. A disciplined approach to rebalancing a portfolio toward a target allocation allows investors to systematically “buy on dips” and “take profits” without falling into behavioral traps that often lead even professional investors to buy too late or sell out at the bottom. Finally, seek the shorter-term opportunities on offer in our diverging world, but do so in a measured way, keeping the primary focus on the long term. Investors trying to avoid skidding off the road will need to adhere to the basic principles of long-term asset allocation: diversification, rebalancing, and careful risk management. When looking to the road ahead, these principles are likely to prove essential. FEBRUARY 2015 UBS HOUSE VIEW 5 FEATURE Final note I write to you from the World Economic Forum in Davos, where policymakers and business leaders have gathered to consider the new global context and the possible long-term drivers of the world economy. I, along with UBS colleagues from the Investment Bank and Asset Management, have contributed to a White Paper exploring the potentially transformative impact of changes in energy, environmental, and technological policy on the world in the years ahead. For those of you who are interested, I hope you find it a thought-provoking read. It is available at ubs.com/followubs. Mark Haefele Global Chief Investment Officer Wealth Management 6 UBS HOUSE VIEW FEBRUARY 2015 IN CONTEXT Perspective from the Regional Chief Investment Officer – US Spreading the wealth Mike Ryan Regional Chief Investment Officer Wealth Management US While the term “spreading the wealth” is typically associated with either redistributive tax policies or philanthropic activities, we instead want investors to consider it in the context of making asset allocation decisions. For much of 2014, we maintained a strong domestic preference with overweight to the dollar, US equities, and US credit. It was our view that an improving US economy, gradual “tapering” of Fed bond purchases, and solid earnings growth would both support risk assets in the US and lead to a further strengthening of the greenback. With the exception of our high yield call, those positions tended to work out well for investors last year. While we continue to favor US assets in 2015, we believe it now makes sense to reduce our dependence on domestic positions and look to “spread the wealth” a bit more globally. > While emerging markets might appear cheap on the surface, subdued growth momentum will continue to pressure earnings, at the same time that tighter Fed policy weighs upon currencies. Keep in mind that US equity valuations continued to rise in 2014 amid an improving cyclical backdrop, still-supportive policy approach, and continued a benign interest-rate environment. The S&P 500 currently trades at just over 16 times earnings – about one full multiple-point above the 50-year average. Although not necessarily expensive from a historical perspective, US stocks are now more “fully valued,” which suggests gains from here will be more measured and driven largely by earnings growth. We therefore opted to trim our overweight to US equities. The dilemma, of course, is where else in the world do we shift those funds? At first blush, emerging markets (EM) might seem a potentially good candidate. After having significantly underperformed developed market equities over the past two years, EM now trade at about a 27% discount to developed markets and are among the “least loved” asset classes among institutional investors. But while EM might appear cheap on the surface, subdued growth momentum will continue to pressure earnings, at the same time that tighter Fed policy weighs upon currencies. This suggests that prosepects for returns within the emerging market space will once again underwhelm. We therefore turned our attention – and our affections – toward Europe. It’s true that Eurozone equities also badly lagged the US market in 2014, as hopes for a longawaited economic recovery failed to materialize and deflationary pressures intensified. Meanwhile, the approach of the Greek elections threatened to cast fresh doubts over the longer-term viability of the Eurozone while the lack of consensus among policymakers has repeatedly hamstrung the best intentions of the European Central Bank. So what’s so different this time around? First off, the macro backdrop has brightened amid the combination of a weak euro, lower oil prices, and an improvement in bank lending conditions. This, in turn, should lead to stronger earnings growth for Eurozone-domiciled companies. Second, and perhaps of even greater importance, is the shift in policy by the ECB. As we point out in this month’s Feature article, quantitative easing represents both a significant tailwind for Eurozone equity markets and a tacit admission that European policymakers are finally prepared to act in tandem. Mike Ryan, CFA FEBRUARY 2015 UBS HOUSE VIEW 7 PREFERRED INVESTMENT VIEWS As of 22 January 2015 Asset Class Most preferred Least preferred Equities •US1 () • US small and mid caps1 () •Eurozone1 () • Transformational technologies2 () • The rising Millennials2 () •E-Commerce • Cancer therapeutics • US capex • Emerging markets Bonds • US investment grade3 () • US high yield3 () • Mortgage interest-only • US senior loans • Government bonds • Emerging market corporate bonds • Emerging market sovereign bonds3 () Foreign exchange •USD •GBP •EUR •CHF1 () Alternative investments Cash Recent upgrades Recent downgrades Changes made on 19 January 2015 Added on 12 January 2015 3 Changes made on 15 December 2014 1 2 8 UBS HOUSE VIEW FEBRUARY 2015 MONTH IN REVIEW At a glance Economy Adjusted 3Q14 GDP levels in the US exceeded expectations, and January’s consumer confidence report reached an 11-year high. Nevertheless, uncertainty remains as the Fed changed its tune from taking “considerable time” in raising rates to “be(ing) patient.” In the interim, Fed Chair Janet Yellen encouraged investors that the drop in energy prices would be a net positive for the economy. Global economic growth is set to accelerate in 2015 compared to 2014. The US is expected to contribute the most to this acceleration, as it should see its economy expand by more than 3% – the fastest pace since the financial crisis. We also foresee increasing economic growth in the Eurozone, albeit on a much lower level of around 1%. Fiscal headwinds are fading, credit conditions are gradually improving, and the ECB’s expansionary monetary policy will lend further support. The strong fall in oil prices since mid-2014 is an additional positive driver for both US and Eurozone growth. Emerging economies are expected to experience a further gradual deceleration of growth. Russia and Brazil look particularly weak given their lack of reform momentum. In a surprising move, the Swiss National Bank abandoned the floor on the Swiss franc, freeing the euro exchange rate that had been constrained since 2011. The euro immediately plunged, adding to the drop in prior weeks after ECB President Mario Draghi stated that the ECB was “making technical preparations” for a potential start to quantitative easing in 2015. Tensions around a “Gre-exit” remain high as Greece failed to confirm the presidential nominee, forcing a snap election at the end of January. Elsewhere in Europe, Spain shows slow recovery as solvency is restored, but the outlook remains cautious as the biggest risk lies in upcoming elections. US equities outperformed most other regions in 2014, with a total return of 13.5%, and we expect them to keep up their momentum in the months to come. Positive drivers – most important, solid earnings growth of around 7% and a robust economic backdrop – will likely remain in place. Swiss earnings face massive headwinds following the strong appreciation of the Swiss franc, and are therefore no longer attractive, in our view. We are neutral Swiss equities. We believe the underperformance of UK equities that we saw in 2014 has come to an end, and we upgrade the market to neutral. In the Eurozone, accelerating economic growth and a weaker euro should support earnings in 2015. We therefore introduced an overweight in Eurozone equities. The oil market remains shaky as prices continue to hit new lows, and OPEC has not indicated any intention to cut production. Crude indexes rallied slightly after hitting the USD 45 per barrel low, as new buyers entered the market. In Asia, the Indian central bank surprised investors by cutting rates for the first time in two years as inflationary worries had eased. Equities Fixed income The strength of the US economy will allow the Fed to hike policy rates in the second half of 2015, leading to gradually rising US Treasury yields. In the Eurozone, monetary policy easing, low inflation,and modest economic growth will keep rates very low. The low starting level of yields will likely lead to low returns on government bonds in the next six months. In particular, government bonds in euros or Swiss francs provide very limited upside. We therefore prefer positions in investment grade corporate bonds, offering a yield pickup. Fundamentals in emerging markets (EMs) have deteriorated further and we are holding underweights in EM corporate and government bonds against US high yield, which is pricing in a substantial pickup in default rates in the large energy sector. Foreign exchange The US dollar remains our favorite currency, and we hold an overweight relative to the euro as the divergence in growth rates, monetary policy, and bond yields favor the US currency. The surprising decision by the Swiss National Bank to suspend the exchange rate floor against the euro has led to an extreme appreciation of the Swiss franc, and we expect EURCHF to trade close to parity in the coming six months. We are overweight GBPCHF as we expect the Bank of England to raise policy rates in the second half of the year, which stands in stark contrast to the negative rates offered in Switzerland. With oil prices having fallen further over recent weeks, we remove our Canadian dollar overweight against the franc. FEBRUARY 2015 UBS HOUSE VIEW 9 KEY FINANCIAL MARKET DRIVERS Global economic outlook Thomas Berner, CFA; Ricardo Garcia, CFA; Gary Tsang Global growth is on the mend. The US economy continued to show very strong growth, with real consumption accelerating toward annualized 4% in 4Q14, in part fueled by lower energy prices. In Japan and China, growth indicators stabilized somewhat and in some cases even accelerated, while Eurozone growth surprises continued to disappoint on balance. But with the ECB launching an enhanced quantitative easing program of EUR 1.14trn that will include sovereign bond purchases, the outlook in the euro bloc has brightened. Overall, we feel more confident that global real GDP growth can reach our 3.5% target this year. Robust US expansion Thomas Berner, CFA CIO VIEW Probability: 70% Robust expansion We expect US growth to remain robust, driven by stronger private-sector demand. Inflation will likely rise toward the Fed’s target of 2% over the next six months. We expect the first Fed rate hike in mid-2015 at the earliest and the pace of tightening to be gradual. POSITIVE SCENARIO Probability: 15% Strong expansion US real GDP growth accelerates to around 4%, propelled by an expansive monetary policy, a more rapidly fading fiscal drag, improved business and consumer confidence, strong housing investment, and subsiding risks of a China hard landing and Russia-Ukraine tensions. The Fed raises policy rates sooner than mid-2015. NEGATIVE SCENARIO Probability: 15% à Growth recession US growth momentum fades as Fed stimulus is curtailed, the Eurozone crisis reescalates, China’s growth decelerates significantly, or Russia-Ukraine geopolitical tensions intensify. Real GDP growth deteriorates, raising the fiscal deficit and leading to another round of bond purchases by the Fed. 10 UBS HOUSE VIEW FEBRUARY 2015 Eurozone recovery to accelerate Ricardo Garcia, CFA CIO VIEW Probability: 60% Improving economic momentum We expect economic momentum to improve in 1H15. The fall in oil prices has pushed the inflation outlook much lower. The expansionary policy of the ECB is expected to support the economic acceleration going forward. POSITIVE SCENARIO Probability: 20% Strong growth and fiscal stabilization Oil prices and the euro decline more than expected, with loan demand and the economy recovering faster than envisaged. France and Italy follow a credible reform path and speed up fiscal consolidation. Political risks fade further. NEGATIVE SCENARIO à Probability: 20% Shock Disappointing growth and weak inflation rattle bank bonds; the Eurozone slips into a deflation spiral; ruling on OMT severely limits ECB asset purchases; political uncertainty rises sharply due to the Ukraine conflict or Greece; China suffers a severe economic downturn. GLOBAL GROWTH EXPECTED TO BE IN 2015 US Canada Brazil Japan Australia China India Eurozone UK Switzerland Russia World Real GDP growth in % 2014F 2015F 2016F 2.4 3.1 2.8 2.4 2.9 2.8 0.3 0.6 1.8 0.1 1.2 1.6 2.7 2.8 3.2 7.3 6.8 6.5 5.5 5.8 6.5 0.8 1.2 1.6 3.0 2.6 2.8 1.9 0.5 1.1 0.5 -4.5 0.0 3.3 3.5 3.7 KEY DATES 3.5% Inflation in % 2014F 2015F 1.6 0.6 2.1 2.2 6.4 6.8 2.9 1.8 2.6 2.5 2.0 1.5 6.5 5.6 0.4 0.3 1.5 0.4 0.0 -0.6 7.8 13.0 3.4 3.0 2016F 2.8 2.0 5.8 1.4 2.6 1.8 5.0 1.3 1.7 0.9 5.4 3.3 Source: Reuters EcoWin, IMF, UBS CIO WMR, as of 22 January 2015. Note: In developing the CIO economic forecasts, CIO economists worked in collaboration with economists employed by UBS Investment Research. Forecasts and estimates are current only as of the date of this publication, and may change without notice. > 30 JANUARY 2015 > 2 FEBRUARY 2015 Eurozone CPI for January Eurozone CPI inflation continued to fall in December to -0.2% year-on-year but core inflation remained at 0.7%. As we expect the ECB to start quantitative easing measures in 1Q15, we expect inflation to gradually trend higher over the next several years. US ISM Manufacturing Index for January The ISM Manufacturing Index, a barometer of national manufacturing activity, dropped in December to 55.5 after hitting a multi-year high in October. Consensus expectation is for it to remain at a solid level that indicates sturdy manufacturing sector growth. > 6 FEBRUARY 2015 Moderating Chinese growth Gary Tsang CIO VIEW Probability: 65% Moderating Chinese growth The recent pickup in loan growth and housing sales in major cities will likely lead to a mild growth rebound in 2Q15. China’s external demand is expected to improve modestly in 2015, helped by global recovery. Macro policy will maintain its easing bias in light of low inflation and the housing sector correction. POSITIVE SCENARIO Probability: 10% Growth acceleration Annual growth accelerates above 7.5% in 2015 as a result of more substantial policy stimulus measures from the government or a strong pickup in external demand. NEGATIVE SCENARIO à Probability: 25% Sharp economic downturn US labor market report for January Although less than December, January payroll growth remained strong with 252,000 new jobs. Job gains remained healthy and steady, which is a continued positive sign for the economy. We expect nonfarm payrolls to be solid over the next several months and estimate the unemployment rate to be at 5.4% by end-2015. > 12 FEBRUARY 2015 > 26 FEBRUARY 2015 US retail sales for January Core retail sales, which exclude sales at gas stations, auto dealers, and building materials, dropped in December by -0.4% month-onmonth. This was a surprisingly negative outcome. Given solid and improving household fundamentals, we expect real consumption growth to rebound to its previous solid trend of close to 3% annualized. US CPI The consumer price index for December continued to fall to 0.8% year-on-year. We expect CPI inflation to trend higher in 2H15 but average 0.8% in 2015. Annual growth falls below 6% in 2015 due to a sharp downturn in property investment, more widespread credit events, or tighter liquidity as the government heavily reins in shadow-banking activity. FEBRUARY 2015 UBS HOUSE VIEW 11 ASSET CLASSES OVERVIEW Equities Jeremy Zirin, CFA; Stephen Freedman, PhD, CFA; David Lefkowitz, CFA; Manish Bangard, CFA; Markus Irngartinger, PhD, CFA We remain overweight equities relative to bonds. US equities outperformed most other regions in 2014, with a total return of 13.5%, and we expect them to keep up their momentum in the months to come. Positive drivers – most importantly solid earnings growth of around 7% and a robust economic backdrop – will likely remain in place. Swiss earnings face massive headwinds following the strong appreciation of the Swiss franc, and are therefore no longer attractive, in our view. We are neutral Swiss equities. We believe the underperformance of UK equities in 2014 has come to an end, and we now advise a neutral position. In the Eurozone accelerating economic growth and a weaker euro should support earnings in 2015. We therefore introduced an overweight in Eurozone equities. We remain underweight emerging markets, where profit margins and earnings are still falling and lagging those of the US. Global equities Emerging Markets Eurozone We have an overweight stance on Eurozone equities. Earnings should recover over the next six months, driven by an improvement in economic data, the significant depreciation of the euro, the decline in the Brent oil price, and very easy monetary policy. Political risks related to Greece’s upcoming parliamentary election are limited, in our view. Consumer discretionary and industrials benefit from increasing global demand, which supports earnings growth. We also like the consumer staples and financials sectors. EURO STOXX (index points, current: 333) six-month target House view 345 Positive scenario 400 à Negative scenario We are underweight emerging market (EM) equities in our global portfolio. Overall profit margins and earnings continue to fall and lag those of the US. We need to see a pickup in EM earnings to support future performance, especially versus the US, where earnings momentum continues to trend higher. The consensus expectation is for EM earnings to grow around 11% over the next 12 months. We are more cautious, however, and expect around 7% growth. We forecast the trailing P/E to move slightly below its current level of 12.3x. We prefer India, Taiwan, and Mexico to Indonesia, Malaysia, and South Africa. 265 MSCI EM (index points, current: 976) House view Positive scenario à Negative scenario Japan We are neutral on Japanese equities. We forecast corporate earnings growth of 8% in FY2014 and 11–13% in FY2015. The yen’s recent weakness and the sharp oil price decline benefit Japanese manufacturing companies, exporters and US dollar earners in particular. A lower oil price and wage increases in 2015 should help Japanese domestic consumer companies’ earnings to recover as well. The increased equity purchases by the Government Pension Investment Fund and potential further easing by the BoJ will limit the downside risk of equities, in our view. However, the Topix trailing P/E is likely to rerate from 15.6x currently to 15.2x in the next six months, given its relatively rich valuation premium. Overall, we think the Topix will move in line with global equity markets over the next six months. TOPIX (index points, current: 1,391) six-month target House view 1,425 Positive scenario 1,580 à Negative scenario 1,070 12 UBS HOUSE VIEW FEBRUARY 2015 six-month target 990 1,100 770 UK We have a neutral stance on UK equities. With the British pound having weakened more than 10% against the US dollar over the last six months, the exchange rate has turned from a drag into a modest tailwind for earnings. The drop in commodity prices – crude oil in particular – remains a headwind for UK earnings. Further downward revisions to earnings seem likely. In the UK market, the energy sector has a 15% weighting and the mining sector 8%. Still, the relative performance of the UK in recent months already partly reflects this earnings development. FTSE 100 (index points, current: 6,728) six-month target House view 6,850 Positive scenario 7,400 à Negative scenario 5,650 ASSET CLASSES OVERVIEW US equities Similar to 2014, stocks are off to a bumpy start in the new year. Volatility has risen over the past few weeks on concerns that global growth is faltering, primarily driven by the speed and depth of the fall in commodity prices. However, there is little evidence of a material, broad-based growth slowdown, particularly in the US. Job gains are accelerating, business spending is ramping up, consumer and small-business sentiment is rising briskly, and lower oil prices are net positive for US economic growth. Lower oil prices will drive a decline in energy sector profits, but non-energy earnings growth momentum remains solid. US stocks should continue to benefit from the equity-friendly combination of steadily improving economic growth amid muted inflationary pressures (i.e., “Goldilocks”). US Equities overview The 4Q14 earnings season should allay fears of a material profit slowdown for S&P 500 companies. While plunging energy sector earnings and a strong dollar will reduce headline S&P 500 EPS growth in the current and coming quarters, non-energy sector earnings remain healthy. Similar to the past few quarters, the median S&P 500 company should report net income growth of about 9% in 4Q14. Moreover, leading profit indicators remain favorable: bank lending standards continue to loosen and business confidence is increasing. Market valuations are near historical norms and may inch higher as a greater proportion of S&P 500 EPS will come from higher P/E (non-energy) sectors. We raise our six-month S&P 500 target to 2,125. S&P 500 (index points, current: 2,032) six-month target House view 2,125 Positive scenario 2,375 à Negative scenario 1,775 US Sectors We prefer sectors with strong earnings momentum that are leveraged to the US economic expansion. We are upgrading consumer discretionary to our largest sector overweight alongside information technology. Additionally, we are reducing our overweight in Industrials to a moderate overweight (from overweight), upgrading consumer staples from underweight to neutral, and downgrading materials to a moderate underweight (from neutral). We are also downgrading Financials to neutral (from Fig. 1: Non-energy earnings (accounting for ~90% of S&P 500 profits) estimates continue to grow moderate overweight), but maintain our preference for Banks over REITs within the sector. Finally, we remain underweight Telecom and Utilities due to high valuations and challenging fundamentals. See page 29 for a complete listing of our US sector strategy allocation. US Equities – size We continue to favor small- and mid-cap stocks over large-caps. Falling energy sector profits and a rising dollar will be less of an earnings headwind for small- and mid-cap stocks given lower energy sector exposure and a greater proportion of sales derived domestically. Small-caps derive 18–20% of earnings outside the US compared to 30–35% for large-caps. Historically, when small-cap earnings estimates are rising at a faster rate than earnings estimates for large-caps, small-caps have outperformed. Following last year’s underperformance, small-cap valuations (relative to large-caps) are now attractive relative to the last five years. US Equities – style We remain neutral across the style segments of growth and value stocks. In 2014, the Russell 1000 Growth and Value indices both generated a total return between 13–13.5%. We see little evidence that suggests either style segment is poised to materially outperform over the next six months. Relative valuation and our sector positioning (favoring technology over financials) would modestly favor growth stocks, while accelerating US GDP growth momentum historically would favor value. Fig. 2: Small- and mid-cap valuations are looking increasingly attractive Consensus 12-month-forward EPS estimates, indexed to 100 as of 1 January 2014 Forward P/E, small- and mid-caps relative to large-caps 110 1.30 1.18 108 1.25 1.16 106 1.20 1.14 104 1.15 1.12 102 1.10 1.10 100 1.05 1.08 98 1.00 Jan-14 Apr-14 S&P 500 EPS S&P 500 non-energy EPS Source: FactSet, UBS, as of 21 January 2015 Jul-14 Oct-14 Jan-15 1.06 2010 Small-cap (lhs) Mid-cap (rhs) 2011 2012 2013 2014 2015 Small-cap avg (lhs) Mid-cap avg (rhs) Source: FactSet, UBS, as of 21 January 2015 FEBRUARY 2015 UBS HOUSE VIEW 13 ASSET CLASSES OVERVIEW Fixed income Leslie Falconio; Thomas McLoughlin; Barry McAlinden, CFA; Achim Peijan, PhD, CEFA; Philipp Schoettler; Thomas Wacker, CFA We expect the 10-year US Treasury yield to trend moderately higher. Recently, concerns over the deceleration in global growth and the extreme fall in the price of oil, combined with the ECB’s quantitative easing and lower European rates, have weighed on US rates. We think Treasury yields are now somewhat stretched relative to our macro outlook and so expect yields to turn up in anticipation of the Fed hiking policy rates. US Investment Grade Corporate Bonds Government Bonds We lowered our US Treasury forecasts across all maturities to reflect a market that has grown increasingly skeptical about even moderate Fed rate hikes in 2015, and ongoing downward pressure on yields from international developments. Despite a steady flow of solid US growth data, the Fed funds futures market is now only pricing in one rate hike by year-end. To some degree, international economic woes are to blame as the Eurozone is struggling with deflation and Japan and China are working hard to revive their economies. We lowered our 10-year yield forecast to 2.2% from 2.6% in six months. So far in 2015, US investment grade bonds have performed well (+2.2% year-to-date) due to the drop in Treasury yields. While total returns of IG corporate bonds will likely be modest from current yield levels, their yield carry and moderate spread tightening will likely lead to outperformance over government bonds. Our forecast total return for the IG Corporate Index is 1% over the next six months. Bonds from the lower investmentgrade rating segments (BBB) offer better return potential than higherrated issuers. US IG SPREAD (Current: 138bps*) US 10-YEAR YIELD (Current: 1.9%) House view Six-month target 2.2% Positive scenario 2.6–3.0% à Negative scenario 1.6–2.0% US High Yield Corporate Bonds Spreads on high yield (HY) bonds moved sideways over the past month and total returns are flat year-to-date. The key driver for US HY remains oil prices, impacting the energy sector with a 15% weighting in the HY Index. Low oil prices, if sustained, could cause energy company defaults to rise above our base case expectations. Over the next year, we look for the HY default rate to rise toward 3% in our base case (below historical average) and 5% in our risk case (above average). Given that HY spreads are currently pricing in an uptick in defaults, we remain overweight HY bonds. House view Six-month target 100bps Positive scenario 75bps à Negative scenario 250bps *Data based on Barclay’s Corporate Aggregate Indexes. Emerging Market Bonds Six-month target We recommend an underweight allocation to EM sovereign and corporate bonds denominated in USD. Credit spreads of both segments have widened significantly in recent months and now already reflect a substantial deterioration of corporate and country fundamentals. Weak investor sentiment and EM bond fund outflows also weigh on EM bonds. We continue to expect a gradual deterioration of credit quality and a modest increase of corporate default rates in the next 6 to 12 months. In addition, lower commodity prices put further pressure on EM bonds. As long as the economic environment has not turned around, we maintain a cautious stance on EM bonds. House view 400bps EMBI / CEMBI SPREAD (Current: 390bps / 390bps) Six-month target Positive scenario 300bps à Negative scenario 900bps USD HY SPREAD (Current: 536bps) 14 UBS HOUSE VIEW FEBRUARY 2015 House view 380bps / 380bps Positive scenario 260bps / 250bps à Negative scenario 480bps / 470bps ASSET CLASSES OVERVIEW Municipal Bonds Non-US Developed Fixed Income The municipal market is off to a firm start to 2015. As of 21 January, yields on high-grade AAA munis have fallen by 34bps to 24bps at the front end of the curve for 5-year and 10-year bonds, respectively, while yields on long-dated 30-year high-grade munis declined by 27bps, to 2.59% from 2.86%. That said, munis (+1.4%) have underperformed the stronger rally in US government bonds (+1.9%). As a result, tax-exempt munis now exhibit a high degree of relative value versus Treasury securities. Current AAA 10-year muni-to-Treasury yield ratio: 96.9% (last month: 93.6%) Over the past month, bond yields fell to record lows in many countries, spurred by policy changes from the European Central Bank and Swiss National Bank. However, in foreign exchange markets, the dollar strengthened against many other currencies, hurting returns on non-US bonds when measured in dollars. As a result, non-US developed fixed income produced negative returns for dollar-based investors despite the decline in yields. Subdued economic growth and loose monetary policy should help prevent a dramatic rise in non-US bond yields going forward, but in our view the dollar is likely to remain on a strengthening trend. We therefore expect non-US developed fixed income to provide poor returns in US dollar terms, and recommend maintaining an underweight position. Additional US taxable fixed income (TFI) segments Agency Bonds Agency spreads are marginally wider early in the New Year, thanks to the combination of lower rates, higher volatility, and a flatter curve. Unfortunately, the amount of widening does not translate into very attractive projected total returns, assuming our interest-rate forecasts are accurate. We continue to prefer the safety and liquidity of short-term bullets. Finally, on the prospects for GSE regulatory reform, we continue to believe that the odds of a comprehensive housing finance reform this year are very low. Current agency benchmark spread of +18bps over 5-year UST (versus +16bps last month) Treasury Inflation-Protected Securities (TIPS) The TIPS market hit a multi-year low in breakeven inflation expectations as disinflationary pressures from declining commodity prices came to the forefront. TIPS had a very poor showing in 2014 and the wage inflation anticipated by the Fed was below consensus. Given that the 5y-5y forward inflation forecast has fallen over 60bps since November, it is now at a level where buying inflation insurance may be the appropriate play. But not quite yet – illiquidity and uncertainty prevail, and we believe it is best to wait on the sidelines for better entry. policy announcement that might raise GNMA prepayments threatened to widen mortgage current-coupon spreads. So far, however, that threat has mostly been an empty one. Indeed, spreads are now near the tightest levels they’ve been since the 1980s, not counting the levels post-QE3 announcement. While not exactly good news for bottom-fishers, it is indicative of how strong the fundamental and technical backdrop remains. Current MBS spread of 93bps to blend of 5-year and 10-year Treasuries (versus +104bps last month) Preferred Securities With a return of 1% year-to-date, preferreds continue to benefit from the decline in long-term benchmark rates and solid investor demand. We maintain a neutral weighting, keeping in mind the gains already achieved and the prospects for volatility as the Fed pivots its policy stance. Although CIO WMR recently lowered its rate forecast, we prefer to take a more defensive posture as we expect rate and spread volatility to increase in 2015. We prefer to gain preferred securities exposure with lower-duration preferred coupons, favoring fixed-to-float structures over fixed-for-life coupons. Current spread of +340bps over 10-year UST (+294bps last month; data based on the BoA Core Plus Fixed Rate Preferred Index Current 10-year breakeven inflation rate of 1.61% (1.83% last month) Mortgage-Backed Securities (MBS) An a negative headwind has greeted the MBS market in 2015, as the combination of a powerful rally to lower rates, higher volatility, and a Fig. 2: The drop in forward inflation and oil is highly correlated Regression of the 5yr–5yr forward inflation rate vs. oil prices 2.45 Fig. 1: CIO WMR interest rate forecasts 2.40 in % Americas USD 3M Libor y = 0.0182x + 1.3673 R² = 0.81 2.35 20-Jan-15 3 months 6 months 12 months 0.2 0.5 0.7 1.7 USD 2Y Treas. 0.5 0.9 1.0 1.3 USD 5Y Treas. 1.3 1.6 1.8 2.0 USD 10Y Treas. 1.8 2.0 2.2 2.4 USD 30Y Treas. 2.4 2.6 2.8 2.9 Source: Bloomberg, UBS CIO WMR, as of 20 January 2014 2.30 2.25 2.20 45 47 49 51 53 55 57 59 Source: Bloomberg, UBS, as of 20 January 2015 FEBRUARY 2015 UBS HOUSE VIEW 15 ASSET CLASSES OVERVIEW Commodities and other asset classes Dominic Schnider, CFA, CAIA; Giovanni Staunovo; Thomas Veraguth We expect commodity prices to come under pressure in 1H15 before recovering in 2H15. In this light, the total return of the asset class is likely to be modestly negative over the next six months. This makes broadly diversified commodity exposure an unattractive investment. Our spot price and return forecasts vary greatly across sectors. In the near term, we reaffirm our view of further downside in energy and precious metal prices, while base metals and agriculture deliver flat returns on average. Commodities Precious metals We continue to have a negative outlook for gold and silver. The Fed remains on track to start raising policy rates this year, though a clear guidance would be needed to trigger a material decline in gold prices. We think such a policy shift should become visible in 1H15. As the opportunity costs for holding gold should rise, we expect the gold price to drop to USD 1,100/oz in six months and USD 1,050/oz in 12 months. Among the industrially oriented precious metals, palladium has the best fundamentals with the largest market deficit, warranting a price above USD 900/oz in the coming quarters. That said, a long position in palladium needs to come with a stop-loss to limit losses given the metal’s volatility. GOLD (Current: USD 1,285/oz) six-month target House view USD 1,100/oz Positive scenario USD 1,400/oz à Negative scenario USD 900/oz Crude oil Crude oil prices remain in a free fall with no imminent floor in sight. OPEC’s decision to leave the oil market to itself is in full swing, and the likelihood that OPEC will change its mind in the near term is small. Although current prices are not sustainable, the short-term price outlook for crude oil remains negative in our view. Hence, we reiterate our recommendation to avoid any direct exposure related to crude oil at this time. In the summer, we expect crude oil prices to find a floor and trend higher again as supply adjustments become visible. BRENT (Current: USD 48.7/bbl) House view six-month target USD 50/bbl Positive scenario USD 80–90/bbl à Negative scenario USD 30–40/bbl Base metals Base metal prices also appear challenged in 1H15. Slowing economic activity in China and a soft one in other emerging markets and Europe make a broad price improvement unlikely. That said, zinc, nickel, lead, and aluminum should see small market deficits in 2015, potentially supporting prices and, in the case of nickel and zinc, even triggering price 16 UBS HOUSE VIEW FEBRUARY 2015 increases. For copper, we expect prices to weaken further (to USD 4.900/ mt in 3–6 months) due to weakening demand, sufficient supply, and a modest market surplus driving exchange inventories higher. That said, supply growth is likely to slow toward the end of 2015, leading to a potential price recovery in 2H15. The vastly different price performance of base metals in 2014 is likely to persist in 2015. Agriculture A strong US dollar and diminishing supply constraints are likely to mark the agricultural commodity market in 2015. We therefore expect the open interest in agricultural commodities to continue to decline. With no weather-related supply issues, easing market liquidity could add to the overall volatility in prices. Nevertheless, some individual commodity stories are compelling. Coffee remains vulnerable to weather events in Brazil, as is winter wheat in Russia and the US, which have seen a portion of their crop enter dormancy in less-than-ideal conditions. Uncertainty in Russian export policies in 2015 is an additional risk for wheat. Soybean and corn prices have recovered somewhat from mid-October lows. Chinese demand for US soybeans has been better than last year, which, alongside some dryness in Brazil, should keep prices well supported at least for another 4–6 weeks. Other asset classes Listed real estate Listed real estate strongly outperformed global equities in 2014 due to unexpectedly lower yields. The universe is unattractively priced compared to historical levels. The asset class has rebounded very strongly after the sharp correction in September 2014 and is now trading at unsustainably high levels, in our view. The market has not yet priced in a first interest rate hike by the Fed, which is why we expect higher price volatility in the next six months; we also expect total returns to be slightly negative although net asset value is expected to grow 7.3%. Dividend yield should be 3.6% over the next 12 months. FTSE EPRA/NAREIT Developed TR USD (Current: 4,477) six-month target House view USD 4,150 Positive scenario USD 4,300 à Negative scenario USD 3,800 ASSET CLASSES OVERVIEW Foreign exchange Katie Klingensmith; Thomas Flury Currency markets have had a dynamic start to the year. The Swiss National Bank’s surprise decision to remove the euro-franc exchange-rate floor led to a dramatic appreciation of the franc toward parity against the euro, pushing currency-market volatility to a three-year high. In addition, markets had anticipated the European Central Bank’s announcement of a new quantitative-easing program; we expect the bold measures announced on 22 January to keep the euro under pressure. The US dollar has strengthened against most currencies, bringing its trade-weighted gains to more than 15% over the past six months. We remain overweight the dollar against the euro, and the pound against the franc; we have closed our long Canadian dollar position against the Swiss franc after the SNB surprise. USD Economic data in the US remain strong enough for the Fed to hike rates in 2015. We are holding an overweight in the US dollar against the euro as the divergences in growth rates, monetary policy, and bond yields favor the US currency. The expectation of Fed tightening should continue to support the USD against many currencies. We think that the strong dollar causes only a small drag on the US economy, which is currently offset by lower oil prices. However, markets are very well positioned for more USD strength, with virtually all market watchers expecting more dollar appreciation and the IMM dollar speculative accounts at historic highs. We caution that the dollar’s appreciation path may be bumpier going forward. EUR The Eurozone remains in a very different situation than the US. The ECB had little choice than to announce additional balance sheet measures after prices started falling and expectations for long-term inflation became unanchored. These measures have not yet convinced the market that Eurozone inflation will reach the ECB’s 2% target anytime soon, so the ECB can be expected to do more, keeping the euro under pressure. We expect that European corporations will soon benefit from the weaker currency, and that growth will bottom out and begin to recover by the end of this year. All this should slow the depreciation path of the euro. GBP We continue to hold an overweight in the British pound against the Swiss franc as the UK economy remains on strong footing and monetary policy is set to tighten in 2015. Growth and labor market dynamics in the UK still speak for tighter Bank of England monetary policy in 2015, most probably after the Fed hike. The elections in May could increase volatility, but the UK’s strong economic fundamentals and prospects of monetary policy tightening make the GBP one of the best alternative investment opportunities besides the greenback. JPY The Bank of Japan’s expansionary monetary policy pushed USDJPY higher over recent months before consolidation took place. The low yen, which is critical to Japan’s fight against deflation, is unwelcomed by Japanese consumers who do not enjoy the rising food and energy prices that accompany the weaker currency. Lower oil prices reduce the pressure somewhat, but we still expect USDJPY to trade sideways around 120–125 with increased volatility from here. CHF At current levels, we believe the Swiss franc is strongly overvalued; we estimate purchasing power parity for EURCHF at 1.28 compared to approximately 1.0 where it has settled since the SNB removed the EURCHF floor. Negative yields across the Swiss yield curve speak for a weaker franc. However, there remain investors who are still looking to diversify euro holdings into Swiss francs. To reflect these diverging factors, we have kept an underweight position in the Swiss franc, but halve its size. We removed our overweight position in the Canadian dollar to fund this, but maintain a CHF underweight relative to the GBP. Other developed market currencies While we have removed our overweight in the Canadian dollar, we still believe economic data speak for a volatile yet ultimately stronger CAD, in spite of lower oil prices and the recent rate cut by the Bank of Canada. In contrast, climbing US rates and weaker Chinese growth should further weaken both the Australian and New Zealand dollars. The Swedish krona remains relatively weak as the Riksbank has cut rates to zero and pledged to keep them low. Swedish inflation is too low to let the currency appreciate. The Norwegian krone should strengthen slightly against the EUR sometime in 2015, but will remain under pressure until then due to lower oil prices. UBS CIO FX forecasts 22-Jan-15 3M 6M 12M PPP* EURUSD 1.155 1.10 1.10 1.15 1.31 USDJPY 117.7 124 124 120 72 USDCAD 1.237 1.22 1.18 1.15 1.14 AUDUSD 0.810 0.77 0.80 0.80 0.74 GBPUSD 1.516 1.51 1.54 1.58 1.70 NZDUSD 0.754 0.72 0.74 0.76 0.60 USDCHF 0.861 0.91 0.91 0.91 0.98 EURCHF 0.994 1.00 1.00 1.05 1.28 GBPCHF 1.304 1.37 1.40 1.44 1.66 EURJPY 136.0 136 136 138 95 EURGBP 0.762 0.73 0.71 0.73 0.77 EURSEK 9.419 9.40 9.40 9.40 8.77 EURNOK 8.804 9.00 9.00 9.00 9.51 Source: Thomson Reuters, UBS CIO WMR, as of 22 January 2015 Note: Past performance is not an indication of future returns. *PPP = Purchasing Power Parity FEBRUARY 2015 UBS HOUSE VIEW 17 IN FOCUS The Decade Ahead: In front of the curve publication Top themes. To identify the trends that we expect to result in investment opportunities, we utilized a dynamic framework that is built upon a set of structural drivers. These drivers, in our opinion, capture the most influential sources of change and include: technological innovation, demographic changes, sources and uses of natural resources, trends in globalization, government policy choices, economic normalization, and societal and cultural shifts (see Fig. 1). While any attempt to peer into the future is bound to be as humbling as it is enlightening, we believe looking ahead through this lens reveals potential opportunities for individuals to generate excess returns, take advantage of financial industry trends, and positively impact their wealth over time. Stephen Freedman, PhD, CFA Andrea Fisher, CFA Head of Cross-Asset Strategy Investment strategist CIO Wealth Management Research CIO Wealth Management Research With the 24-hour news cycle, quarterly reporting and instant access to financial market quotes on smartphones, investors would have plenty of reasons to shorten their investment time horizon, and many do. Yet, we find that a critical element of effective investment discipline lies, quite to the contrary, in lengthening one’s time horizon. This can involve appreciating the benefits of holding a long-term-oriented and diversified strategic asset allocation to guide portfolio decisions. But it can also mean understanding long-term trends that are likely to drive investment returns not over the next quarters but rather through the next business cycles. It is on the latter aspect that we wish to focus here. We recently launched a suite of three new long-term thematic ideas that we expect to play out in 10-year cycles (a.k.a. “decade themes”). These three themes have been integrated into our existing thematic research offering in the flagship 18 UBS HOUSE VIEW FEBRUARY 2015 The three decade themes recently launched are the following (see pgs. 20-21 for more details). First, the Millennial generation, for example, is a unique and important population cohort to understand from an investment perspective because of their growing consumer power. This subset of individuals – currently between the ages of 16 and 35 years old – is very large in size and given demographic trends, it is poised to have an outsized impact of the US economy akin to the baby boomers in their time. Since their large size represents significant spending power potential, we believe certain companies and segments of the market stand to benefit as Millennials increasingly enter the workforce and enter their peak earnings and spending years. The types of companies that should experience a growth tailwind are those that are catering to this generation’s unique consumption needs and preferences. Though Millennials exhibit some behavioral traits in common with past generations, different social influences and economic circumstances distinguish them. The bursting of the housing bubble and the Great Recession, for example, have negatively impacted their finances and altered perspectives toward home ownership, which is resulting in higher rentership rates. On the other hand, this generation is tech-savvy, health-conscious, and well-educated. Given these considerations, we expect certain innovative technology companies, wellness-focused brands, IN FOCUS and service-oriented industries to be the primary investment beneficiaries of the rising Millennial generation. The second decade theme we feature is a textbook example of innovation-driven investment opportunities. Over the next decade, we expect two transformational technologies to create a wave of innovation that should lead to rapid growth in some parts of the economy but also disrupt others. Growth in robotics and smart automation is being driven by rising wages and challenging demographic developments in key emerging economies. This creates cost pressures that will likely be alleviated through productivity-enhancing investments in smart automation by manufacturing companies in emerging markets, thereby making it one of the fastest growing areas in the technology and industrial sector. Likewise, we believe digital data is set to expand exponentially over the decade on the back of rising internet penetration and greater average data usage in emerging markets. The emergence and rapid growth of the Internet-of-Things – the network of connected devices through which everyday objects like thermostats, watches, and cars are constantly sending and receiving data – means data growth will expand faster than suggested by mere demographics and behavioral considerations. The net result is that companies positioned to benefit from the digital data expansion should exhibit attractive earnings growth. Finally, we believe liability optimization is a compelling decade theme to consider right now. Given monetary policy responses to the financial crisis of 2007-2008, interest rates remain today at historically low levels and present an opportune time to refinance liabilities and optimize balance sheets. While the current tactical environment is a catalyst for the near-term opportunity, liability optimization should be thought of in a decade context as it has the potential to significantly impact a household’s net worth as the potential benefit is accrued and compounded over many years. Indeed, debt usage is expected to result in greater wealth accumulation when the expected return on invested assets exceeds the cost of borrowing. For more information on these themes, ask your UBS Financial Advisor for a copy of the report “Top themes: The Decade Ahead,” 12 January 2015. Fig. 1: Drivers behind decade themes Resources Innovation P P Demographics Globalization Government Normalization Society Themes Transformational technologies P The rising Millennials P P P Liability optimization P P P FEBRUARY 2015 UBS HOUSE VIEW 19 Top themes Highlights from our monthly selection of highest conviction investment themes across the asset class spectrum Liability optimization The rising Millennials Michael Crook Andrea Fisher, CFA; Jonathan Rather Context – planning We view the current market environ- Portfolio context u Utilize lending u Multi-year: Decade theme (>12 months) u Portfolio ment as an opportune time for investors to “optimize” their liabilities in order to add potential alpha to their balance sheets. The main monetary policy response to the financial crisis of 20072008 was clear and direct in its intention to reduce interest rates. Indeed, the last remaining vestige of the financial crisis can be seen today in the low levels of prevailing rates. Low rates provide an excellent opportunity on the liability side of the balance sheet to lock in low borrowing costs and express views on interest rates and inflation. integration Additionally, utilizing low rate debt while Historically low interest keeping investment assets productive rates create an opportune time for investors to could significantly impact a household’s net worth over a longer time horizon. extend the duration of Looking forward, portfolio returns are their liabilities and take likely to outpace the current cost of debt advantage of low rates. which, after years and decades of comu Full report pounding, could lead to enhanced in“Balance sheet optimiza- vestment returns. tion” as of 9 January 2015 Given their large size and earnings potential, we believe companies with positive exposure to the rising Millennial generation will experience a growth tailwind. First, this is a generation of “digital natives,” having grown up with cable TV and the internet. Their passion for and fluency with technology is fueling growth in e-Commerce, social media services, and mobile applications. US equity u Growth opportunities u Multi-year: Decade theme (>12 months) u Portfolio Second, easy access to information and larger online social networks has created a young adult population that has more choices, is more informed, and values a healthy lifestyle. This favors cost-competitive online retailers strongly plugged into social media as well as companies providing organic food and digital fitness gadgets. Finally, Millennials are an urban-renting generation due to a confluence of cyclical and structural considerations, which favors rental-related companies as well as “sharing economy” services. integration As a core part of a US equity portfolio, exposure can be gained through passively managed technology sector funds or through actively managed strategies with targeted exposure. u Full report “The rising Millennials” as of 9 January 2015 Interest rates continue to decline Generational breakdown of US population Treasury rates, 1990–2014, in % 5,000,000 10 4,500,000 8 6 4,000,000 4 3,500,000 2 0 Millennials 3,000,000 Generation X Baby boomers –2 1990 1992 1994 1996 1998 2000 2002 2004 2006 2008 2010 2012 2014 10-year Treasury 10-year TIPS Source: Bloomberg, UBS, as of 19 December 2014 2,500,000 2,000,000 0 5 10 15 20 Source: US Census Bureau, as of 2010 20 UBS HOUSE VIEW FEBRUARY 2015 25 30 35 40 45 50 55 60 65 Top themes Highlights from our monthly selection of highest conviction investment themes across the asset class spectrum Transformational technologies Stephen Freedman, PhD, CFA; Manish Bangard, CFA Portfolio context US equity u Innovation-based structural change u Multi-year: Decade theme (>12 months) u Portfolio integration As a portion of a global equity portfolio, we’ve identified a list of stocks that are poised to benefit from positive trends related to digital data, robotics, and automation. u Full report Over the next decade, we expect a wave of technological innovation to drive productivity growth, disrupt industries and create substantial growth opportunities. In particular, digital data is likely to experience exponential growth over the next decade driven by a combination of demographic factors like rising global internet penetration and increased data usage in emerging markets, and secular trends like changing consumer digital lifestyles and the rapid emergence of the Internetof-Things. This offers interesting longterm growth opportunities through data enablers, and in data infrastructure companies. We believe smart automation is powering an industrial revolution, combining the innovation power of industrial and IT processes to drive global manufacturing productivity gains. It represents one of the fastest growing segments in the broader industrial and IT sectors. Top themes Thematic investment ideas from CIO Wealth Management Research January 2015 The Decade Ahead ab The investment themes highlighted in this section are among our highest conviction thematic recommendations. The full list of most preferred themes (see below) is discussed in our monthly publication entitled “Top themes.” Preferred themes • Capex rising...finally • e-Commerce: beyond Amazon • Liability optimization • Major advances in cancer therapeutics • MBS IOs – Positive returns when rates rise “US equities: Transformational technologies,” 8 January 2015 • The rising Millennials • Transformational technologies • US senior loans Robot density by country Ask your Financial Advisor for a copy of this publication. Robots per 10,000 employees China United Kingdom Canada France Spain USA Italy Sweden Germany Japan Korea 0 50 100 150 200 250 300 350 400 Source: IFR World Robotics, UBS, as of 2012 FEBRUARY 2015 UBS HOUSE VIEW 21 KEY FORECASTS KEY FORECASTS Overweight Neutral As of 21 January 2015 Asset class Underweight TAA1 Change2 6-month forecast Positive Negative House View scenario scenario Benchmark Value m/m perf.3 in % 2032 -1.9% 2125 2375 1775 EQUITIES USA à S&P 500 Eurozone Þ Euro Stoxx 333 4.7% 345 400 265 UK Þ FTSE 100 6728 2.8% 6850 7400 5650 – Topix 1391 -1.3% 1425 1580 1070 à SMI 8009 -10.8% 8050 8950 7150 Japan Switzerland Emerging Markets – MSCI EM 976 3.3% 990 1100 770 – 10yr yield 1.9% 1.8% 2.2% 2.6-3.0% 1.6-2.0% BONDS US Government bonds US Corporate bonds Þ Spread 138 bps 1.9% 100 bps 75 bps 250 bps US High yield bonds à Spread 536 bps 0.6% 400 bps 300 bps 900 bps EM Sovereign à Spread 389 bps 0.5% 380 bps 260 bps 480 bps EM Corporate – Spread 386 bps 2.2% 380 bps 250 bps 470 bps Commodities – DJUBS ER Index 103 -5.6% NA NA NA Listed Real Estate – EPRA/NAREIT DTR 4477 5.5% 4150 4300 3800 NA NA NA NA NA OTHER ASSET CLASSES CURRENCIES Currency pair USD – EUR – EURUSD 1.16 -5.1% 1.10 1.10 1.25 GBP – GBPUSD 1.51 -3.1% 1.54 NA NA JPY – USDJPY 118 -1.3% 124 125 110 CHF Þ USDCHF 0.86 -12.6% 0.91 NA NA Source: UBS CIO WMR, Bloomberg 1 TAA = Tactical asset allocation, 2 All changes are relative to the last full, 3 Month-on-month performance edition of “House View” published on 21 November 2014. Past performance is no indication of future performance. Forecasts are not a reliable indicator of future performance. 22 UBS HOUSE VIEW FEBRUARY FEBRUARY2015 2015 DETAILED ASSET ALLOCATION Detailed asset allocation taxable with non-traditional assets 0.0 +0.0 0.0 Current allocation1 Change this month 0.0 WMR tactical deviation Strategic asset allocation Aggressive Current allocation1 0.0 +0.0 Change this month Strategic asset allocation 0.0 WMR tactical deviation Current allocation1 0.0 +0.0 Moderately aggressive Change this month 0.0 WMR tactical deviation Strategic asset allocation Moderate Current allocation1 0.0 +0.0 Change this month 0.0 WMR tactical deviation Change this month Strategic asset allocation 0.0 +0.0 Moderately conservative Current allocation1 Cash WMR tactical deviation Change this month* All figures in % Conservative Strategic asset allocation Investor risk profile Fixed Income 69.0 -2.0 67.0 57.0 -3.0 54.0 46.5 -3.5 43.0 41.0 -3.5 37.5 33.0 -3.5 29.5 US Fixed Income 62.0 +1.0 63.0 51.0 +0.0 51.0 40.5 +0.5 41.0 34.0 +0.5 34.5 26.0 +0.5 26.5 US Gov’t 7.0 -2.0 5.0 5.5 -2.5 3.0 4.0 -3.0 1.0 3.5 -3.0 0.5 2.0 -2.0 0.0 50.0 -1.0 49.0 39.0 -1.5 37.5 30.0 -0.5 29.5 24.0 -0.5 23.5 17.0 -1.5 15.5 US IG total market 4.0 +0.5 4.5 3.5 +0.5 4.0 3.0 +0.5 3.5 2.5 +0.5 3.0 2.0 +0.5 2.5 US IG 1–5 years 0.0 +2.0 2.0 0.0 +2.0 2.0 0.0 +2.0 2.0 0.0 +2.0 2.0 0.0 +2.0 2.0 US HY Corp 1.0 +1.5 2.5 3.0 +1.5 4.5 3.5 +1.5 5.0 4.0 +1.5 5.5 5.0 +1.5 6.5 7.0 -3.0 4.0 6.0 -3.0 3.0 6.0 -4.0 2.0 7.0 -4.0 3.0 7.0 -4.0 3.0 US Municipal Int’l Fixed Income Int’l Developed Markets 6.0 -2.0 4.0 4.0 -2.0 2.0 3.0 -2.0 1.0 3.0 -2.0 1.0 2.0 -2.0 0.0 Emerging Markets 1.0 -1.0 0.0 2.0 -1.0 1.0 3.0 -2.0 1.0 4.0 -2.0 2.0 5.0 -2.0 3.0 Equity US Equity 16.0 +2.0 18.0 27.0 +3.0 30.0 34.5 +3.5 38.0 45.0 +3.5 48.5 55.0 +3.5 58.5 9.0 +2.0 11.0 15.0 +3.0 18.0 20.0 +3.5 23.5 26.0 +3.5 29.5 31.0 +3.5 34.5 US Large cap Growth 2.5 +0.0 2.5 4.5 +0.0 4.5 6.0 +0.0 6.0 8.0 +0.0 8.0 9.5 +0.0 9.5 US Large cap Value 2.5 +0.0 2.5 4.5 +0.0 4.5 6.0 +0.0 6.0 8.0 +0.0 8.0 9.5 +0.0 9.5 US Mid cap 3.0 +0.5 3.5 4.0 +1.0 5.0 5.0 +1.0 6.0 7.0 +1.0 8.0 8.0 +1.0 9.0 US Small cap 1.0 +1.5 2.5 2.0 +2.0 4.0 3.0 +2.5 5.5 3.0 +2.5 5.5 4.0 +2.5 6.5 19.0 24.0 +0.0 24.0 International Equity 7.0 +0.0 Int’l Developed Markets 4.0 +0.5 4.5 7.0 +1.0 8.0 8.5 +1.0 9.5 Emerging Markets 3.0 -0.5 2.5 5.0 -1.0 4.0 6.0 -1.0 5.0 4.0 +0.0 4.0 4.0 +0.0 4.0 4.0 +0.0 12.0 15.0 +0.0 Commodities Non-traditional 11.0 +0.0 7.0 12.0 +0.0 11.0 12.0 +0.0 12.0 14.5 +0.0 14.5 19.0 +0.0 11.0 +1.0 8.0 12.0 -1.0 7.0 4.0 5.0 +0.0 15.0 14.0 +1.0 10.0 15.0 -1.0 9.0 5.0 5.0 +0.0 5.0 9.0 +0.0 9.0 7.0 +0.0 7.0 Hedge Funds 11.0 +0.0 11.0 12.0 +0.0 12.0 10.0 +0.0 10.0 3.0 +0.0 3.0 0.0 +0.0 0.0 Private Equity 0.0 +0.0 0.0 0.0 +0.0 0.0 5.0 +0.0 5.0 6.0 +0.0 6.0 7.0 +0.0 7.0 Private Real Estate 0.0 +0.0 0.0 0.0 +0.0 0.0 0.0 +0.0 0.0 0.0 +0.0 0.0 0.0 +0.0 0.0 “WMR tactical deviation” legend: Overweight Underweight Neutral “Change” legend: p Upgrade q Downgrade *Refers to moderate-risk profile. 1 The current allocation column is the sum of the strategic asset allocation and the tactical deviation column. Source: UBS CIO WMR and WMA AAC, 22 January 2015. See appendix for information regarding sources of strategic asset allocations and their suitability, investor risk profiles, and the interpretation of the suggested tactical deviations from the strategic asset allocations. The “Changes this month” column reflects changes since 19 January 2015. For information on recent changes, see our UBS House View Updates: Tactical adjustments for a diverging world, 19 Jan 2015, and Oil prices fall further – tactical changes, 15 Dec 2014. FEBRUARY 2015 UBS HOUSE VIEW 23 DETAILED ASSET ALLOCATION Detailed asset allocation taxable without non-traditional assets Fixed Income 80.0 US Fixed Income 72.0 +1.0 US Gov’t US Municipal -2.0 78.0 66.0 -3.0 73.0 58.0 +1.0 63.0 54.5 -3.5 59.0 47.0 +0.5 51.0 44.0 -3.5 47.5 36.0 +0.5 40.5 33.0 Current allocation1 0.0 +0.0 Change this month 0.0 WMR tactical deviation Strategic asset allocation 0.0 +0.0 Aggressive Current allocation1 0.0 Change this month Benchmark allocation WMR tactical deviation Current allocation1 0.0 +0.0 Moderately aggressive Change this month 0.0 WMR tactical deviation Strategic asset allocation Moderate Current allocation1 0.0 +0.0 Change this month 0.0 WMR tactical deviation Change this month Strategic asset allocation 0.0 +0.0 Moderately conservative Current allocation1 Cash WMR tactical deviation Change this month* All figures in % Conservative Strategic asset allocation Investor risk profile 0.0 -3.5 29.5 36.5 26.0 +0.5 26.5 8.0 -2.0 6.0 7.0 -2.5 4.5 5.0 -3.0 2.0 3.0 -3.0 0.0 2.0 -2.0 0.0 58.0 -1.0 57.0 45.0 -1.0 44.0 35.0 -1.0 34.0 26.0 -1.0 25.0 16.0 -1.5 14.5 US IG total market 4.0 +0.5 4.5 3.0 +1.0 4.0 3.0 +1.0 4.0 2.0 +1.0 3.0 1.0 +0.5 1.5 US IG 1–5 years 0.0 +2.0 2.0 0.0 +2.0 2.0 0.0 +2.0 2.0 0.0 +2.0 2.0 0.0 +2.0 2.0 US HY Corp 2.0 +1.5 3.5 3.0 +1.5 4.5 4.0 +1.5 5.5 5.0 +1.5 6.5 7.0 +1.5 8.5 8.0 -3.0 5.0 8.0 -4.0 4.0 7.5 -4.0 3.5 8.0 -4.0 4.0 7.0 -4.0 3.0 Int’l Developed Markets 6.0 -2.0 4.0 5.0 -3.0 2.0 4.0 -2.0 2.0 3.0 -2.0 1.0 2.0 -2.0 0.0 Emerging Markets 2.0 -1.0 1.0 3.0 -1.0 2.0 3.5 -2.0 1.5 5.0 -2.0 3.0 5.0 -2.0 3.0 Int’l Fixed Income Equity US Equity 16.0 +2.0 18.0 30.0 +3.0 33.0 40.5 +3.5 44.0 51.0 +3.5 54.5 62.0 +3.5 65.5 9.0 +2.0 11.0 18.0 +3.0 21.0 23.0 +3.5 26.5 29.0 +3.5 32.5 36.0 +3.5 39.5 US Large cap Growth 3.0 +0.0 3.0 5.0 +0.0 5.0 7.0 +0.0 7.0 9.0 +0.0 9.0 11.0 +0.0 11.0 US Large cap Value 3.0 +0.0 3.0 5.0 +0.0 5.0 7.0 +0.0 7.0 9.0 +0.0 9.0 11.0 +0.0 11.0 US Mid cap 2.0 +0.5 2.5 5.0 +1.0 6.0 6.0 +1.0 7.0 7.0 +1.0 8.0 9.0 +1.0 10.0 US Small cap 1.0 +1.5 2.5 3.0 +2.0 5.0 3.0 +2.5 5.5 4.0 +2.5 6.5 5.0 +2.5 7.5 17.5 22.0 +0.0 22.0 26.0 +0.0 26.0 11.0 13.5 15.0 +1.0 16.0 International Equity 7.0 +0.0 7.0 12.0 +0.0 Int’l Developed Markets 4.0 +0.5 4.5 7.0 +1.0 8.0 Emerging Markets 3.0 -0.5 2.5 5.0 -1.0 4.0 7.5 -1.0 6.5 9.5 -1.0 8.5 11.0 -1.0 10.0 4.0 +0.0 4.0 4.0 +0.0 4.0 5.0 +0.0 5.0 5.0 +0.0 5.0 5.0 +0.0 5.0 Commodities 12.0 17.5 +0.0 10.0 +1.0 12.5 +1.0 “WMR tactical deviation” legend: Overweight Underweight Neutral “Change” legend: p Upgrade q Downgrade *Refers to moderate-risk profile. 1 The current allocation column is the sum of the strategic asset allocation and the tactical deviation column. Source: UBS CIO WMR and WMA AAC, 22 January 2015. See appendix for information regarding sources of strategic asset allocations and their suitability, investor risk profiles, and the interpretation of the suggested tactical deviations from the strategic asset allocations. The “Changes this month” column reflects changes since 19 January 2015. For information on recent changes, see our UBS House View Updates: Tactical adjustments for a diverging world, 19 Jan 2015, and Oil prices fall further – tactical changes, 15 Dec 2014. 24 UBS HOUSE VIEW FEBRUARY 2015 DETAILED ASSET ALLOCATION Detailed asset allocation non-taxable with non-traditional assets US Fixed Income 60.0 +1.0 61.0 49.0 +0.5 49.5 40.0 +0.5 47.0 -3.5 43.5 -5.0 31.0 US Municipal 0.0 +0.0 0.0 0.0 +0.0 US IG total market 9.0 +1.0 10.0 US IG 1–5 years 0.0 +2.0 US HY Corp 43.0 39.0 35.5 33.0 Current allocation1 Change this month Strategic asset allocation 0.0 +0.0 WMR tactical deviation Current allocation1 0.0 0.0 40.5 32.5 +0.5 33.0 26.0 +0.5 26.5 -6.0 22.0 -6.0 13.5 0.0 0.0 +0.0 0.0 0.0 +0.0 7.0 +1.5 8.5 5.0 +2.0 7.0 2.0 0.0 +2.0 2.0 0.0 +2.0 4.0 +1.5 5.5 6.0 +2.0 8.0 8.0 -3.0 5.0 7.0 -3.5 Int’l Developed Markets 6.0 -2.0 4.0 4.0 Emerging Markets 2.0 -1.0 1.0 3.0 19.5 -3.5 Change this month Strategic asset allocation 0.0 +0.0 WMR tactical deviation Current allocation1 0.0 Aggressive 29.5 28.0 -3.5 Change this month Strategic asset allocation 53.0 46.5 WMR tactical deviation Current allocation1 0.0 +0.0 Moderately aggressive -3.5 36.0 -3.0 0.0 68.0 Int’l Fixed Income 66.0 56.0 Change this month 0.0 +0.0 WMR tactical deviation Change this month 0.0 Moderate Fixed Income US Gov’t -2.0 Strategic asset allocation 0.0 +0.0 Moderately conservative Current allocation1 Cash WMR tactical deviation Change this month* All figures in % Conservative Strategic asset allocation Investor risk profile 13.0 -6.0 7.0 0.0 0.0 +0.0 0.0 4.0 +2.0 6.0 2.0 +2.0 4.0 2.0 0.0 +2.0 2.0 0.0 +2.0 2.0 7.0 +2.5 9.5 9.0 +2.5 11.5 11.0 +2.5 13.5 3.5 6.5 -4.0 2.5 6.5 -4.0 2.5 7.0 -4.0 3.0 -2.0 2.0 3.5 -2.0 1.5 2.5 -2.0 0.5 2.0 -2.0 0.0 -1.5 1.5 3.0 -2.0 1.0 4.0 -2.0 2.0 5.0 -2.0 3.0 Equity 17.0 +2.0 19.0 28.0 +3.0 31.0 34.5 +3.5 38.0 42.0 +3.5 45.5 53.0 +3.5 56.5 US Equity 10.0 +2.0 12.0 16.0 +3.0 19.0 20.5 +3.5 24.0 24.0 +3.5 27.5 31.0 +3.5 34.5 US Large cap Growth 3.0 +0.0 3.0 5.0 +0.5 5.5 6.0 +0.0 6.0 7.5 +0.0 7.5 9.5 +0.0 9.5 US Large cap Value 3.0 +0.0 3.0 5.0 +0.0 5.0 6.0 +0.0 6.0 7.5 +0.0 7.5 9.5 +0.0 9.5 US Mid cap 2.5 +0.5 3.0 4.0 +0.5 4.5 5.5 +1.0 6.5 6.0 +1.0 7.0 8.0 +1.0 9.0 US Small cap 1.5 +1.5 3.0 2.0 +2.0 4.0 3.0 +2.5 5.5 3.0 +2.5 5.5 4.0 +2.5 6.5 7.0 +0.0 7.0 12.0 +0.0 18.0 22.0 +0.0 22.0 Int’l Developed Markets 4.0 +0.5 4.5 7.0 +1.0 8.0 8.0 +1.0 9.0 11.0 14.0 Emerging Markets 3.0 -0.5 2.5 5.0 -1.0 4.0 6.0 -1.0 5.0 8.0 -1.0 7.0 9.0 -1.0 8.0 4.0 +0.0 4.0 4.0 +0.0 4.0 4.0 +0.0 4.0 5.0 +0.0 5.0 5.0 +0.0 5.0 14.0 9.0 +0.0 9.0 International Equity Commodities Non-traditional 12.0 14.0 +0.0 14.0 18.0 +0.0 10.0 +1.0 13.0 +1.0 11.0 +0.0 11.0 12.0 +0.0 12.0 15.0 +0.0 15.0 14.0 +0.0 Hedge Funds 11.0 +0.0 11.0 12.0 +0.0 12.0 10.0 +0.0 10.0 8.0 +0.0 8.0 3.0 +0.0 3.0 Private Equity 0.0 +0.0 0.0 0.0 +0.0 0.0 5.0 +0.0 5.0 6.0 +0.0 6.0 6.0 +0.0 6.0 Private Real Estate 0.0 +0.0 0.0 0.0 +0.0 0.0 0.0 +0.0 0.0 0.0 +0.0 0.0 0.0 +0.0 0.0 “WMR tactical deviation” legend: Overweight Underweight Neutral “Change” legend: p Upgrade q Downgrade *Refers to moderate-risk profile. 1 The current allocation column is the sum of the strategic asset allocation and the tactical deviation column. Source: UBS CIO WMR and WMA AAC, 22 January 2015. See appendix for information regarding sources of strategic asset allocations and their suitability, investor risk profiles, and the interpretation of the suggested tactical deviations from the strategic asset allocations. The “Changes this month” column reflects changes since 19 January 2015. For information on recent changes, see our UBS House View Updates: Tactical adjustments for a diverging world, 19 Jan 2015, and Oil prices fall further – tactical changes, 15 Dec 2014. FEBRUARY 2015 UBS HOUSE VIEW 25 DETAILED ASSET ALLOCATION Detailed asset allocation non-taxable without non-traditional assets 69.0 +1.0 70.0 57.0 +1.0 58.0 47.0 +0.5 55.0 -3.5 51.5 -5.0 37.0 0.0 +0.0 0.0 0.0 +0.0 10.0 +1.0 11.0 US IG 1–5 years 0.0 +2.0 US HY Corp 4.0 42.5 36.0 Current allocation1 Change this month WMR tactical deviation Strategic asset allocation 0.0 +0.0 0.0 38.5 29.0 +0.5 29.5 -6.0 26.0 -6.0 17.0 0.0 0.0 +0.0 0.0 0.0 +0.0 8.0 +2.0 10.0 6.0 +2.0 8.0 2.0 0.0 +2.0 2.0 0.0 +2.0 +1.5 5.5 7.0 +2.0 9.0 9.0 -3.0 6.0 8.0 -3.5 Int’l Developed Markets 7.0 -2.0 5.0 5.0 Emerging Markets 2.0 -1.0 1.0 3.0 23.0 -3.5 0.0 47.5 38.0 +0.5 Int’l Fixed Income 51.5 46.0 Current allocation1 0.0 +0.0 Change this month Benchmark allocation WMR tactical deviation Current allocation1 Change this month Strategic asset allocation US Fixed Income 32.0 -3.5 0.0 Aggressive 32.5 US IG total market 62.5 55.0 WMR tactical deviation Current allocation1 0.0 +0.0 Moderately aggressive -3.5 42.0 -2.5 0.0 78.0 US Municipal 76.0 65.0 Change this month 0.0 +0.0 WMR tactical deviation Change this month 0.0 Moderate Fixed Income US Gov’t -2.0 Strategic asset allocation 0.0 +0.0 Moderately conservative Current allocation1 Cash WMR tactical deviation Change this month* All figures in % Conservative Strategic asset allocation Investor risk profile 13.0 -6.0 7.0 0.0 0.0 +0.0 0.0 4.0 +2.0 6.0 3.0 +2.0 5.0 2.0 0.0 +2.0 2.0 0.0 +2.0 2.0 9.0 +2.5 11.5 11.0 +2.5 13.5 13.0 +2.5 15.5 4.5 8.0 -4.0 4.0 8.0 -4.0 4.0 7.0 -4.0 3.0 -2.0 3.0 4.0 -2.0 2.0 3.0 -2.0 1.0 2.0 -2.0 0.0 -1.5 1.5 4.0 -2.0 2.0 5.0 -2.0 3.0 5.0 -2.0 3.0 Equity 18.0 +2.0 20.0 31.0 +2.5 33.5 41.0 +3.5 44.5 50.0 +3.5 53.5 59.0 +3.5 62.5 US Equity 10.0 +2.0 12.0 18.0 +2.5 20.5 23.0 +3.5 26.5 28.0 +3.5 31.5 33.0 +3.5 36.5 US Large cap Growth 3.0 +0.0 3.0 5.5 +0.0 5.5 7.0 +0.0 7.0 8.5 +0.0 8.5 10.0 +0.0 10.0 US Large cap Value 3.0 +0.0 3.0 5.5 +0.0 5.5 7.0 +0.0 7.0 8.5 +0.0 8.5 10.0 +0.0 10.0 US Mid cap 3.0 +0.5 3.5 5.0 +0.5 5.5 6.0 +1.0 7.0 7.0 +1.0 8.0 9.0 +1.0 10.0 1.0 +1.5 2.5 2.0 +2.0 4.0 3.0 +2.5 5.5 4.0 +2.5 6.5 US Small cap International Equity 4.0 +2.5 6.5 22.0 26.0 +0.0 26.0 11.0 13.0 14.0 +1.0 15.0 9.0 12.0 -1.0 11.0 4.0 5.0 +0.0 5.0 8.0 13.0 +0.0 Int’l Developed Markets 4.0 +0.5 4.5 8.0 +1.0 9.0 Emerging Markets 4.0 -0.5 3.5 5.0 -1.0 4.0 8.0 -1.0 7.0 10.0 -1.0 4.0 +0.0 4.0 4.0 +0.0 4.0 4.0 +0.0 4.0 4.0 +0.0 Commodities 13.0 18.0 +0.0 18.0 22.0 +0.0 8.0 +0.0 10.0 +1.0 12.0 +1.0 “WMR tactical deviation” legend: Overweight Underweight Neutral “Change” legend: p Upgrade q Downgrade *Refers to moderate-risk profile. 1 The current allocation column is the sum of the strategic asset allocation and the tactical deviation column. Source: UBS CIO WMR and WMA AAC, 21 January 2015. See appendix for information regarding sources of strategic asset allocations and their suitability, investor risk profiles, and the interpretation of the suggested tactical deviations from the strategic asset allocations. The “Changes this month” column reflects changes since 22 January 2015. For information on recent changes, see our UBS House View Updates: Tactical adjustments for a diverging world, 19 Jan 2015, and Oil prices fall further – tactical changes, 15 Dec 2014. 26 UBS HOUSE VIEW FEBRUARY 2015 DETAILED ASSET ALLOCATION Detailed asset allocation all equity and all fixed income models Fixed Income 0.0 +0.0 0.0 95.0 US Fixed Income 0.0 +0.0 0.0 82.0 +6.0 -0.5 94.5 95.0 Current allocation1 5.0 +0.5 Change this month 5.5 WMR tactical deviation Strategic asset allocation All fixed income, non-taxable Current allocation1 5.0 +0.5 Change this month 2.0 WMR tactical deviation Strategic asset allocation -3.0 Change this month 5.0 All fixed income, taxable Current allocation1 Cash WMR tactical deviation All figures in % Strategic asset allocation All equity 5.5 -0.5 94.5 88.0 81.0 +6.5 87.5 US Gov’t – total market 0.0 +0.0 0.0 9.0 -5.5 3.5 16.0 -2.0 14.0 US Gov’t – 1~3 years 0.0 +0.0 0.0 0.0 +0.0 0.0 6.0 -1.0 5.0 US Gov’t – 3~7 years 0.0 +0.0 0.0 0.0 +0.0 0.0 14.0 -2.5 11.5 US Gov’t – 7~10 years 0.0 +0.0 0.0 0.0 +0.0 0.0 10.0 -1.5 8.5 US MBS 0.0 +0.0 0.0 0.0 +0.0 0.0 9.0 +0.0 9.0 US Munis – total market 0.0 +0.0 0.0 28.0 +1.5 29.5 0.0 +0.0 0.0 US Munis – short duration 0.0 +0.0 0.0 11.0 +0.0 11.0 0.0 +0.0 0.0 US Munis – long duration 0.0 +0.0 0.0 22.0 +1.0 23.0 0.0 +0.0 0.0 US IG – total market 0.0 +0.0 0.0 5.0 +2.0 7.0 10.5 +4.0 14.5 US IG 1~5 years 0.0 +0.0 0.0 0.0 +4.0 4.0 0.0 +4.0 4.0 US High Yield 0.0 +0.0 0.0 7.0 +3.0 10.0 15.5 +5.5 21.0 0.0 +0.0 0.0 13.0 -6.5 Int’l Fixed Income 6.5 14.0 -7.0 7.0 Int’l Developed Markets 0.0 +0.0 0.0 7.0 -3.5 3.5 7.0 -3.5 3.5 Emerging Markets 0.0 +0.0 0.0 6.0 -3.0 3.0 7.0 -3.5 3.5 Equity 95.0 +3.0 98.0 0.0 +0.0 0.0 0.0 +0.0 0.0 US Equity 54.0 +3.0 57.0 0.0 +0.0 0.0 0.0 +0.0 0.0 7.0 +0.0 7.0 0.0 +0.0 0.0 0.0 +0.0 0.0 7.0 0.0 +0.0 0.0 0.0 +0.0 0.0 12.5 0.0 +0.0 0.0 0.0 +0.0 0.0 US Large-cap Growth US Large-cap Value US Large-cap Total Market 7.0 +0.0 19.0 -6.5 IT sector 0.0 +3.0 Consumer discretionary 0.0 +3.0 Industrials sector 0.0 +0.0 p q 3.0 0.0 +0.0 0.0 0.0 +0.0 0.0 3.0 0.0 +0.0 0.0 0.0 +0.0 0.0 0.0 0.0 +0.0 0.0 0.0 +0.0 0.0 US Mid-cap Equity 14.0 +1.0 15.0 0.0 +0.0 0.0 0.0 +0.0 0.0 US Small-cap Equity 7.0 +2.5 9.5 0.0 +0.0 0.0 0.0 +0.0 0.0 41.0 +0.0 41.0 0.0 +0.0 0.0 0.0 +0.0 0.0 23.5 -2.0 21.5 0.0 +0.0 0.0 0.0 +0.0 0.0 0.0 +3.0 3.0 0.0 +0.0 0.0 0.0 +0.0 0.0 International Equity Int’l Developed Markets Eurozone currency hedged Global EM Equity -7.0 10.5 0.0 +0.0 0.0 0.0 +0.0 0.0 India 17.5 0.0 +3.0 3.0 0.0 +0.0 0.0 0.0 +0.0 0.0 Taiwan 0.0 +3.0 3.0 0.0 +0.0 0.0 0.0 +0.0 0.0 “WMR tactical deviation” legend: Overweight Underweight Neutral 1 The current allocation column is the sum of the strategic asset allocation and the tactical deviation column. Source: UBS CIO WMR and WMA AAC, 22 January 2015. See appendix for information regarding sources of strategic asset allocations and their suitability, investor risk profiles and the interpretation of the suggested tactical deviations from the strategic asset allocations. Publication note The All Equity and All Fixed Income portfolios complement our balanced portfolios and offer more granular implementation of our House View. While we generally do not recommend that investors hold portfolios consisting of only stocks or only bonds, the All Equity and All Fixed Income portfolios can be used by investors who want to complement their existing holdings. It is also possible to combine the All Equity portfolio with one of the All Fixed Income portfolios to generate a balanced portfolio. The tactical tilts in the portfolios are based on the corresponding tilts in our balanced portfolios (moderate risk profile, without alternative investments). A special feature of the All Equity portfolio is that it includes “carve-outs”: 3% allocations to our preferred sectors within US large-caps as well as our preferred countries within both international developed markets and the emerging markets. A maximum of two sectors/countries of each type may be selected for carve-outs. The amount of cash in the All Equity portfolio will vary one-for-one with the overall overweight/underweight on equities in the balanced portfolio, subject to a 3% maximum. This allows us to express a tactical preference between stocks and bonds. The All Fixed Income portfolios include both taxable and non-taxable versions. These are based on the fixed income portion of the balanced portfolios, with the non-taxable version incorporating an additional allocation to Mortgage Backed Securities. In addition, the All Fixed Income portfolios include allocations to government bonds (Munis in the taxable version, Treasuries in the non-taxable version) of different maturities, allowing views on duration to be expressed. Cash is set at 5% of the portfolios, with small deviations possible due to rounding. The “Changes this month” column reflects changes since 19 January 2015. For information on recent changes, see our UBS House View Updates: Tactical adjustments for a diverging world, 19 Jan 2015, and Oil prices fall further – tactical changes, 15 Dec 2014. FEBRUARY 2015 UBS HOUSE VIEW 27 Portfolio Analytics The portfolio analytics shown for each risk profile’s benchmark allocations are based on estimated forward-looking return and standard deviation assumptions (capital market assumptions), which are based on UBS proprietary research. The development process includes a review of a variety of factors, including the return, risk, correlations and historical performance of various asset classes, inflation and risk premium. These capital market assumptions do not assume any particular investment time horizon. The process assumes a situation where the supply and demand for investments is in balance, and in which expected returns of all asset classes are a reflection of their expected risk and correlations regardless of time frame. Please note that these assumptions are not guarantees and are subject to change. UBS has changed its risk and return assumptions in the past and may do so in the future. Neither UBS nor your Financial Advisor is required to provide you with an updated analysis based upon changes to these or other underlying assumptions. Risk Profile ==>> In order to create the analysis shown, the rates of return for each asset class are combined in the same proportion as the asset allocations illustrated (e.g., if the asset allocation indicates 40% equities, then 40% of the results shown for the allocation will be based upon the estimated hypothetical return and standard deviation assumptions shown below). You should understand that the analysis shown and assumptions used are hypothetical estimates provided for your general information. The results are not guarantees and pertain to the asset allocation and/or asset class in general, not the performance of specific securities or investments. Your actual results may vary significantly from the results shown in this report, as can the performance of any individual security or investment. Moderately Moderately Conservative conservative Moderate aggressive Aggressive Taxable with non-traditional assets Estimated Return 4.4% 5.1% 5.9% 6.4% 7.0% Estimated Risk 5.6% 7.4% 9.6% 11.5% 13.5% Taxable without non-traditional assets Estimated Return 4.0% 4.8% 5.5% 6.1% 6.8% Estimated Risk 5.4% 7.5% 9.5% 11.5% 13.5% Non-taxable with non-traditional assets Estimated Return 4.3% 5.0% 5.8% 6.4% 7.0% Estimated Risk 5.5% 7.4% 9.5% 11.4% 13.4% Non-taxable without non-traditional assets Asset Class Annual risk US Cash 2.5% 0.5% US Government Fixed Income 2.2% 4.3% US Municipal Fixed Income 2.9% 4.7% US Corporate Investment Grade Fixed Income 3.5% 5.9% US Corporate High Yield Fixed Income 5.6% 11.7% International Developed Markets Fixed Income 4.0% 9.0% Emerging Markets Fixed Income 4.9% 9.1% US Large Cap Equity 7.5% 16.8% US Mid Cap Equity 8.4% 19.6% US Small Cap Equity 8.6% 21.8% International Developed Markets Equity 8.5% 19.7% 10.0% 25.5% Commodities 6.4% 18.9% Hedge Funds 6.2% 6.7% Private Equity 11.8% 24.4% 8.5% 11.8% Emerging Markets Equity Estimated Return 4.0% 4.8% 5.5% 6.1% 6.8% Estimated Risk 5.4% 7.5% 9.5% 11.4% 13.5% Private Real Estate 28 UBS HOUSE VIEW FEBRUARY 2015 Capital Market Assumptions Annual total return DETAILED ASSET ALLOCATION Additional Asset Allocation Models US equity industry group allocation, in % S&P 500 Benchmark allocation1 Consumer Discretionary CIO WMR Tactical deviation2 Numeric Symbol Previous Current Previous Current Current allocation3 13.9 11.9 +1.0 +2.0 + ++ Auto & Components 1.0 +0.0 +0.0 n n 1.0 Consumer, Durables & Apparel 1.3 +0.0 +1.0 n + 2.3 Consumer Services 1.7 +0.0 +0.0 n n 1.7 Media 3.4 +0.0 +0.0 n n 3.4 Retailing 4.3 +1.0 +1.0 + + 5.3 Consumer Staples 10.2 -2.0 +0.0 –– n 10.2 Food, Beverage & Tobacco 5.5 -0.5 +0.0 – n 5.5 Food & Staples Retailing 2.6 -1.0 +0.0 – n 2.6 Household & Personal Products 2.1 -0.5 +0.0 – n 2.1 Energy 8.3 +0.0 +0.0 n n 8.3 16.0 +1.0 +0.0 + n 16.0 Banks 5.6 +1.0 +1.0 + + 6.6 Diversified Financials 5.1 +0.5 +0.0 + n 5.1 Insurance 2.7 +0.5 +0.0 + n 2.7 Real Estate 2.6 -1.0 -1.0 – – 1.6 14.8 +0.0 +0.0 n n 14.8 Financials Healthcare HC Equipment & Services 4.8 +0.0 +0.0 n n 4.8 Pharmaceuticals & Biotechnology 10.0 +0.0 +0.0 n n 10.0 Industrials 10.3 +2.5 +1.0 +++ + 11.3 Capital Goods 7.5 +1.0 +0.0 + n 7.5 Commercial Services & Supplies 0.6 +0.0 +0.0 n n 0.6 Transportation 2.2 +1.5 +1.0 ++ + Information Technology 19.5 +2.0 +2.0 ++ ++ 21.5 3.2 Software & Services 10.3 +1.0 +1.0 + + 11.3 Technology Hardware & Equipment 6.8 +1.0 +1.0 + + 7.8 Semiconductors 2.5 +0.0 +0.0 n n 2.5 Materials 3.2 +0.0 -1.0 n – 2.2 Telecom 2.4 -2.0 -2.0 –– –– 0.4 Utilities 3.4 -2.5 -2.0 ––– –– 1.4 Source: S&P, UBS CIO WMR, as of 22 January 2015 The benchmark allocation, as well as the tactical deviations, are intended to be applicable to the US equity portion of a portfolio across investor risk profiles. 1 The benchmark allocation is based on S&P 500 weights. 2 See “Deviations from Benchmark Allocations” in the appendix for an explanation regarding the interpretation of the suggested tactical deviations from benchmark. The “current” column refers to the tactical deviation that applies as of the date of this publication. The “previous” column refers to the tactical deviation that was in place at the date of the previous edition of the Investment Strategy Guide or the last Investment Strategy Guide Update. 3 The current allocation column is the sum of the S&P 500 benchmark allocation and the CIO WMR tactical deviation columns. FEBRUARY 2015 UBS HOUSE VIEW 29 DETAILED ASSET ALLOCATION Additional Asset Allocation Models US Taxable Fixed Income Allocation, in % Benchmark allocation1 CIO WMR Tactical deviation2 Previous Current Current allocation3 Treasuries 25 -5 -5 20 Treasury Inflation Protected Securities (TIPS) 19 -5 -5 14 Agencies 11 -2 -2 9 Agency Mortgage-Backed Securities 13 0 0 13 0 0 4 4 Investment Grade Corporates 13 4 4 17 High-Yield Corporates 14 8 4 18 5 0 0 5 Investment Grade Corporates 1 yr–5 yr Preferred Securities Source: UBS CIO WMR, as of 21 January 2015 Note: On 15 December 2014, the high-yield corporate bond allocation was reduced and an allocation for US investment grade corporate bonds (1 – 5 years) was introduced. For more information, see “UBS House View Update: Oil prices fall further – tactical changes,” 16 December 2014. International Developed Markets (Non-US) Equity Module, in % EMU / Eurozone Benchmark allocation1 28.0 UK 20.0 Japan CIO WMR Tactical deviation2 Previous Current +2.0 +10.0 -10.0 Current allocation3 38.0 -2.0 18.0 17.0 19.0 +2.0 -2.0 Australia 7.0 +2.0 -2.0 5.0 Canada 9.0 +2.0 -2.0 7.0 Switzerland 8.0 +2.0 -2.0 6.0 Other 9.0 +0.0 +0.0 9.0 WMR Tactical deviation2 Previous Current -10.0 -10.0 Current allocation3 Source: UBS CIO WMR, as of 21 January 2015 International Developed Markets (Non-US) Fixed Income Module, in % EMU / Eurozone UK Benchmark allocation1 42.0 32.0 9.0 +15.0 +15.0 24.0 Japan 32.0 +0.0 +0.0 32.0 Other 17.0 -5.0 -5.0 12.0 Source: UBS CIO WMR, as of 21 January 2015 The benchmark allocation refers to a moderate risk profile. For the second and third tables on this page, it represents the relative market capitalization weights of each country or region. See “Deviations from strategic asset allocation or benchmark allocation” in the appendix for an explanation regarding the interpretation of the suggested tactical deviations from benchmark. The “current” column refers to the tactical deviation that applies as of the date of this publication. The “previous” column refers to the tactical deviation that was in place at the date of the previous edition of the Investment Strategy Guide or the last Investment Strategy Guide Update. 3 The current allocation column is the sum of the benchmark allocation and the tactical deviation columns. 1 2 30 UBS HOUSE VIEW FEBRUARY 2015 PERFORMANCE MEASUREMENT Tactical Asset Allocation Performance Measurement The performance calculations shown in Table A commence on 25 January 2013, the first date upon which the Investment Strategy Guide was published following the release of the new UBS WMA strategic asset allocation (SAA) models. The performance is based on the SAA without non-traditional assets for a moderate risk profile investor, and the SAA with the tactical shift (see detailed asset allocation tables where the SAA with the tactical shift is referred to as “current allocation”). Performance is calculated utilizing the returns of the indices identified in Table B as applied to the respective allocations in the SAA and the SAA with the tactical shift. For example, if US Mid Cap Equity is allocated 10% in the SAA and 12% in the SAA with the tactical shift, the US Mid Cap Equity index respectively contributed to 10% and 12% of the results shown. Prior to 25 January 2013, CIO WMR published tactical asset allocation recommendations in the Investment Strategy Guide using a different set of asset classes and sectors. The performance of these tactical recommendations is reflected in Table C. The performance attributable to the CIO WMR tactical deviations is reflected in the column in Tables A and C labeled “Excess return,” which shows the difference between the performance of the SAA and the performance of the SAA with the tactical shift. The “Information ratio” is a riskadjusted performance measure, which adjusts the excess returns for the tracking error risk of the tactical deviations. Specifically the information ratio is calculated as the ratio of the annualized excess return over a given time period and the annualized standard deviation of daily excess returns over the same period. Additional background information regarding the computation of the information ratio figures provided below are available upon request. The calculations assume that the portfolios are rebalanced whenever changes are made to tactical deviations, typically upon publication of the Investment Strategy Guide on a monthly basis. Occasionally, changes in the tactical deviations are made intra-month when warranted by market conditions and communicated through an Investment Strategy Guide Update. The computations assume portfolio rebalancing upon such intra-month changes as well. Performance shown is based on total returns, but does not include transaction costs, such as commissions, fees, margin interest, and interest charges. Actual total returns adjusted for such transaction costs will be reduced. A complete record of all the recommendations upon which this performance report is based is available from UBS Financial Services Inc. upon written request. Past performance is not an indication of future results. Table A: Moderate Risk Profile Performance Measurement (25 January 2013 to present) SAA SAA with tactical shift Excess return Information ratio (annualized) Russell 3000 stock index (total return) Barclays Capital US Aggregate bond index (total return) 25 January 2013 to 31 March 2013 0.79% 0.83% 0.04% +0.9 5.59% 0.11% 31 March 2013 to 28 June 2013 -2.18% -2.14% 0.04% +0.3 2.69% -2.33% 28 June 2013 to 30 September 2013 3.60% 3.86% 0.26% +2.4 6.35% 0.57% 30 September 2013 to 31 December 2013 3.05% 3.23% 0.18% +2.9 10.10% -0.14% 31 December 2013 to 31 March 2014 2.56% 2.50% -0.06% -0.3 1.97% 1.84% 31 March 2014 to 30 June 2014 3.44% 3.53% 0.08% +0.5 4.87% 2.04% 30 June 2014 to 30 September 2014 -1.54% -1.70% -0.16% -1.2 0.01% 0.17% 30 September 2014 to 19 November 2014 0.92% 1.12% 0.20% +1.8 4.16% 0.89% 31 December 2014 to 22 January 2015 0.70% 0.62% -0.09% -1.6 0.24% 1.16% 10.95% 11.59% 0.63% +0.6 41.44% 3.13% Since inception (25 January 2013) Source: CIO WMR, as of 22 January 2014 FEBRUARY 2015 UBS HOUSE VIEW 31 PERFORMANCE MEASUREMENT Tactical Asset Allocation Performance Measurement Table B: SAA for moderate risk profile investor, and underlying indices (all figures in %) 25 Jan 2013 to present US Large Cap Growth (Russell 1000 Growth) 7.0 US Large Cap Value (Russell 1000 Value) 7.0 US Mid Cap (Russell Mid Cap) 6.0 US Small Cap (Russell 2000) 3.0 International Dev. Eq (MSCI EAFE) 10.0 Emerging Markets Eq. (MSCI EMF) 7.5 US Government Fixed Income (BarCap US Agg Government) US Municipal Fixed Income (BarCap Municipal Bond) US Investment Grade Fixed Income (BarCap US Agg Credit) 5.0 35.0 3.0 US Corporate High Yield Fixed Income (BarCap US Agg Corp HY) 4.0 International Dev. Fixed Income (BarCap Global Agg xUS) 4.0 Emerging Markets Fixed Income (50% BarCap EM Gov and 50% BarCap Global EM (USD)) 3.5 Commodities (Dow Jones-UBS Commodity Index) 5.0 Source: CIO WMR The performance calculations shown in Table C, which start on 25 August 2008 and end on 24 January 2013, have been provided for historical information purposes only. They are based on prior SAAs (referred to as benchmark allocations) with non-traditional assets for a moderate risk profile investor, and on prior SAAs with tactical shifts as published in the Investment Strategy Guide during the same time period. Performance is calculated utilizing the returns of the indices identified in Table D as applied to the respective allocations in the SAA and the SAA with the tactical shift. See the discussion in connection with Table A, previous page, regarding the meanings of the “Excess return” and “Information ratio” columns and how the “Information ratio” column is calculated. 32 UBS HOUSE VIEW FEBRUARY 2015 From 25 August 2008 through 27 May 2009, the Investment Strategy Guide had at times published a more detailed set of tactical deviations, whereby the categories “Non-US Developed Equities” and “Non-US Fixed Income” were further subdivided into regional blocks. Only the cumulative recommendations at the level of “Non-US Developed Equities” and “Non-US Fixed Income” were taken into account in calculating the performance shown in Table C opposite. Prior to 25 August 2008, WMR published tactical asset allocation recommendations in the “US Asset Allocation Strategist” using a less comprehensive set of asset classes and sectors, which makes a comparison with the subsequent models difficult. PERFORMANCE MEASUREMENT Tactical Asset Allocation Performance Measurement Table C: Moderate Risk Profile Performance Measurement (25 August 2008 to 24 January 2013) Benchmark Allocations (SAA) Benchmark Allocation (SAA) with tactical shift 25 Aug 08 to 31 Dec 08 Excess Information ratio return (annualized) Russell 3000 stock index (total return) Barclays Capital US Aggregate bond index (total return) -16.59% -15.64% 0.96% +2.0 -29.00% 3.33% 2009 Q1 -5.52% -5.45% 0.07% +0.3 -10.80% 0.12% 2009 Q2 11.18% 11.37% 0.18% +1.0 16.82% 1.78% 2009 Q3 10.44% 11.07% 0.63% +2.1 16.31% 3.74% 2009 Q4 2.99% 3.30% 0.31% +1.1 5.90% 0.20% 2010 Q1 2.74% 2.56% -0.18% -0.9 5.94% 1.78% 2010 Q2 -4.56% -4.87% -0.31% -1.4 -11.32% 3.49% 2010 Q3 8.34% 7.99% -0.35% -2.1 11.53% 2.48% 2010 Q4 5.18% 5.17% -0.01% -0.1 11.59% -1.30% 2011 Q1 3.23% 3.15% -0.08% -0.4 6.38% 0.42% 2011 Q2 0.62% 0.47% -0.16% -0.9 -0.03% 2.29% 2011 Q3 -7.65% -8.56% -0.90% -2.5 -15.28% 3.82% 2011 Q4 4.66% 4.39% -0.27% -0.8 12.12% 1.12% 2012 Q1 5.89% 5.41% -0.48% -2.3 12.87% 0.30% 2012 Q2 -1.59% -1.57% 0.02% +0.2 -3.15% 2.06% 2012 Q3 4.18% 4.08% -0.10% -1.1 6.23% 1.59% 2012 Q4 0.69% 0.65% -0.04% -0.7 0.25% 0.21% 01 Jan 13 to 24 Jan 13 2.17% 2.20% 0.03% +2.5 5.19% -0.23% 24.86% 24.10% -0.76% -0.1 31.81% 30.76% Since inception Source: CIO WMR Table D: SAAs for moderate risk profile investor, and underlying indices (all figures in %) 25 Aug 2008 to 23 Feb 2009 24 Feb 2009 to 24 Jan 2013 US Large Cap Value (Russell 1000 Value) 12.5 US Large Cap Value (Russell 1000 Value) 11.0 US Large Cap Growth (Russell 1000 Growth) 12.5 US Large Cap Growth (Russell 1000 Growth) 11.0 US Small Cap Value (Russell 2000 Value) 2.0 US Mid Cap (Russell Midcap) 5.0 US Small Cap Growth (Russell 2000 Growth) 2.0 US Small Cap (Russell 2000) 3.0 US REITs (FTSE NAREIT All REITs) 1.5 US REITs (FTSE NAREIT All REITs) Non-US Dev. Eq (MSCI Gross World ex-US) Emerging Markets Eq. (MSCI Gross EM USD) US Fixed Income (BarCap US Aggregate) 10.5 2.0 Developed Markets (MSCI Gross World ex-US) 10.0 2.0 Emerging Markets (MSCI Gross EM USD) 2.0 30.0 US Fixed Income (BarCap US Aggregate) 29.0 Non-US Fixed Income (BarCap Global Aggregate ex-USD) 8.0 Non-US Fixed Income (BarCap Global Aggregate ex-USD) Cash (JP Morgan Cash Index USD 1 month) 2.0 Cash (JP Morgan Cash Index USD 1 month) 2.0 Commodities (DJ UBS total return index) 5.0 Commodities (DJ UBS total return index) 5.0 Alternative Investments (HFRX Equal Weighted Strategies) 12.0 Alternative Investments (HFRX Equal Weighted Strategies) 8.0 12.0 Source: CIO WMR FEBRUARY 2015 UBS HOUSE VIEW 33 APPENDIX Investment Committee Global Investment Process and Committee Description The UBS investment process is designed to achieve replicable, high quality results through applying intellectual rigor, strong process governance, clear responsibility and a culture of challenge. Based on the analyses and assessments conducted and vetted throughout the investment process, the Chief Investment Officer (CIO) formulates the UBS Wealth Management Investment House View (e.g., overweight, neutral, underweight stance for asset classes and market segments relative to their benchmark allocation) at the Global Investment Committee (GIC). Senior investment professionals from across UBS, complemented by selected external experts, debate and rigorously challenge the investment strategy to ensure consistency and risk control. Global Investment Committee Composition The GIC is comprised of 13 members, representing top market and investment expertise from across all divisions of UBS: Mark Haefele (Chair) Mark Andersen • Andreas Höfert • Jorge Mariscal • Mads Pedersen • Mike Ryan • Simon Smiles • Tan Min Lan • Themis Themistocleus • Larry Hatheway (*) • Bruno Marxer (*) • Curt Custard (*) • Andreas Koester (*) (*) Business areas distinct from Chief Investment Office/ Wealth Management Research • • 34 UBS HOUSE VIEW FEBRUARY 2015 WMA Asset Allocation Committee Description We recognize that a globally derived house view is most effective when complemented by local perspective and application. As such, UBS has formed a Wealth Management Americas Asset Allocation Committee (WMA AAC). WMA AAC is responsible for the development and monitoring of UBS WMA’s strategic asset allocation models and capital market assumptions. The WMA AAC sets parameters for the CIO WMR Americas Investment Strategy Group to follow during the translation process of the GIC’s House Views and the incorporation of US-specific asset class views into the USspecific tactical asset allocation models. WMA Asset Allocation Committee Composition The WMA Asset Allocation Committee is comprised of six members: Mike Ryan Michael Crook • Stephen Freedman • Richard Hollmann (*) • Brian Nick • Jeremy Zirin (*) Business areas distinct from Chief Investment Office/ Wealth Management Research • • APPENDIX Explanations about Asset Classes Sources of strategic asset allocations and investor risk profiles Strategic asset allocations represent the longer-term allocation of assets that is deemed suitable for a particular investor. The strategic asset allocation models discussed in this publication, and the capital market assumptions used for the strategic asset allocations, were developed and approved by the WMA AAC. The strategic asset allocations are provided for illustrative purposes only and were designed by the WMA AAC for hypothetical US investors with a total return objective under five different Investor Risk Profiles ranging from conservative to aggressive. In general, strategic asset allocations will differ among investors according to their individual circumstances, risk tolerance, return objectives and time horizon. Therefore, the strategic asset allocations in this publication may not be suitable for all investors or investment goals and should not be used as the sole basis of any investment decision. Minimum net worth requirements may apply to allocations to non-traditional assets. As always, please consult your UBS Financial Advisor to see how these weightings should be applied or modified according to your individual profile and investment goals. The process by which the strategic asset allocations were derived is described in detail in the publication entitled “UBS WMA’s Capital Markets Model: Explained, Part II: Methodology,” published on 22 January 2013. Your Financial Advisor can provide you with a copy. Deviations from strategic asset allocation or benchmark allocation The recommended tactical deviations from the strategic asset allocation or benchmark allocation are provided by the Global Investment Committee and the Investment Strategy Group within Wealth Management Research Americas. They reflect the short- to medium-term assessment of market opportunities and risks in the respective asset classes and market segments. Positive / zero / negative tactical deviations correspond to an overweight / neutral / underweight stance for each respective asset class and market segment relative to their strategic allocation. The current allocation is the sum of the strategic asset allocation and the tactical deviation. Note that the regional allocations on the International Equities page are provided on an unhedged basis (i.e., it is assumed that investors carry the underlying currency risk of such investments). Thus, the deviations from the strategic asset allocation reflect the views of the underlying equity and bond markets in combination with the assessment of the associated currencies. The detailed asset allocation tables integrate the country preferences within each asset class with the asset class preferences stated earlier in the report. Scale for tactical deviation charts Symbol Description/Definition Symbol Description/Definition Symbol Description/Definition + moderate overweight vs. benchmark – moderate underweight vs. benchmark n neutral, i.e., on benchmark ++ overweight vs. benchmark –– underweight vs. benchmark n/a not applicable +++ strong overweight vs. benchmark ––– strong underweight vs. benchmark Source: CIO WM Research FEBRUARY 2015 UBS HOUSE VIEW 35 APPENDIX Appendix Emerging Market Investments Investors should be aware that Emerging Market assets are subject to, among others, potential risks linked to currency volatility, abrupt changes in the cost of capital and the economic growth outlook, as well as regulatory and sociopolitical risk, interest rate risk and higher credit risk. Assets can sometimes be very illiquid and liquidity conditions can abruptly worsen. WMR generally recommends only those securities it believes have been registered under Federal US registration rules (Section 12 of the Securities Exchange Act of 1934) and individual State registration rules (commonly known as “Blue Sky” laws). Prospective investors should be aware that to the extent permitted under US law, WMR may from time to time recommend bonds that are not registered under US or State securities laws. These bonds may be issued in jurisdictions where the level of required disclosures to be made by issuers is not as frequent or complete as that required by US laws. For more background on emerging markets generally, see the WMR Education Notes “Investing in Emerging Markets (Part 1): Equities,” 27 August 2007, “Emerging Market Bonds: Understanding Emerging Market Bonds,” 12 August 2009 and “Emerging Markets Bonds: Understanding Sovereign Risk,” 17 December 2009. Investors interested in holding bonds for a longer period are advised to select the bonds of those sovereigns with the highest credit ratings (in the investment grade band). Such an approach should decrease the risk that an investor could end up holding bonds on which the sovereign has defaulted. Subinvestment grade bonds are recommended only for clients with a higher risk tolerance and who seek to hold higher-yielding bonds for shorter periods only. Nontraditional Assets Nontraditional asset classes are alternative investments that include hedge funds, private equity, real estate, and managed futures (collectively, alternative investments). Interests of alternative investment funds are sold only to qualified investors, and only by means of offering documents that include information about the risks, performance and expenses of alternative investment funds, and which clients are urged to read carefully before subscribing and retain. An investment in an alternative investment fund is speculative and involves significant risks. Specifically, these investments (1) are not mutual funds and are not subject to the same regulatory requirements as mutual funds; (2) may have performance that is volatile, and investors may lose all or a substantial amount of their investment; (3) may engage in leverage and other speculative investment practices that may increase the risk of investment loss; (4) are long-term, illiquid investments; there is generally no secondary market for the interests of a fund, and none is expected to develop; (5) interests of alternative investment funds typically will be illiquid and subject to restrictions on transfer; (6) may not be required to provide periodic pricing or valuation information to investors; (7) generally involve complex tax strategies and there may be delays in distributing tax information to investors; (8) are subject to high fees, including management fees and other fees and expenses, all of which will reduce profits. Interests in alternative investment funds are not deposits or obligations of, or guaranteed or endorsed by, any bank or other insured depository institution, and are not federally insured by the Federal Deposit Insurance Corporation, the Federal Reserve Board, or any other governmental agency. Prospective investors should understand these risks and have the 36 UBS HOUSE VIEW FEBRUARY 2015 financial ability and willingness to accept them for an extended period of time before making an investment in an alternative investment fund and should consider an alternative investment fund as a supplement to an overall investment program. In addition to the risks that apply to alternative investments generally, the following are additional risks related to an investment in these strategies: •Hedge Fund Risk: There are risks specifically associated with investing in hedge funds, which may include risks associated with investing in short sales, options, small-cap stocks, “junk bonds,” derivatives, distressed securities, non-US securities and illiquid investments. •Managed Futures: There are risks specifically associated with investing in managed futures programs. For example, not all managers focus on all strategies at all times, and managed futures strategies may have material directional elements. •Real Estate: There are risks specifically associated with investing in real estate products and real estate investment trusts. They involve risks associated with debt, adverse changes in general economic or local market conditions, changes in governmental, tax, real estate and zoning laws or regulations, risks associated with capital calls and, for some real estate products, the risks associated with the ability to qualify for favorable treatment under the federal tax laws. •Private Equity: There are risks specifically associated with investing in private equity. Capital calls can be made on short notice, and the failure to meet capital calls can result in significant adverse consequences including, but not limited to, a total loss of investment. •Foreign Exchange/Currency Risk: Investors in securities of issuers located outside of the United States should be aware that even for securities denominated in US dollars, changes in the exchange rate between the US dollar and the issuer’s “home” currency can have unexpected effects on the market value and liquidity of those securities. Those securities may also be affected by other risks (such as political, economic or regulatory changes) that may not be readily known to a US investor. APPENDIX Disclaimer Chief Investment Office (CIO) Wealth Management (WM) Research is published by UBS Wealth Management and UBS Wealth Management Americas, Business Divisions of UBS AG (UBS) or an affiliate thereof. CIO WM Research reports published outside the US are branded as Chief Investment Office WM. In certain countries UBS AG is referred to as UBS SA. This publication is for your information only and is not intended as an offer, or a solicitation of an offer, to buy or sell any investment or other specific product. The analysis contained herein does not constitute a personal recommendation or take into account the particular investment objectives, investment strategies, financial situation and needs of any specific recipient. It is based on numerous assumptions. Different assumptions could result in materially different results. We recommend that you obtain financial and/or tax advice as to the implications (including tax) of investing in the manner described or in any of the products mentioned herein. Certain services and products are subject to legal restrictions and cannot be offered worldwide on an unrestricted basis and/or may not be eligible for sale to all investors. All information and opinions expressed in this document were obtained from sources believed to be reliable and in good faith, but no representation or warranty, express or implied, is made as to its accuracy or completeness (other than disclosures relating to UBS and its affiliates). All information and opinions as well as any prices indicated are current only as of the date of this report, and are subject to change without notice. Opinions expressed herein may differ or be contrary to those expressed by other business areas or divisions of UBS as a result of using different assumptions and/or criteria. At any time, investment decisions (including whether to buy, sell or hold securities) made by UBS AG, its affiliates, subsidiaries and employees may differ from or be contrary to the opinions expressed in UBS research publications. Some investments may not be readily realizable since the market in the securities is illiquid and therefore valuing the investment and identifying the risk to which you are exposed may be difficult to quantify. UBS relies on information barriers to control the flow of information contained in one or more areas within UBS, into other areas, units, divisions or affiliates of UBS. Futures and options trading is considered risky. Past performance of an investment is no guarantee for its future performance. Some investments may be subject to sudden and large falls in value and on realization you may receive back less than you invested or may be required to pay more. Changes in FX rates may have an adverse effect on the price, value or income of an investment. This report is for distribution only under such circumstances as may be permitted by applicable law. Distributed to US persons by UBS Financial Services Inc., a subsidiary of UBS AG. UBS Securities LLC is a subsidiary of UBS AG and an affiliate of UBS Financial Services Inc. UBS Financial Services Inc. accepts responsibility for the content of a report prepared by a non-US affiliate when it distributes reports to US persons. All transactions by a US person in the securities mentioned in this report should be effected through a US-registered broker dealer affiliated with UBS, and not through a non-US affiliate. The contents of this report have not been and will not be approved by any securities or investment authority in the United States or elsewhere. UBS specifically prohibits the redistribution or reproduction of this material in whole or in part without the prior written permission of UBS and UBS accepts no liability whatsoever for the actions of third parties in this respect. Version as per May 2014. © UBS 2015. The key symbol and UBS are among the registered and unregistered trademarks of UBS. All rights reserved. FEBRUARY 2015 UBS HOUSE VIEW 37 Publication details Publisher UBS Financial Services Inc. Wealth Management Research 1285 Avenue of the Americas, 20th Floor New York, NY 10019 This report was published on 23 January 2015. Lead authors Mark Haefele Mike Ryan Authors (in alphabetical order) Manish Bangard Thomas Berner Michael Crook Leslie Falconio Andrea Fisher Thomas Flury Stephen Freedman Ricardo Garcia Markus Irngartinger Katie Klingensmith David Lefkowitz Barry McAlinden Thomas McLoughlin Kathleen McNamara Jon Rather Brian Rose Dominic Schnider Philipp Schoettler Giovanni Staunovo Gary Tsang Thomas Veraguth Thomas Wacker Jeremy Zirin Editor CLS Communication, Inc. Project Management Paul Leeming John Collura Drew Gilmore Natalie Weinberg Desktop Publishing George Stilabower Cognizant Group – Basavaraj Gudihal, Srinivas Addugula, Pavan Mekala and Virender Negi 38 UBS HOUSE VIEW FEBRUARY 2015 UBS House View Monthly Call A unique opportunity to hear the House View explained and to interact directly with CIO WMR’s thought leaders. The next call will be on: Thursday, February 5, at 1:00 PM ET / 10:00 AM PT A discussion of the current UBS House View Dial in: 1-855-UBS-MKTS (827-6587) Verbal passcode: Market ©2015 UBS Financial Services Inc. All rights reserved. Member SIPC. All other trademarks, registered trademarks, service marks and registered service marks are of their respective companies. UBS Financial Services Inc. www.ubs.com/financialservicesinc UBS Financial Services Inc. is a subsidiary of UBS AG. ab

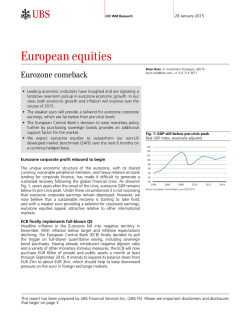
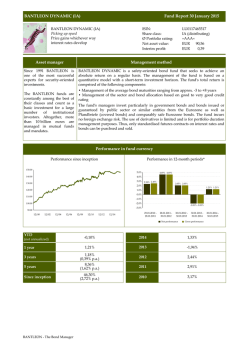
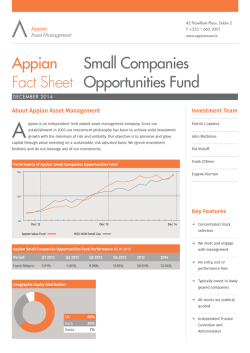


© Copyright 2026