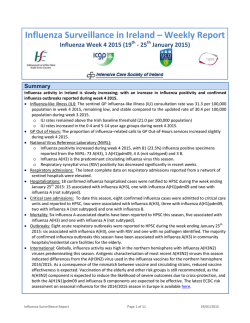
National flu report surveillance graphs: 29 January 2015
PHE Influenza Surveillance graphs
•
•
Influenza activity in the United Kingdom is monitored using a variety of
surveillance systems. The National Influenza Report which interprets the data is
published weekly.
National and subnational outputs from the various surveillance systems are
grouped according to the following categories:
–
–
–
–
–
–
Community influenza surveillance
Influenza-like illness GP consultation rates
Influenza-confirmed hospitalisations
All-cause mortality
Microbiological surveillance
Influenza vaccination
Respiratory Diseases Department
Centre for Infectious Disease Surveillance and Control
Public Health England
[email protected]
29 January 2015
→ NEXT
Community influenza surveillance
29 January 2015
Return to main menu
Number of acute respiratory outbreaks by institution, UK
100
Care home
Hospital
Other
School
90
80
Number
70
60
50
40
30
20
10
0
40
44
48
52
4
8
12
16
20
Week number of first case onset
29 January 2015
Return to main menu
Outbreaks (table by PHE Region)
Outbreaks reported in Week 5
Cumulative since Week 40
PHE North of England
8
107
PHE Midlands and East of
England
24
200
PHE London
1
25
PHE South of England
12
81
29 January 2015
Return to main menu
FluSurvey ILI incidence by age group, UK
0.5
<20yrs
20-44yrs
45+yrs
ILI incidence
0.4
0.3
0.2
0.1
0
47
48
49
50
51
52
1
2
3
4
5
6
7
8
9
10
11
12
13
14
15
Week number
29 January 2015
Return to main menu
Influenza-like illness GP consultation rates
29 January 2015
Return to main menu
GP In Hours ILI consultation rate, England
50
45
40
Rate per 100,000
35
2012/13
30
2013/14
2014/15
25
20
15
10
5
0
40
42
44
46
48
50
52
2
4
6
8
10
12
14
16
18
20
Week number
29 January 2015
Return to main menu
ILI/influenza – RCGP (England and Wales), Scotland, Wales
and Northern Ireland
Scotland
Wales
Northern Ireland
300
Rate per 100 000
250
200
150
100
50
0
40
44
48
52
4
8
12
16
20
24
28
32
36
Week number
NB. Scottish rates are weekly averages of daily data.
29 January 2015
Return to main menu
Influenza-confirmed hospitalisations
29 January 2015
Return to main menu
Weekly ICU/HDU influenza admission rate
per 100,000 trust catchment population ,
England, since week 40 2014
0.4
140
Number of admissions
Admission rate/100,000 (2013/14)
120
100
80
0.2
60
40
Number of admissions
Admission rate/100,00
Admission rate/100,000 (2014/15)
0.3
0.1
20
0
0
40
44
48
52
4
8
12
16
20
Week Number
29 January 2015
Return to main menu
Weekly ICU/HDU influenza admission rate
per 100,000 trust catchment population by
PHE region, since week 40 2014
1
Rate of ICU or HDU admission/100,000
0.9
South
North
Midlands and East of England
London
0.8
0.7
0.6
0.5
0.4
0.3
0.2
0.1
0
40
42
44
46
48
50
52
2
4
6
8
10
12
14
16
18
20
Week Number
29 January 2015
Return to main menu
Influenza confirmed ICU admissions (USISS
mandatory) by age and influenza subtype
300
A(H1N1)pdm09
A(H3N2)
A unknown subtype
A not subtypable
B
250
Number
200
150
100
50
0
<1
1-4
5-14
15-44
45-64
65+
Age group (years)
29 January 2015
Return to main menu
Weekly hospitalised influenza case rate per 100,000 trust
catchment population , England, since week 40 2014
Number of admissions
2.5
250
Admission rate/100,000 (2013/14)
2
200
1.5
150
1
100
0.5
Number of admissions
Admission rate/100,00
Admission rate/100,000 (2014/15)
50
0
0
40
44
48
52
4
8
12
16
20
Week Number
29 January 2015
Return to main menu
Weekly hospitalised influenza case rate per 100,000 trust
catchment population by PHE Region, since week 40 2014
Rate of hospitalisation/100,000 (North of England)
4.5
Rate of hospitalisation/100,000 (Midlands + East of England)
4
Rate of hospitalisation/100,000
Rate of hospitalisation/100,000 (London)
3.5
Rate of hospitalisation/100,000 (South of England)
3
2013/14 hospitalisation rate/100,000 - England
2.5
2
1.5
1
0.5
0
40
42
44
46
48
50
52
2
4
6
8
10
12
14
16
18
20
Week
29 January 2015
Return to main menu
All-cause mortality
29 January 2015
Return to main menu
Excess mortality (all causes) by week of registration, all ages,
England and Wales
18,000
Prediction
Upper limit
Total deaths all ages
Estimated number of death registrations
16,000
14,000
12,000
10,000
8,000
6,000
4,000
2,000
0
40
44
48
52
4
8
12
16
20
24
28
32
36
Week number
29 January 2015
Return to main menu
Excess mortality (all causes) by week of death through the
EuroMOMO algorithm in 65+year olds, England
14,000
Estimated number of deaths
12,000
10,000
8,000
6,000
Baseline
4,000
Upper 2 z score limit
Deaths (corrected)
2,000
0
40
44
48
52
4
8
12
16
20
24
28
32
36
Week number
29 January 2015
Return to main menu
Excess mortality (all causes) by week of death through the
EuroMOMO algorithm in 65+year olds, PHE North of England
4,500
Estimated number of deaths
4,000
3,500
3,000
2,500
2,000
1,500
Baseline
Upper 2 z score limit
Deaths (corrected)
1,000
500
0
40
44
48
52
4
8
12
16
20
24
28
32
36
Week number
29 January 2015
Return to main menu
Excess mortality (all causes) by week of death through the
EuroMOMO algorithm in 65+year olds, PHE Midlands and East of
England
4,000
Estimated number of deaths
3,500
3,000
2,500
2,000
1,500
Baseline
Upper 2 z score limit
Deaths (corrected)
1,000
500
0
40
44
48
52
4
8
12
16
20
24
28
32
36
Week number
29 January 2015
Return to main menu
Excess mortality (all causes) by week of death through the
EuroMOMO algorithm in 65+year olds, PHE London
1,400
Estimated number of deaths
1,200
1,000
800
600
Baseline
400
Upper 2 z score limit
Deaths (corrected)
200
0
40
44
48
52
4
8
12
16
20
24
28
32
36
Week number
29 January 2015
Return to main menu
Excess mortality (all causes) by week of death through the
EuroMOMO algorithm in 65+year olds, PHE South of England
Estimated number of deaths
3,500
3,000
2,500
2,000
1,500
Baseline
1,000
Upper 2 z score limit
Deaths (corrected)
500
0
40
44
48
52
4
8
12
16
20
24
28
32
36
Week number
29 January 2015
Return to main menu
Microbiological surveillance
29 January 2015
Return to main menu
DataMart: Number and proportion of samples positive for
influenza, by type, England
60
600
Influenza B (n)
50
500
Proportion positive
Influenza A (%)
Influenza B (%)
40
400
30
300
20
200
10
100
0
Number of positive specimens
Influenza A (n)
0
40
44
48
52
4
8
12
16
20
24
28
32
36
Week number (of sample)
29 January 2015
Return to main menu
DataMart: Number and proportion of samples positive for
influenza, by type, PHE North of England
Influenza A(n)
Influenza A (%)
220
Influenza B(n)
Influenza B(%)
200
180
Proportion positive (%)
40
160
140
30
120
100
20
80
60
10
40
Number of positive samples
50
20
0
0
40
44
48
52
4
8
12
16
20
24
28
32
36
Week number (of sample)
29 January 2015
Return to main menu
DataMart: Number and proportion of samples positive for
influenza, PHE Midlands and East of England
100
85
Influenza A (%)
80
75
300
Influenza B(%)
70
65
60
55
50
200
45
40
35
30
25
100
20
Number of positive samples
Influenza B(n)
90
Proportion positive (%)
400
Influenza A(n)
95
15
10
5
0
0
40
44
48
52
4
8
12
16
20
24
28
32
36
Week number (of sample)
29 January 2015
Return to main menu
DataMart: Number and proportion of samples positive for
influenza, by type, PHE London
50
200
Influenza B(n)
Influenza B(%)
180
Proportion positive (%)
40
160
140
30
120
100
20
80
60
10
40
Number of positive samples
Influenza A(n)
Influenza A (%)
20
0
0
40
29 January 2015
44
48
52
4
8
12
16
20
Week number (of sample)
24
28
32
36
Return to main menu
DataMart: Number and proportion of samples positive for
influenza, by type, PHE South of England
Influenza A(n)
Influenza A (%)
200
Influenza B(n)
Influenza B(%)
180
Proportion positive (%)
40
160
140
30
120
100
20
80
60
10
40
Number of positive samples
50
20
0
0
40
44
48
52
4
8
12
16
20
24
28
32
36
Week number (of sample)
29 January 2015
Return to main menu
DataMart: Proportion of samples positive for influenza, by age
group
100
90
<5 years
5-14 years
15-44 years
45-65years
Proportion postive
80
70
65+ years
60
50
40
30
20
10
0
40 42 44 46 48 50 52 2
4
6
8 10 12 14 16 18 20 22 24 26 28 30 32 34 36 38
Week number
29 January 2015
Return to main menu
DataMart: Proportion of samples positive for RSV, by age group
<5yrs
5-14yrs
15-44yrs
45-64yrs
Overall
65+yrs
80
Proportion positive
70
60
50
40
30
20
10
0
40
44
48
52
4
8
12
16
20
24
28
32
36
Week number
29 January 2015
Return to main menu
DataMart: Number and proportion of samples positive for other
viruses
Rhinovirus
Parainfluenza
hMPV
Adenovirus
40
Proportion positive
35
30
25
20
15
10
5
0
40
44
48
52
4
8
12
16
20
24
28
32
36
Week number
29 January 2015
Return to main menu
Influenza vaccination
29 January 2015
Return to main menu
Seasonal influenza vaccine uptake in targeted groups,
2014/15, England
80
65+yrs
70
<65yrs at risk
Vaccine uptake (%)
60
All pregnant women
50
40
30
2014/15 season indicated by bold lines
2013/14 season indicated by fainter lines
20
10
0
39
41
43
45
47
49
51
1
3
5
7
9
Week number
29 January 2015
Return to main menu
Seasonal influenza vaccine uptake in targeted groups,
2013/14, England
80
2yrs
70
3yrs
4yrs
Vaccine uptake (%)
60
50
40
30
-2014/15 season indicated by bold lines
-2013/14 season indicated by fainter lines
-Collections for 4yrs started in 2014/15
20
10
0
39
41
43
45
47
49
51
1
3
5
7
9
Week number
29 January 2015
Return to main menu
Links
• Sources of UK flu surveillance data:
https://www.gov.uk/sources-of-uk-flu-datainfluenza-surveillance-in-the-uk
• Weekly flu report
https://www.gov.uk/government/statistics/wee
kly-national-flu-reports
29 January 2015
Return to main menu
© Copyright 2026
