
Influenza Surveillance in Ireland – Weekly Report
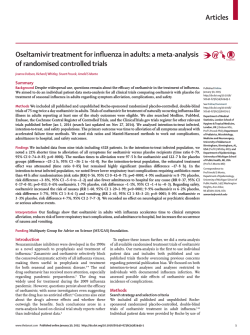
Influenza Surveillance in Ireland – Weekly Report Influenza Week 4 2015 (19th - 25th January 2015) Summary Influenza activity in Ireland is slowly increasing; with an increase in influenza positivity and confirmed influenza outbreaks reported during week 4 2015. Influenza-like illness (ILI): The sentinel GP influenza-like illness (ILI) consultation rate was 31.3 per 100,000 population in week 4 2015, remaining low, and stable compared to the updated rate of 30.4 per 100,000 population during week 3 2015. o ILI rates remained above the Irish baseline threshold (21.0 per 100,000 population) o ILI rates increased in the 0-4 and 5-14 year age groups during week 4 2015. GP Out of Hours: The proportion of influenza–related calls to GP Out-of-Hours services increased slightly during week 4 2015. National Virus Reference Laboratory (NVRL): o Influenza positivity increased during week 4 2015, with 81 (23.5%) influenza positive specimens reported from the NVRL: 73 A(H3), 1 A(H1)pdm09, 4 A (not subtyped) and 3 B. o Influenza A(H3) is the predominant circulating influenza virus this season. o Respiratory syncytial virus (RSV) positivity has decreased significantly in recent weeks. Respiratory admissions: The latest complete data on respiratory admissions reported from a network of sentinel hospitals were elevated. Hospitalisations: 18 confirmed influenza hospitalised cases were notified to HPSC during the week ending January 25th 2015: 15 associated with influenza A(H3), one with influenza A(H1)pdm09 and two with influenza A (not subtyped). Critical care admissions: To date this season, eight confirmed influenza cases were admitted to critical care units and reported to HPSC, two were associated with influenza A(H3), three with influenza A(H1)pdm09, two with influenza A (not subtyped) and one with influenza B. Mortality: Six influenza A-associated deaths have been reported to HPSC this season, five associated with influenza A(H3) and one with influenza A (not subtyped). Outbreaks: Eight acute respiratory outbreaks were reported to HPSC during the week ending January 25th 2015: six associated with influenza A(H3), one with RSV and one with no pathogen identified. The majority of confirmed influenza outbreaks this season have been associated with influenza A(H3) in community hospitals/residential care facilities for the elderly. International: Globally, influenza activity was high in the northern hemisphere with influenza A(H3N2) viruses predominating this season. Antigenic characterisation of most recent A(H3N2) viruses this season indicated differences from the A(H3N2) virus used in the influenza vaccines for the northern hemisphere 2014/2015. As a consequence of the mismatch between vaccine and circulating strains, reduced vaccine effectiveness is expected. Vaccination of the elderly and other risk groups is still recommended, as the A(H3N2) component is expected to reduce the likelihood of severe outcomes due to cross-protection, and both the A(H1N1)pdm09 and influenza B components are expected to be effective. The latest ECDC risk assessment on seasonal influenza for the 2014/2015 season in Europe is available here. Influenza Surveillance Report Page 1 of 11 29/01/2015 1. GP sentinel surveillance system - Clinical Data During week 4 2015 (the week ending 25th January 2015), 83 influenza-like illness (ILI) cases were reported from sentinel GPs, corresponding to an ILI consultation rate of 31.3 per 100,000 population, remaining low, and stable compared to the updated rate of 30.4 per 100,000 population during week 3 2015. ILI rates remained above the Irish baseline threshold (21/100,000 population). ILI age specific rates increased in the 04 and 5-14 year age groups during week 4 2015, remained stable in those aged 15-64 and decreased in those aged 65 years or older (figures 1 & 2). Influenza A Influenza B ILI rate Baseline ILI rate 240 100 220 200 Number of positive specimens 160 60 140 120 100 40 80 ILI rate per 100,000 population 80 180 60 20 40 20 0 40 42 44 46 48 50 52 2 4 6 8 10 12 14 16 18 20 22 24 26 28 30 32 34 36 38 40 42 44 46 48 50 52 2 4 6 8 10 12 14 16 18 20 2013/2014 Summer 2014 0 2014/2015 Week Number Figure 1. ILI sentinel GP consultation rates per 100,000 population, baseline ILI threshold rate, and number of positive influenza A and B specimens tested by the NVRL, by influenza week and season. Source: ICGP and NVRL 0-4 years 5-14 years 15-64 years ≥ 65 years 200 180 160 ILI rate per 100,000 population 140 120 100 80 60 40 20 0 21 22 23 24 25 26 27 28 29 30 31 32 33 34 35 36 37 38 39 40 41 42 43 44 45 46 47 48 49 50 51 52 1 2 3 4 5 6 7 8 9 10 11 12 13 14 15 16 17 18 19 20 Summer 2014 2014/2015 Week Number Figure 2: Age specific sentinel GP ILI consultation rate per 100,000 population by week during the summer of 2014 and the 2014/2015 influenza season to date. Source: ICGP. Influenza Surveillance Report Page 2 of 11 29/01/2015 2. Influenza and Other Respiratory Virus Detections - NVRL The data reported in this section refers to sentinel and non-sentinel respiratory specimens routinely tested for influenza, respiratory syncytial virus (RSV) and human metapneumovirus (hMPV) by the National Virus Reference Laboratory (NVRL). The NVRL also test respiratory specimens for adenovirus and parainfluenza viruses types 1, 2, 3 & 4 (PIV-1, -2,-3 & -4) upon clinical request (figures 3, 4 and 5 and tables 1 and 2). Influenza positivity increased during week 4 2015, with 81 (23.5%) influenza positive specimens reported from the NVRL: 73 A(H3), 1 A(H1)pdm09, 4 A (not subtyped) and 3 B. To date this season, influenza A (H3) is the predominant circulating virus, with 88.4% (243/275) of confirmed influenza specimens reported by the NVRL positive for influenza A(H3). Week 4 2015: o 21 of 34 (61.8%) sentinel specimens were influenza positive: 17 A(H3) and 4 A (not subtyped). o 60 of 311 (19.3%) non-sentinel specimens were influenza positive: 56 A(H3), 1 A(H1)pdm09 and 3 B. Twenty-seven (27/345; 7.8%) respiratory syncytial virus (RSV) positive sentinel GP and non-sentinel specimens were reported during week 4 2015, a significant decrease on the last two weeks. Figure 5 shows the number and percentage of non-sentinel RSV positive specimens detected by the NVRL during the 2014/2015 season, compared to the 2013/2014 season. Sporadic detections of human metapneumovirus (hMPV), adenovirus and parainfluenza virus types -1, -3 & -4 have been reported for the season to date. Genetic characterisation of influenza viruses circulating this season has been carried out by the NVRL, on 13 positive samples to date. A total of 11 influenza A(H3) viruses have been genetically characterised. Eight of 11 (72.7%) viruses were A/Hong Kong/5738/2014-like (3C.2a), which is a genetic group of viruses that have shown antigenic drift from the vaccine strain. The remaining viruses belong to the genetic group 3C.3, which is reportedly antigenically similar to the 2014/2015 influenza A(H3) vaccine strain. Two influenza B viruses were characterised and are B/Yamagata-like viruses, which are included in the 2014/2015 influenza vaccine. Further testing is ongoing, and the NVRL and HPSC are carefully monitoring the situation. The latest ECDC risk assessment on seasonal influenza for the 2014/2015 season in Europe, published on the 28th January 2015 is available here. Influenza Surveillance Report Page 3 of 11 29/01/2015 Total Specimens % positive influenza A % positive influenza B 700 100 90 600 550 80 500 70 450 60 400 350 50 300 40 250 200 30 150 20 100 Percentage specimens positive for influenza Number of specimens tested for influenza 650 10 50 0 0 40 41 42 43 44 45 46 47 48 49 50 51 52 1 2 3 4 5 6 7 8 9 10 11 12 13 14 15 16 17 18 19 20 2014/2015 Week Number Figure 3: Number of sentinel and non-sentinel specimens tested by the NVRL for influenza and percentage influenza positive by week for the 2014/2015 influenza season. Source: NVRL Influenza A (H3) Influenza A (H1)pdm09 Influenza A (not subtyped) Influenza B 240 220 Number of influenza positive specimmens 200 180 160 140 120 100 80 60 40 20 0 40 41 42 43 44 45 46 47 48 49 50 51 52 1 2 3 4 5 6 7 8 9 10 11 12 13 14 15 16 17 18 19 20 2014/2015 Week Number Figure 4: Number of positive influenza specimens by influenza type/subtype from sentinel and non-sentinel sources tested by the NVRL, by week for the 2014/2015 influenza season. Source: NVRL. Influenza Surveillance Report Page 4 of 11 29/01/2015 Number RSV positive 2013/2014 % RSV positive 2014/2015 % RSV positive 2013/2014 100 50 90 45 80 40 70 35 60 30 50 25 40 20 30 15 20 10 10 5 0 40 41 42 43 44 45 46 47 48 49 50 51 52 1 2 3 4 5 6 7 8 9 10 11 12 13 14 15 16 17 18 19 20 21 22 23 24 25 26 27 28 29 30 31 32 33 34 35 36 37 38 39 Percent positive/total tested Number of positive specimens Number RSV positive 2014/2015 0 Week Number Figure 5: Number and percentage of non-sentinel RSV positive specimens detected by the NVRL during the 2014/2015 season, compared to the 2013/2014 season. Source: NVRL. Influenza Surveillance Report Page 5 of 11 29/01/2015 * Table 1: Number of sentinel and non-sentinel respiratory specimens tested by the NVRL and positive influenza results, for week 4 2015 and the 2014/2015 season to date. Source: NVRL Week Total tested Number influenza positive % Influenza positive Sentinel Non-sentinel Total Sentinel Non-sentinel 34 311 345 295 3650 21 60 81 80 195 Total 3945 275 Specimen type 4 2015 2014/2015 Influenza A 61.8 19.3 23.5 27.1 5.3 A (H1)pdm09 0 1 1 0 4 A (H3) 17 56 73 68 175 A (not subtyped) 4 0 4 7 9 Total influenza A 21 57 78 75 188 7.0 4 243 16 263 Influenza B 0 3 3 5 7 12 Table 2: Number of sentinel and non-sentinel specimens tested by the NVRL for other respiratory viruses and positive results, for week 4 2015 and the 2014/2015 season to date. Source: NVRL Week 4 2015 2014/2015 * Specimen type Sentinel Non-sentinel Total Sentinel Non-sentinel Total Total tested 34 311 345 295 3650 3945 RSV 1 26 27 21 744 765 % RSV 2.9 8.4 7.8 7.1 20.4 19.4 Adenovirus 0 2 2 0 13 13 % Adenovirus 0.0 0.6 0.6 0.0 0.4 0.3 PIV1 0 0 0 0 1 1 % PIV1 0.0 0.0 0.0 0.0 0.0 0.0 PIV2 0 0 0 0 0 0 % PIV2 0.0 0.0 0.0 0.0 0.0 0.0 PIV3 0 0 0 0 50 50 % PIV3 0.0 0.0 0.0 0.0 1.4 1.3 PIV4 0 0 0 0 4 4 % PIV4 0.0 0.0 0.0 0.0 0.1 0.1 hMPV 0 11 11 17 83 100 Please note that non-sentinel specimens relate to specimens referred to the NVRL (other than sentinel specimens) and may include more than one specimen from each case. Influenza Surveillance Report Page 6 of 11 29/01/2015 % hMPV 0.0 3.5 3.2 5.8 2.3 2.5 3. Regional Influenza Activity by HSE-Area Influenza activity is based on sentinel GP ILI consultation rates, laboratory data and outbreaks. Sporadic influenza activity (based on ILI cases and/or confirmed influenza cases) was reported in HSE-W and localised influenza activity was reported in all other HSE-Areas during week 4 2015 (figure 6). Figure 6: Map of provisional influenza activity by HSE-Area during influenza week 4 2015. Sentinel hospitals The Departments of Public Health have established at least one sentinel hospital in each HSE-Area, to report data on total, emergency and respiratory admissions on a weekly basis. Respiratory admissions reported from sentinel hospitals remained high during week 2 2015 at 364; however decreased compared to 416 respiratory admissions reported during week 1 2015 (figure 7). Data reported for weeks 3 and 4 2015 (shown in figure 7) should be interpreted with caution as data were incomplete. Influenza Surveillance Report Page 7 of 11 29/01/2015 Hospital Respiratory Admissions ILI rate per 100,000 population 80 500 450 70 400 ILI rate per 100,000 population 350 50 300 40 250 200 30 150 Number of respiratory admissions 60 20 100 10 0 50 40 42 44 46 48 50 52 2 4 6 2013/2014 8 10 12 14 16 18 20 22 24 26 28 30 32 34 36 38 40 42 44 46 48 50 52 2 Summer 2014 4 6 8 10 12 14 16 18 20 0 2014/2015 Week Number Figure 7: Number of respiratory admissions reported from sentinel hospitals and ILI sentinel GP consultation rate per 100,000 population by week and season. Source: Departments of Public Health - Sentinel Hospitals & ICGP. It should be noted that data for weeks 3 and 4 2015 were incomplete. 4. GP Out-Of-Hours services surveillance The Department of Public Health in HSE-NE is collating national data on calls to nine of thirteen GP Out-ofHours services in Ireland. Records with clinical symptoms reported as flu or influenza are extracted for analysis. This information may act as an early indicator of increased ILI activity. However, data are self-reported by callers and are not based on coded influenza diagnoses. The proportion of influenza–related calls to GP Out-of-Hours services increased slightly during week 4 2015, to 2.9%, compared to 2.5% during week 3 2015 (figure 8). Influenza Surveillance Report Page 8 of 11 29/01/2015 % Self reported influenza calls Sentinel GP ILI rate 100 % Self reported influenza calls 9 8 80 7 6 60 5 4 40 3 2 20 1 0 40 43 46 49 52 3 6 9 12 15 18 21 24 27 30 33 36 39 42 45 48 51 2 5 8 11 14 17 20 23 26 29 32 35 38 41 44 47 50 1 4 7 10 13 16 19 2012/2013 Summer 2013 2013/2014 Summer 2014 Sentinel GP ILI rate per 100,000 population 10 0 2014/2015 Week Number Figure 8: Self-reported influenza-related calls as a proportion of total calls to Out-of-Hours GP Co-ops and sentinel GP ILI consultation rate per 100,000 population by week and season. Source: GP Out-Of-Hours services in Ireland (collated by HSE-NE) & ICGP. 5. Influenza & RSV notifications Influenza and RSV cases notifications are reported on Ireland’s Computerised Infectious Disease Reporting System (CIDR), including all positive influenza/RSV specimens reported from all laboratories testing for influenza/RSV and reporting to CIDR. Influenza and RSV notifications are reported in the Weekly Infectious Disease Report for Ireland. 6. Influenza Hospitalisations Eighteen confirmed influenza hospitalised cases were notified to HPSC during the week ending January 25th 2015: 15 associated with influenza A(H3), one with influenza A(H1)pdm09 and two with influenza A (not subtyped). For the 2014/2015 season to date (up to week ending 25th January 2015), 58 confirmed influenza cases were reported as hospitalised to HPSC, 40 associated with influenza A(H3), two with influenza A(H1)pdm09, 14 with influenza A (not subtyped) and two with influenza B. Influenza Surveillance Report Page 9 of 11 29/01/2015 7. Critical Care Surveillance The Intensive Care Society of Ireland (ICSI) are continuing with the enhanced surveillance system set up during the 2009 pandemic, on all critical care patients with confirmed influenza. HPSC process and report on this information on behalf of the regional Directors of Public Health/Medical Officers of Health. To date this season, eight confirmed influenza cases were admitted to critical care units and reported to HPSC, two were associated with influenza A(H3), three with influenza A(H1)pdm09, two with influenza A (not subtyped) and one with influenza B. 8. Mortality Surveillance Influenza-associated deaths include all deaths where influenza is reported as the primary/main cause of death by the physician or if influenza is listed anywhere on the death certificate as the cause of death. HPSC receives daily mortality data from the General Register Office (GRO) on all deaths from all causes registered in Ireland. These data have been used to monitor excess all‐cause and influenza and pneumonia deaths as part of the influenza surveillance system and the European Mortality Monitoring Project. These data are provisional due to the time delay in deaths’ registration in Ireland. http://www.euromomo.eu/ Six influenza A-associated deaths were reported to HPSC this season to date, five associated with influenza A(H3) and one with influenza A (not subtyped). One case was in the 15-64 year age group and five cases were in those aged 65 years or older. During week 4 2015 and for the 2014/2015 influenza season to date, no excess all-cause mortality was reported in Ireland after correcting GRO data for reporting delays with the standardised EuroMOMO algorithm. Excess all-cause mortality has been observed among the elderly (≥ 65 years) during recent weeks in Portugal, England, Scotland, Wales, the Netherlands, Spain, and France. Excess all-cause mortality cannot with certainty be attributed to specific causes, but may be associated with extreme cold, increase in acute respiratory illness and influenza activity. The current reported increases coincide with circulating influenza in most countries, however in France it started prior to the beginning of influenza season. http://www.euromomo.eu/ 9. Outbreak Surveillance Eight acute respiratory general outbreaks were reported to HPSC during the week ending January 25 th 2015: six associated with influenza A(H3), one with RSV and one with no pathogen identified. Seven outbreaks were in community hospitals/long stay units/residential care facilities and one was in a school. For the 2014/2015 influenza season to date (up to the week ending January 25th 2015), 22 acute respiratory outbreaks were reported to HPSC. Twelve of these outbreaks were associated with influenza A: 11 associated with A(H3) and one with both A(H3) and A(H1)pdm09. Three outbreaks were associated with RSV and seven acute respiratory outbreaks had no pathogens identified. The majority of these outbreaks occurred in residential care facilities/community hospital settings, mainly affecting the elderly. One outbreak occurred in an acute hospital and one in a school. Influenza Surveillance Report Page 10 of 11 29/01/2015 10. International Summary Globally, influenza activity was high in the northern hemisphere with influenza A(H3N2) viruses predominating this season to date. In Europe, the influenza season is well under way, in particular in western and northern European countries. The overall proportion of influenza positive sentinel specimens in Europe increased to 40%, during week 3 2015. Overall, influenza A(H3N2) viruses have been the predominant viruses detected in Europe this season. Globally, antigenic characterisation of most influenza A(H3N2) viruses tested this season indicated differences from the A(H3N2) virus used in the influenza vaccines for the northern hemisphere 2014/2015 season. This situation is being monitored closely as the season progresses. Although this may compromise the effectiveness of the A(H3N2) component of the vaccine, it is still important that people are vaccinated, particularly those at risk of developing severe influenza symptoms. Vaccination of the elderly and other risk groups is still recommended, as the A(H3N2) component is expected to reduce the likelihood of severe outcomes due to cross-protection, and both the A(H1N1)pdm09 and influenza B components are expected to be effective. Vaccination remains the most effective means of preventing infection by seasonal influenza viruses. Based on tests to date, the influenza A(H3N2) viruses are expected to be sensitive to neuraminidase inhibitors (antiviral drugs: oseltamivir and zanimivir). The majority of influenza A(H1)pdm09 and influenza B viruses characterised this season are similar to those included in the 2014/2015 northern hemisphere trivalent vaccine. The latest ECDC risk assessment on seasonal influenza for the 2014/2015 season in Europe is available here. See ECDC and WHO influenza surveillance reports for further information. Further information is available on the following websites: For up to date information on human infection with avian influenza A(H7N9) virus in China including the current case numbers and the WHO assessment of the situation please see here. For information on human infection with avian influenza A(H5N1) in Egypt, please see here. Information on Middle Eastern Respiratory Syndrome Coronavirus (MERS-CoV), including the latest ECDC rapid risk assessment is available on the ECDC website. Further information and guidance documents are also available on the HPSC and WHO websites. Northern Ireland http://www.fluawareni.info/ Europe – ECDC http://ecdc.europa.eu/ Public Health England http://www.hpa.org.uk/Topics/InfectiousDiseases/InfectionsAZ/SeasonalInfluenza/ United States CDC http://www.cdc.gov/flu/weekly/fluactivitysurv.htm Public Health Agency of Canada http://www.phac-aspc.gc.ca/fluwatch/index-eng.php 11. WHO recommendations on the composition of influenza virus vaccines The WHO vaccine strain selection committee recommended that vaccines for use in the 2014/2015 influenza season (northern hemisphere winter) contain the following: an A/California/7/2009 (H1N1)pdm09-like virus; an A/Texas/50/2012 (H3N2)-like virus; a B/Massachusetts/2/2012-like virus. Further information on influenza in Ireland is available at www.hpsc.ie Acknowledgements This report was prepared by Lisa Domegan and Joan O’Donnell, HPSC. HPSC wishes to thank the sentinel GPs, the ICGP, NVRL, Departments of Public Health, ICSI and HSE-NE for providing data for this report. Influenza Surveillance Report Page 11 of 11 29/01/2015
© Copyright 2026