
Low effectiveness of seasonal influenza vaccine
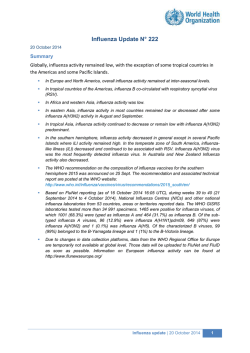
Rapid communications
Low effectiveness of seasonal influenza vaccine in
preventing laboratory-confirmed influenza in primary
care in the United Kingdom: 2014/15 mid–season results
R G Pebody ([email protected])1, F Warburton1, J Ellis2, N Andrews1, C Thompson2, B von Wissmann3, H K Green1, S
Cottrell 4 , J Johnston5, S de Lusignan6, C Moore7, R Gunson8, C Robertson9,10, J McMenamin3, M Zambon2
1. Public Health England Centre of Infectious Disease Surveillance and Control, London, United Kingdom
2. Public Health England Operations Directorate, Microbiology Services, Colindale, London, United Kingdom
3. Health Protection Scotland, Glasgow, United Kingdom
4. Public Health Wales, Cardiff, United Kingdom
5. Public Health Agency Northern Ireland, Belfast, United Kingdom
6. Royal College of General Practitioners Research and Surveillance Centre, United Kingdom
7. Public Health Wales Molecular Diagnostics Unit, Cardiff, United Kingdom
8. West of Scotland Specialist Virology Centre, Glasgow, United Kingdom
9. University of Strathclyde, Glasgow, United Kingdom
10.International Prevention Research Institute, Lyon, France
Citation style for this article:
Pebody RG, Warburton F, Ellis J, Andrews N, Thompson C, von Wissmann B, Green HK, Cottrell S, Johnston J, de Lusignan S, Moore C, Gunson R, Robertson C,
McMenamin J, Zambon M. Low effectiveness of seasonal influenza vaccine in preventing laboratory-confirmed influenza in primary care in the United Kingdom:
2014/15 mid–season results. Euro Surveill. 2015;20(5):pii=21025. Available online: http://www.eurosurveillance.org/ViewArticle.aspx?ArticleId=21025
Article submitted on 30 January 2015 / published on 05 February 2015
In 2014/15 the United Kingdom experienced circulation
of influenza A(H3N2) with impact in the elderly. Midseason vaccine effectiveness (VE) shows an adjusted
VE of 3.4% (95% CI: −44.8 to 35.5) against primary
care consultation with laboratory-confirmed influenza
and −2.3% (95% CI: −56.2 to 33.0) for A(H3N2). The
low VE reflects mismatch between circulating viruses
and the 2014/15 northern hemisphere A(H3N2) vaccine
strain. Early use of antivirals for prophylaxis and treatment of vulnerable populations remains important.
We present the 2014/15 mid-season estimates of influenza vaccine effectiveness (VE) for the United Kingdom
of England, Wales, Scotland and Northern Ireland
(UK). This season is dominated by early circulation of
influenza A(H3N2) virus, and an overall VE in preventing medically attended laboratory-confirmed influenza
in primary care of only 3.4% and against A(H3N2) of
−2.3%. This report provides clear evidence of antigenic
and genetic mismatch between circulating A(H3N2)
viruses and the respective 2014/15 northern hemisphere vaccine strain.
Background
The UK has a long-standing selective influenza immunisation programme targeted at individuals at higher
risk of severe disease, in particular all those 65 years
and above and under 65-year olds in a clinical risk
group, using inactivated trivalent influenza vaccine.
The 2014/15 season is the second year where intranasally administered live attenuated influenza vaccine
(LAIV) has been offered to pre-school age children in
the UK with certain areas also vaccinating children of
school-age [1]. This winter has been characterised by
www.eurosurveillance.org
early influenza activity, with A(H3N2) virus the dominant circulating sub-type. In England, by week 4 2015
peak influenza activity levels had exceeded those
seen in the past three seasons, but not approached
the peak levels seen in 2010/11 and 2008/09 [2]. The
current season has led to large numbers of care home
outbreaks, often in highly vaccinated populations, hospitalisations and significant excess all-cause mortality
in the over 65 year-old population.
The UK has well established methods to produce midand end-of-season estimates of VE in preventing primary care consultation due to laboratory-confirmed
influenza infection [3,4]. The key aims of the present
study were to provide early estimates of influenza VE
in the UK to inform influenza prevention and control
measures both for the remainder of this season and
the forthcoming World Health Organization (WHO) convened meeting at the end of February, where vaccine
composition is decided for the forthcoming northern
hemisphere 2015/16 season.
Study population and period
Data were derived from five primary care influenza
sentinel swabbing surveillance schemes from England
(two schemes), Scotland, Wales and Northern Ireland.
Details of the Royal College of General Practitioners
(RCGP), Public Health England (PHE) Specialist
Microbiology Network (SMN), Public Health Wales,
Public Health Agency (PHA) of Northern Ireland and
Health Protection Scotland (HPS) swabbing schemes
have been published previously [4].
1
The study period ran from 1 October 2014 to 16 January
2015. Patients were swabbed as part of clinical care,
with verbal consent. Cases were defined as persons
presenting during the study period in a participating general practitioner (GP) practice with an acute
influenza-like-illness (ILI) who were swabbed and then
tested positive for influenza A or B viruses. An ILI case
was defined as an individual presenting in primary
care with an acute respiratory illness with physiciandiagnosed fever or complaint of feverishness. Controls
were individuals presenting with ILI in the same period
that were swabbed and tested negative for influenza.
A standardised questionnaire was completed by the
GP responsible for the patient during the consultation.
Demographic, clinical and epidemiological information
was collected from cases and controls, including date
of birth, sex, pre-defined underlying clinical risk group,
date of onset of respiratory illness, date of specimen
collection, and influenza vaccination status for the
2014/15 season, with vaccination dates and route of
administration (injection/intranasal) and whether resident in an area where a primary school vaccination programme was in operation.
Laboratory analysis
Laboratory confirmation was undertaken using comparable methods with real-time polymerase chain reaction (RT-PCR) assays capable of detecting circulating
influenza A and influenza B viruses and other respiratory viruses [5,6]. Samples were sent to respective
laboratories as previously described [4]. Further strain
characterisation was also performed; influenza viruses
were isolated in MDCK or MDCK-SIAT1 cells from RT-PCR
positive samples from England as previously described
[7,8]. Influenza A(H3N2) virus isolates with a haemagglutination titre ≥ 40 were characterised antigenically
using post-infection ferret antisera in haemagglutination inhibition (HI) assays, with guinea pig red blood
cells [9]. Nucleotide sequencing of the haemagglutinin (HA) gene of a subset of influenza A(H3N2) viruses
selected to be representative of the range of patient’s
age, date of sample collection, geographical location,
and antigenic characterisation of the influenza A(H3N2)
virus isolate, if performed, was undertaken (primer
sequences available on request), and phylogenetic
trees were constructed with a neighbour-joining algorithm available in the Mega 6 software (http://www.
megasoftware.net) [10]. HA sequences from reference
strains used in the phylogenetic analysis were obtained
from the EpiFlu database of the Global Initiative on
Sharing Avian Influenza Data (GISAID) (Table 1).
missing date of onset or an onset date more than seven
days before the swab was taken were also excluded.
VE was estimated by the test negative case control (TNCC) design. In this design, VE is calculated
as 1-(odds ratio) obtained using multivariable logistic regression models with influenza PCR results and
seasonal vaccination status as the linear predictor.
VE was also estimated for influenza A only and for
A(H3N2); Influenza A(H1N1) and B numbers were too
small to examine. In the analyses evaluating VE for a
specific type or strain, those positive for other types
were excluded. Age (coded into four standard age
groups, < 18, 18–44, 45–64 and ≥ 65 years), sex, clinical risk group, surveillance scheme (RCGP, SMN, HPS,
Wales, Northern Ireland), residence in an area where
primary school age vaccination programme operated
and date of onset (month) were investigated as potential confounding variables. All statistical analyses were
carried out in Stata version 13 (StataCorp, College
Station, Texas).
Results
A total of 2,278 individuals were swabbed in primary
care during the study period and had a laboratory
result available. The reasons for study inclusion and
exclusion are outlined in Figure 1. Five persons were
excluded because the influenza virus detected in them
was a LAIV vaccine strain based either on sequence
analysis or inferred based on influenza co-infection.
The details of the 1,341 individuals remaining in the
study were stratified according to the swab result
Figure 1
Flowchart showing specimen inclusion and exclusion
criteria, interim 2014/15 influenza vaccine effectiveness
evaluation, United Kingdom, week 40 2014 to week 3 2015
Total number of specimens in
original dataset
(N=2,278)
(n=101)
Sequentially
excluded samples
Date of sample prior to 1 Oct 2014 (n=101)
(n=6) unknown (n=6)
Influenza status
Live attenuated influenza vaccine strain (n=5)
Vaccination status unknown (n=80)
(n=5)
Date of vaccination
not known (n=107)
Vaccination less than 14 days from illness onset (n=67)
Date of illness
onset unknown (n=178)
(n=178)
Swab more(n=80)
than seven days after illness onset (n=393)
Statistical analysis
Persons were defined as vaccinated if the date of vaccination with the 2014/15 seasonal influenza vaccine was
14 or more days before onset of illness. Those in whom
the period between vaccination and onset of illness
was less than 14 days were excluded, as were those
where date of vaccination was missing. Those with a
2
(n=107)
Samples included in
the analysis
N=1,341
Cases
N=312
(n=67)
Controls
N=1,029
www.eurosurveillance.org
Table 1
Details for influenza A and B cases and controls, United Kingdom, week 40 2014 to week 3 2015 (1,029 controls and 312
cases)
Controls
Influenza B
cases
Influenza A a
cases
Influenza A(H1N1)
pdm09
cases
Influenza A(H3N2)
cases
(n = 1,029)
(n = 16)
(n = 296)
(n = 14)
(n = 271)
n (%)
n (%)
n (%)
n (%)
n (%)
< 18
269(79.8)
3(0.9)
65(19.3)
2(0.6)
60(17.8)
18–44
412(76.7)
7(1.3)
118(22)
6(1.1)
106(19.7)
45–64
244(74.8)
5(1.5)
77(23.6)
6(1.8)
69(21.2)
65 +
104(74.3)
1(0.7)
35(25)
0(0)
35(25)
0(0)
0(0)
1(100)
0(0)
1(100)
P-valueb
Age group (years)
Missing information
0.40
Sex
Female
592(77.2)
8(1)
167(21.8)
9(1.2)
153(19.9)
Male
432(76.3)
8(1.4)
126(22.3)
5(0.9)
115(20.3)
5(62.5)
0(0)
3(37.5)
0(0)
3(37.5)
Missing information
0.71
Scheme
Northern Ireland
29(87.9)
1(3)
3(9.1)
0(0)
3(9.1)
RCGP (England)
374(67)
6(1.1)
178(31.9)
10(1.8)
168(30.1)
SMN (England)
138(77.1)
2(1.1)
39(21.8)
2(1.1)
32(17.9)
Scotland
466(87.6)
7(1.3)
59(11.1)
2(0.4)
51(9.6)
Wales
22(56.4)
0(0)
17(43.6)
0(0)
17(43.6)
No
710(76.5)
15(1.6)
203(21.9)
10(1.1)
188(20.3)
Yes
215(76.2)
0(0)
67(23.8)
1(0.4)
63(22.3)
Missing information
104(79.4)
1(0.8)
26(19.8)
3(2.3)
20(15.3)
<0.001
Risk group
0.93
Interval onset to swab (days)
0–1
140(69.7)
1(0.5)
60(29.9)
2(1)
56(27.9)
2–4
498(74)
10(1.5)
165(24.5)
8(1.2)
149(22.1)
5–7
391(83.7)
5(1.1)
71(15.2)
4(0.9)
66(14.1)
210(19.1)
<0.001
Vaccination status and route
Unvaccinated
852(77.5)
15(1.4)
232(21.1)
13(1.2)
Vaccinated
177(73.1)
1(0.4)
64(26.4)
11(4.5)
61(25.2)
Injection
138(72.6)
1(0.5)
51(26.8)
0(0)
49(25.8)
Intranasal
23(79.3)
0(0)
6(20.7)
1(3.4)
5(17.2)
Missing route
16(69.6)
0(0)
7(30.4)
0(0)
7(30.4)
0.14c
Primary school age vaccination programme
No
289(67.5)
4(0.9)
135(31.5)
10(2.3)
121(28.3)
Yes
726(81.3)
12(1.3)
155(17.4)
4(0.4)
144(16.1)
14(70)
0(0)
6(30)
0(0)
6(30)
Missing information
<0.001
Month of event
Oct 2014
217(95.6)
3(1.3)
7(3.1)
1(0.4)
5(2.2)
Nov 2014
343(94.2)
6(1.6)
15(4.1)
0(0)
15(4.1)
Dec 2014
375(64.1)
4(0.7)
207(35.4)
6(1)
195(33.3)
Jan 2015
94(57.3)
3(1.8)
67(40.9)
6(3.7)
56(34.1)
<0.001
RCGP: Royal College of General Practitioners’ surveillance scheme; SMN: Specialist Microbiology Network.
a
There were 11 cases of influenza A infection where the subtype was unknown.
b
Controls vs any influenza case.
c
Vaccinated vs unvaccinated.
www.eurosurveillance.org
3
(Table 1). Positivity rates differed significantly by
month, scheme and primary school age vaccination
programme area.
Influenza A(H3N2) strain characterisation
During the study period, a total of 127 A(H3N2) circulating viruses were isolated from all referred clinical samples and antigenically characterised by HI analysis. The
majority of A(H3N2) viruses analysed (100/127; 79%)
were antigenically similar to the A(H3N2) virus component of the 2014/15 northern hemisphere vaccine
A/Texas/50/2012 (≤ 4-fold difference) with antiserum
raised against A/Texas/50/2012 in antigenic characterisation by HI); however a proportion of A(H3N2) viruses
(21%) showed reduced reactivity (> 4-fold difference)
(Table 2).
These viruses were antigenically similar to A/
Switzerland/9715293/2013, the recommended A(H3N2)
component of the 2015 southern hemisphere vaccine.
A > 4-fold difference in HI assay titres with reference
antiserum is considered to be significant antigenic
drift. Of the 44 UK influenza A(H3N2) viruses analysed to date by sequencing, the HA genes of these
viruses belonged in the genetic clade 3C, as does the
2014/15 A(H3N2) vaccine strain A/Texas/50/2012 and
A/Switzerland/9715293/2013, one of the three recommended strains for the southern hemisphere 2015
vaccine composition. However, the majority (35/44;
79.5%) of the HA sequences of 2014/15 UK viruses
analysed were further characterised within this clade
to belong in subgroup 3C.2a of group 3C.2, with fewer
(9/44 17.3%) in group 3C.3 (Figure 2). These groups are
considered genetically distinct from the 2014/15 A/
Texas/50/2012(H3N2)-like clade 3C.1 vaccine reference
strain.
Model fitting for vaccine effectiveness
estimation
When estimating vaccine effectiveness, age group,
sex, month of onset, surveillance scheme and primary
school age programme area were adjusted for in a
multivariable logistic regression model. Only surveillance scheme, time period and primary school age
programme area were significantly associated with
having a positive swab, and all were confounders for
Table 2
Influenza A(H3N2) viruses isolated from specimens
with < 4-fold, 4-fold, or > 4-fold difference in
haemagglutination inhibition (HI) assay titres compared
with A/Texas/50/2012, the 2014/15 northern hemisphere
influenza seasonal A(H3N2) influenza vaccine component,
United Kingdom, week 40 2014 to week 3 2015 (n = 127)
Influenza
virus
A(H3N2)
4
Change in reactivity with A/Texas/50/2012
antiserum
<4-fold
4-fold
>4-fold
Total
N
(%)
n
(%)
N
(%)
n
(%)
65
51.2
35
27.6
27
21.3
127
100
vaccine effectiveness (changing the estimate by more
than 5%). Information on risk group was missing for 131
samples (9.8%) and was therefore not included in the
final model. If risk group was included, it was found
not to be associated with being positive and the VE
estimates remained similar.
Table 3 shows vaccine effectiveness estimates against
all influenza, influenza A and influenza A(H3N2). There
were inadequate samples to enable estimation of
effectiveness against influenza A(H1N1)pdm09 or influenza B. The adjusted VE of influenza vaccine against all
influenza was 3.4% and was very similar for A(H3N2),
reflecting the fact that A(H3N2) is the dominant circulating virus strain this season.
Discussion
This paper presents the mid-season estimates of influenza vaccine effectiveness for the UK. In a season
dominated by early circulation of influenza A(H3N2)
virus, we found the overall VE in preventing medically
attended laboratory-confirmed influenza in primary
care was only 3.4% and −2.3% specifically against
A(H3N2). We also found clear evidence of antigenic and
genetic mismatch between circulating A(H3N2) viruses
and the 2014/15 northern hemisphere vaccine strain.
The UK, together with other European countries, the
United States, Canada and Australia has well established systems to generate interim estimates of seasonal influenza VE. These early results are used to
optimise in-season control and prevention measures,
to inform other countries where the influenza season may have just started or is about to start, and to
contribute to forthcoming WHO vaccine composition
deliberations.
The UK, as observed in North America and some other
European countries [11,12] has experienced a season
dominated by early circulation of influenza A(H3N2)
virus – with clear evidence of emergence of a drifted
A(H3N2) strain, first seen in North America in spring
2014 [11], and then in Australia in mid-2014 [13]. This
drifted strain has reduced antigenic reactivity with
antiserum raised to the current A(H3N2) vaccine strain
(A/Texas/50/2012), and is antigenically more closely
related to A/Switzerland/9715293/2013, the A(H3N2)
virus selected as one of the three recommended components for the 2015 southern hemisphere influenza
vaccine [14].
Characterisation of circulating influenza viruses
involves both genetic and antigenic characterisation.
Genetic analysis focusses on detailed comparison of
the HA genes of viruses, tracking changes over time
and linking this to phylogenetic analysis of sequence
clustering to determine emerging virus groups and
changes in receptor binding and other important antigenic epitopes. Genetic variation does not always
correlate with antigenic variation. The interpretation
of both data sources is complex, as not all viruses
www.eurosurveillance.org
Figure 2
Phylogenetic analysis with sequences of the HA1 subunit of the haemagglutinin (HA) gene from reference viruses
downloaded from the GISAID EpiFlu database and influenza A(H3N2) sequences derived from patients in the United
Kingdom, week 40 2014 to week 3 2015
A/England/44840069/2014
A/England/44940038/2014
A/England/529/2014
A/England/44840067/2014
A/England/44780079/2014
A/Scotland/426161/2014
A/England/44160198/2014
A/England/44160199/2014
A/England/511/2014
A/England/44160201/2014
A/England/44160202/2014
A/England/512/2014
A/England/507/2014
A/England/43020765/2014
A/England/45040065/2014
A/England/45000006/2014
A/England/45100196/2014
A/England/44860850/2014
A/England/44020584/2014
A/England/44060047/2014
A/England/44320794/2014
A/Scotland/426901/2014
A/England/44320795/2014
A/England/44840003/2014
A/England/45040069/2014
A/Scotland/426752/2014
A/England/44760132/2014
A/England/525/2014
A/England/45060041/2014
A/England/45000008/2014
A/England/45080158/2014
A/Scotland/426918/2014
A/England/45000028/2014
A/England/44540273/2014
3C.2a
3C.2
A/England/43400390/2014
A/England/45000010/2014
A/England/43320581/2014
A/England/43860187/2014
A/England/45060049/2014
A/England/44080181/2014
A/HongKong/5738/2014
A/England/43700330/2014
A/England/671/2013
A/England/370/2014
A/England/40180189/2014
A/England/41180423/2014
A/England/35120047/2013
3C
A/Norway/1903/2014
A/Switzerland/9715293/2014
A/England/43460207/2014
3C.3a
A/England/479/2014
A/Samara/73/2013
A/England/41860057/2014
A/England/44640016/2014
A/England/498/2014
A/England/34560054/2013
A/England/41500098/2014
A/England/40280202/2014
A/England/420/2014
A/England/41800221/2014
A/England/41420344/2014
A/England/2/2014
A/Scotland/425954/2014
A/England/513/2014
A/England/43920370/2014
A/England/298/2014
A/England/34500001/2013
A/England/43860188/2014
A/England/41420350/2014
3C.3
A/Scotland/426685/2014
A/England/44320793/2014
A/England/41060123/2014
A/England/655/2013
A/England/41800219/2014
A/Texas/50/2012
3C.1
A/England/516/2014
A/England/45000025/2014
A/England/533/2014
A/England/534/2014
A/England/536/2014
A/Victoria/361/2011
A/Athens GR11/22012 3B
A/Stockholm/18/2011 3A
A/Perth/16/2009
0.002
GISAID: Global Initiative on Sharing Avian Influenza Data.
www.eurosurveillance.org
5
Table 3
Samples positive (cases) and negative (controls) for influenza according to vaccination status and vaccine effectiveness
estimates, United Kingdom, week 40 2014 to week 3 2015
Cases
(vaccinated :
unvaccinated)
All influenza (A and B)
65 : 247
All influenza A
64 : 232
Influenza A(H3N2) only
61 : 210
Controls
(vaccinated :
unvaccinated)
Crude VE
(95% CI)
−26.7% (−74.0 to 7.8)
3.4% (−44.8 to 35.5)
177 : 825
−32.2% (−82.2 to 4.0)
−0.7% (−52.0 to 33.2)
−39.8% (−94.1 to −0.7)
−2.3% (−56.2 to 33.0)
Adjusteda VE
(95% CI)
CI: confidence interval; VE: vaccine effectiveness.
a
Adjusted for age group, sex, month, surveillance scheme and primary school area.
can be cultivated in sufficient quantity for antigenic
characterisation, so that viruses for which sequence
information is available may not be antigenically
characterised, leading to potential bias in interpretation. This is particularly relevant to the discussion of
antigenic characterisation data for A(H3N2) viruses in
the 2014/15 winter season. Some circulating A(H3N2)
viruses are difficult to grow in tissue culture as a result
of genetic drift affecting receptor binding properties
[15], and viruses grown in eggs may have egg adaptive changes which make the analysis of antigenic drift
complex. Most A(H3N2) strains seen since February
2014 fell into the HA genetic clade (3C) for which A/
Switzerland/9715293/2013 was a prototype representative strain. Antigenic and genetic characterisation
data indicate that A/Switzerland/9715293/2013-like
strains have circulated in the UK during winter 2014/15.
There is a clear antigenic mismatch between the northern hemisphere H3N2 vaccine strain and the circulating
variant in winter of 2014/15. The full picture of virological variation requires further detailed analysis, not
possible at this stage of the 2014/15 season.
Our observation of an absence of significant effectiveness in preventing medically-attended laboratoryconfirmed influenza in primary care due to A(H3N2) are
congruent with the findings recently reported from the
US [16] who report low effectiveness of 22% (95% confidence interval (CI): 5–35) and from Canada who report
a VE of −8% (95% CI: −50 to 23) against laboratoryconfirmed, medically-attended influenza A(H3N2) virus
infection in primary care [17]. The observation of low
or non-significant effectiveness in 2014/15 in the UK
and in North America correlates with the direct mismatch seen between the vaccine virus and A(H3N2)
strains circulating this winter. Vaccine mismatch due to
circulation of drifted strains does occasionally occur,
although this is the lowest estimate of influenza VE
reported by the UK over the past decade using the
TNCC approach to measure VE [3,4]. It is also important to highlight the uncertainty of our estimate. The
upper 95% CI of 35% shows we can be confident that
VE is low at this point although we cannot be clear that
influenza vaccine has no effectiveness this season.
Indeed the significantly lower influenza positivity in
areas where children of school age were vaccinated
compared to non-pilot areas (Table 1) is suggestive of
6
a possible impact of the childhood influenza vaccination programme. Furthermore, this mid-season analysis does not preclude the likelihood that the vaccine
should offer protection from different types of influenza, such as influenza B that may still circulate later
in the season. All these elements will form part of the
end-of-season analysis including stratification by agegroup and scheme.
The WHO has made their recommendations for the composition of the influenza vaccine for the 2015 southern
hemisphere winter in September 2014, including a
switch to a A/Switzerland/9715293/2013 (H3N2)-like
virus [18]. The WHO influenza vaccine composition
group will convene shortly, at the end of February
2015, to consider recommendations for the forthcoming
northern hemisphere 2015/16 winter, and the findings
in this paper will contribute to their deliberations. The
observation of low vaccine effectiveness this season
highlights the vital importance of implementing other
prevention and control measures for the remainder of
this season, in particular the early use of influenza
antivirals for post-exposure prophylaxis and treatment
of vulnerable populations, such as the elderly, together
with appropriate infection control measures.
Acknowledgements
We are grateful to the many primary care physicians in
England, Wales, Northern Ireland and Scotland who supplied
the clinical information on their patients; to the staff of the
PHE Respiratory Virus Unit, the PHE Specialist Microbiology
Laboratories, Public Health Wales Specialist Virology Centre,
the West of Scotland Specialist Virology Centre and the
Regional Virus Laboratory, Belfast who undertook analysis
of specimens. We thank the staff of PHE, RCGP, Public Health
Wales, Public Health Agency Northern Ireland and Health
Protection Scotland teams who coordinate the GP schemes,
in particular Abigail Sunderland and Praveen SebastianPillai
from PHE; Richard Lewis and Hannah Evans from PHW;
Catherine Frew, Alasdair MacLean, Samantha Shepherd
& Celia Aitken from WoSSVC and Arlene Reynolds, Diogo
Marques, Louise Primrose-Shaw and Karen Voy from HPS
for overseeing data collection, and Ivelina Yonova (Practice
Liaison), Sameera Pathirannehelage (SQL Developer), and
David Mullett (Information Systems Manager) from RCGP/
University of Surrey. We acknowledge the originating and
submitting laboratories of the sequences from GISAID’s
EpiFlu Database on which some of the analyses are based
(see Figure 2). All submitters of data may be contacted directly via the GISAID website www.gisaid.org
www.eurosurveillance.org
Conflicts of interest
None declared.
Authors’ contributions
RGP wrote the first draft; FW and NA led on the statistical
analysis; all co-authors contributed epidemiological and/
or virological data, contributed to the interpretation of the
results, reviewed the early draft and approved the final
version.
1990;8(1):737-87. http://dx.doi.org/10.1146/annurev.
iy.08.040190.003513 PMID:2188678
16. Flannery B, Clippard J, Zimmerman RK, Nowalk MP, Jackson ML,
Jackson LA, et al. Early estimates of seasonal influenza vaccine
effectiveness - United States, january 2015. MMWR Morb
Mortal Wkly Rep. 2015;64(1):10-5. PMID:25590680
17. Skowronski DM, Chambers C, Sabaiduc S, De Serres G,
Dickinson JA, Winter AL, et al. Interim estimates of 2014/15
vaccine effectiveness against influenza A(H3N2) from Canada’s
Sentinel Physician Surveillance Network, January 2015. Euro
Surveill. 2015;20(4):21022.
18. World Health Organization (WHO). Recommended composition
of influenza virus vaccines for use in the 2015 southern
hemisphere influenza season. Geneva: WHO; 22-24 Sept 2014.
Available from: http://www.who.int/influenza/vaccines/virus/
recommendations/consultation201409/en/
References
1. Department of Health. Public Health England. The national
flu immunisation programme 2014/15. London: Public Health
England. 28 Apr 2014. Available from: https://www.gov.uk/
government/uploads/system/uploads/attachment_data/
file/316007/FluImmunisationLetter2014_accessible.pdf
2. Public Health England (PHE). PHE Weekly National Influenza
Report – week 4 report. London: PHE. 22 Jan 2015. Available
from: https://www.gov.uk/government/uploads/system/
uploads/attachment_data/file/397454/Weekly_report_
current_week_4x.pdf
3. Fleming DM, Andrews NJ, Ellis JS, Bermingham A,
Sebastianpillai P, Elliot AJ, et al. Estimating influenza vaccine
effectiveness using routinely collected laboratory data. J
Epidemiol Community Health. 2010;64(12):1062-7. http://
dx.doi.org/10.1136/jech.2009.093450 PMID:19910645
4. Andrews N, McMenamin J, Durnall H, Ellis J, Lackenby A,
Robertson C, et al. Effectiveness of trivalent seasonal
influenza vaccine in preventing laboratory-confirmed influenza
in primary care in the United Kingdom: 2012/13 end of season
results. Euro Surveill. 2014;19(27): 20851. http://dx.doi.
org/10.2807/1560-7917.ES2014.19.27.20851 PMID:25033051
5. Ellis J, Iturriza M, Allen R, Bermingham A, Brown K, Gray J, et
al. Evaluation of four real-time PCR assays for detection of
influenza A(H1N1)v viruses. Euro Surveill. 2009;14(22):19230.
PMID:19497254
6. Gunson R, Maclean A, Davies E, Bennett S, Miller R,
Carman WF. Development of a multiplex real-time RT-PCR
that allows universal detection of influenza A viruses and
simultaneous typing of influenza A/H1N1/2009 virus. J Virol
Methods. 2010;163(2):258-61. http://dx.doi.org/10.1016/j.
jviromet.2009.10.006 PMID:19854220
7. Galiano M, Agapow P-M, Thompson C, Platt S, Underwood A,
Ellis J, et al. Evolutionary pathways of the pandemic influenza
A (H1N1) 2009 in the UK. PLoS ONE. 2011;6(8):e23779. http://
dx.doi.org/10.1371/journal.pone.0023779 PMID:21887318
8. Matrosovich M, Matrosovich T, Carr J, Roberts NA, Klenk HD.
Overexpression of the alpha-2,6-sialyltransferase in MDCK
cells increases influenza virus sensitivity to neuraminidase
inhibitors. J Virol. 2003;77(15):8418-25. http://dx.doi.
org/10.1128/JVI.77.15.8418-8425.2003 PMID:12857911
9. Zambon M. Laboratory Diagnosis of Influenza. In: Nicholson
K, Hay A, Webster RG, editors. Textbook of Influenza. Oxford:
Blackwell Science; 1998. pp. 291-313].
10. Tamura K, Stecher G, Peterson D, Filipski A, Kumar S. MEGA6:
Molecular Evolutionary Genetics Analysis version 6.0. Mol Biol
Evol. 2013;30(12):2725-9. http://dx.doi.org/10.1093/molbev/
mst197 PMID:24132122
11. Centers for Disease Prevention and Control (CDC). CDC Health
Advisory Regarding the Potential for Circulation of Drifted
Influenza A (H3N2) Viruses. Atlanta: CDC. 3 Dec 2014. Available
from: http://emergency.cdc.gov/HAN/han00374.asp
12. Broberg E, Snacken R, Adlhoch C, Beauté J, Galinska M,
Pereyaslov D, et al. Start of the 2014/15 influenza season
in Europe: drifted influenza A(H3N2) viruses circulate as
dominant subtype. Euro Surveill. 2015;20(4):pii=21023.
Available from: http://www.eurosurveillance.org/ViewArticle.
aspx?ArticleId=21023
13. World Health Organization (WHO). Review of the 2014 influenza
season in the southern hemisphere. Wkly Epidemiol Rec.
2014;89(48):529-41.
14. ECDC Circulation of drifted influenza A(H3N2) viruses in the EU/
EEA http://ecdc.europa.eu/en/publications/Publications/RRAInfluenzaA-H3N2-Dec-2014.pdf
15. Wilson IA, Cox NJ. Structural basis of immune recognition
of influenza virus hemagglutinin. Annu Rev Immunol.
www.eurosurveillance.org
7


© Copyright 2026