
Microaerophilic property of Actinobacillus actinomycetemcomitans in
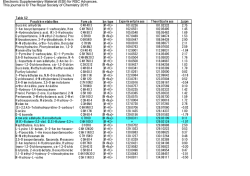
MICROBIOLOGY
LE-ITERS
FEMS Microbiology
Letters 138 (1996) 191-196
Microaerophilic property of Actinobacihs
actinomycetemcomitans in fructose-limited chemostat cultures
Hiroyuki Ohta a’*, Daisuke Moriki b, Atsushi Miyagi a, Tatsuo Watanabe b,
Keijiro Kato a, Kazuhiro Fukui a
a Departmentsqf Microbiology,OkavamaCJnioersiO
Dental School,Shikata-cho2-chome, Okayama 700, Japan
b Departmentsof Preventive Dentistry, Okayama Unioersity Dental School, Shikata-cho 2.chome, Okayama 700, Japan
Received 29 January
1996; revised 14 March 1996; accepted
14 March 1996
Abstract
The effect of oxygen on the growth, metabolism, and leukotoxin production of Actinobacillus actinomycetemcomitans
301-b was examined using a chemostat equipped with a redox potential control system. Steady states were obtained with
fructose-limited cultures grown at a dilution rate of 0.1 h- ’ under strictly anaerobic (E, = - 460 mV) and microaerobic
conditions (E, I - 150 mV1 but not under highly aerated conditions (E, 1 - 100 mV). The optimum growth was recorded
at E, = - 300 to - 200 mV and the recorded Y,,,,,, value was about 1.3 times the YrrUCtOSe
of anaerobic cultures. Although
the organism contains a respiratory chain, the increased YfrUCtOSe
under the microaerobic conditions might result from the
increased substrate-level phosphorylation at the site of acetate kinase but not from electron transport phosphotylation. After
passing threshold aeration (E, = - 100 mV), the culture yielded a variant with transparent colony morphology. Under
anaerobic conditions, the Yn.,,Ct,,s,
of the variant was about 1.6 times that of the original opaque colony-forming cells. The
optimum growth of the variant was also recorded at E, = - 300 to - 200 mV. In both types of cells, the production of
leukotoxin reached a maximum at E, = - 350 to - 200 mV. These findings suggested the microaerophilic nature of A.
actinomycetemcomitans.
Keywords: Actinobacillus
actinomycefemcomitans;
Leukotoxin;
Chemostat
1. Introduction
Actinobacillus actinomycetemcomitans
is a facultatively anaerobic, Gram-negative
coccobacillus that
has been implicated as the agent responsible
for
some severe types of human periodontal disease [I].
A major virulence factor in the pathogenicity of this
bacterium is its ability to produce a polypeptide
* Corresponding author. Tel: + 81 (86) 223-7151 ext. 5251;
Fax: + 81 (86) 222-4572: E-mail: [email protected]
0378-1097/96/$12.00
0 1996 Federation
PII SO378-1097(96)00105-X
of European
Microbiological
culture; Microaerophilic
growth
toxin (leukotoxin) [2]. In several culture studies, A.
actinomycetemcomitans
is found in higher proportions in moderate (5-7 mm in depth), than in deeper
pockets [3]. Moderate pockets exhibited higher oxygen tension values than deeper pockets 141. Therefore, conditions especially favorable for the growth
of A. actinomycetemcomitans,
probably moderate
amounts of oxygen, may be encountered frequently
in moderate periodontal pockets. Although A. actinomycetemcomitans
is described as being facultatively anaerobic or microaerophilic [5], little is known
Societies. All rights reserved
H. Ohtu et d. / FEMS Microhiolop
192
about the effect of oxygen on its growth and
metabolism.
In this study, we analyzed the growth of A.
actinomycetemcomitans
and leukotoxin production in
chemostat cultures exposed to various levels of aeration. We calculated several growth parameters to
evaluate the extent to which A. actinomycetemcomitans uses its aerobic systems under aerobic conditions.
2. Materials
and methods
2.1. Bacterial strain and chemostat
culture
A. actinomycetemcomitans
301-b [6] was grown
in fructose-limited
chemostat cultures. The chemostat equipment, and the composition of the medium
were as described [6]. In the chemostat system the
redox potential was measured continuously
using a
platinum electrode with an Ag/AgCl
reference cell
and used to control the stirring speed in the culture.
The electrode signal was measured with a potentiometer (Model FO-11, Tokyo Rikakikai, Tokyo,
Japan) calibrated against a quinhydrone
reference
solution at pH 4.0. With all other environmental
factors constant, manipulation
of the air flow in
combination with the feedback control on the stirring
speed made it possible to maintain a constant redox
potential within narrow limits (f2-5
mV> [7].
Anaerobic cultures were maintained under a stream
of oxygen-free N?. In some experiments, the oxygen
concentrations
were continuously
measured using a
polarographic oxygen electrode (Ingold Messtechnik
AG, Urdorf, Switzerland). Cultures were incubated
at 37°C and at pH 7.0 with the automatic addition of
2 M NaOH or 2 M HCl. The optical density at 660
nm COD,,,) of cultures was measured in a 1 cm
cuvette to determine the cell density by the averaged
coefficient of the dry weight cells at OD,,, (0.852
mg [dry weight] cells per ml per OD unit) [6]. The
purity of the cultures was routinely checked on
tryptic soy agar (BBL Microbiology Systems) plates.
2.2. Chemical analysis
Acid products (formate, lactate, and succinate),
ethanol, and bicarbonate were determined by gas-
Letters 138 f 19M) 19/-/M
liquid chromatography,
and fructose by the enzymatic method as described [6]. Acetate was determined using an enzyme system consisting of acetylCoA synthetase, citrate synthase, and malate dehydrogenase (Boehringer Mannheim).
2.3. Extraction
and determination
of leukotoxin
The procedure for the extraction of leukotoxin
from whole cells was essentially as described [8,9].
In brief, bacterial cells sampled from the chemostat
were incubated with a mixture of DNase I (100 U
ml ’ ) (Sigma) and RNase A (0.1 mg ml ’ > (Sigma)
at 25°C for 30 min in 100 mM acetate buffer (pH
5.0) containing 150 mM NaCl and 5 mM MgSO, .
7H ?O. After centrifugation at 10 000 X g for 10 min,
the supematant (nuclease digest) containing the toxin
was collected. Leukotoxin was recovered from culture supematants
as described [9]. These samples
were analyzed by sodium dodecyl sulfate (SDS)polyacrylamide
gel electrophoresis (PAGE) [ 101 and
by immunoblotting
against an antileukotoxin
serum
[8]. Proteins on the gel were visualized by silver
staining and the gel was analyzed densitometrically
using a Beckman DU-8 spectrophotometer
installed
with a Beckman slab gel scanning system at a wavelength of 660 nm (A,,,).
To construct a standard
curve for the leukotoxin concentration,
serial dilutions of the purified M, 113 000 leukotoxin (0 to 100
pg/ml)
[81 were analyzed together with the samples
on the same gel. The relationship between leukotoxin
concentration and the A,,, value was linear up to an
A hbOof 0.6.
3. Results and discussion
A. actinomycetemcomitans
301-b was grown at a
dilution rate of 0.1 h ’ in a strictly anaerobic fructose-limited chemostat culture. In the steady state, an
E, value was obtained of about -460 mV. With a
stepwise increase in the extent of aeration, steady
states were reached at E, values of -300,
-250,
- 200 and - 150 mV (run 1 in Table 1). At an E,
value of - 100 mV the cells began to wash out.
Thereafter, the culture was returned to anaerobic
conditions and the effect of aeration on the growth
was repeatedly examined. In the second run of the
H. Ohta et al. / FEMS Microbiology
Table 1
Effect of aeration on the growth parameters
’)
Letters 138 (19%) 191-l%
of A. actinomycetemcomitans
301-b grown in fructose-limited
Run b
E, (mV1
Y,,,,,,
Colony type in the culture ’
Carbon recovery
1
-460
-300
- 250
-200
-150
-100
31.1
49.6
48.4
49.4
39.0
_h
0 type
78
86
83
74
68
-460
- 350
- 250
- 150
-100
-460
44.8
59.9
57.3
51.5
nd
nd
nd
nd
53.9
-410
-300
-200
- 150
-100
-420
2
3
(g mol-
193
d
ATP-Eff
chemostat
’ (mol mol- ’ )
cultures a
YATp(g mol-
2.94
[3.28] g
i3.491
f3.451
[3.42]
12.6
f15.11
[ 13.91
l14.31
Ill.41
81
71
66
47
2.96
[3.141
13.471
[3.36]
-
15.1
119.11
[16.5]
115.31
0 type and T type
85
3.01
17.9
60.1
70.7
76.8
66.5
T type
nd
nd
nd
91
81
65
41
2.95
L3.351
L3.581
L3.171
20.4
[21.11
[21.5]
[21.01
59.5
T type
nd
2.95
20.2
nd f
nd
nd
nd
’)
_
a Cultures were grown at a dilution rate of 0.10 hh ’ and at pH 7.0.
b Input fructose concentration: runs 1 and 2, 10 mM; run 3, 7 mM.
’ Colony type, see text and Fig. 2.
d Carbon recovery was calculated from the steady-state concentrations
of fermentation products (formate, acetate, ethanol, succinate,
bicarbonate).
e The efficiency of ATP generation during fructose catabolism (ATP-Eff), see text.
f nd, not determined.
g Figures in brackets represent the expected values when fructose fermentation is the sole source of ATP under aerobic conditions.
h A steady state could no longer be obtained and the cells were washed out.
experiment, steady states were obtained at E, values
of - 350, - 250, and - 150 mV but could not be
regained at E, = - 100 mV (run 2 in Table 1). In all
the cultures the concentrations of residual fructose
remained below the detection limit (50 PM) of the
enzymatic assay.
When an aliquot of the final anaerobic chemostat
culture (run 2) was anaerobically incubated on tryptic soy agar plates, the original smooth-surfaced
opaque (0 type) and smooth-surfaced transparent (T
type) colonies appeared (Fig. 1). Fresh isolates of A.
actinomycetemcomitans form rough-surfaced transparent (TR) colonies with a star-like inner structure
and repeated subcultures of TR cells yield T type
and then 0 type colonies [ 11,121. By subculturing on
agar media and broth, T type cells yield 0 type
colonies, but the 0 type cells do not yield the T type
[12]. In the present chemostat culture experiments,
the threshold aeration (E, = - 100 mV) seemed to
and
induce the reversion from the 0 type to the T type
cells. The T type cells showed a coccoidal rod shape
nearly identical to that of 0 type ceils (data not
shown). When single T and 0 type colonies were
selected individually and whole cells from each subculture analyzed by SDS-PAGE, no significant dif-
‘0
Fig. 1. Smooth-surfaced
transparent (T) and opaque (0) colonies
of A. actinomycetemcomituns
301-b.
H. Ohta et al./ FEMS Microbiology
194
ference between their cellular protein profiles was
recognized (data not shown). The subcultured T type
cells were further grown in a strictly anaerobic,
fructose-limited
chemostat culture to examine the
effect of aeration on the growth. A steady state of the
initial anaerobic culture exhibited an E, value of
about -410 mV. With increasing aeration in the
culture, steady states were obtained at E, values of
- 300, - 200, and - 150 mV (run 3 in Table 1).
Dissolved oxygen concentrations
in these aerated
cultures remained below 0.1 /IM (the detection limit
of the oxygen electrode used). Increasing E, further
to - 100 mV led to a decrease in the cell density
followed by a washout. During the decline in the cell
density the dissolved oxygen concentration
and E,
value of the culture increased sharply. In all the
steady-state cultures the concentrations
of residual
fructose remained below 50 PM.
The molar growth yield (Y,,,,,,,), expressed as g
(dry weight) cells per mol fructose consumed, was
calculated for each of the steady-state cultures (Table
1). Fig. 2 shows plots of YtTUCtOhE
against E, value
for the three runs of the experiment. Two striking
characteristics of the growth response to increasing
aeration were recognized. First, in all the three runs,
the YfructOIeincreased to a maximum between E,
values of - 300 and -200 mV and at an E, of
- 150 mV the YrIucto\edeclined. This result indicated
the microaerophilic nature of both the 0 and T type
cells of A. actinomycetemcomitans.
Second, the
-500
-300
-100 -500
Redox
Letters 138 (19961 191-196
values for the T type cells (run 3) were
Ytl.“CtOlC
higher than those for the 0 type (run I). The second
run of experiments
(run 2) showed intermediate
values
between
those of the 0 and T type
YfT”ClO\C
cells, which seemed due to the coexistence of the 0
and T type cells in the culture. To address the
difference between the Yfructosevalue of the 0 type
and that of the T type, the efficiency of ATP generation during fructose fermentation (ATP-Eff) and the
growth yield referred to in moles of ATP produced
( YArp, g [mol ATPI- ’ > were estimated (Table 1). In
A. actinomycetemcomitans,
fructose is fermented primarily by the Embden-Meyerhof-Pamas
pathway to
phosphoenolpyruvate
(PEP) or pyruvate, then to a
mixture of formate, acetate, ethanol, and succinate
[6]. Since ATP is possibly gained at three different
steps catalyzed by phosphoglycerate kinase, pyruvate
kinase, and acetate kinase, the ATP-Eff and Y,,,
values were calculated from the following equation
[61:
ATP-Eff = ( 2[fructose],,,,,,,d
+ [acetate],,,,,)
/[f~cto~elcon,umed
Y,,,
= Y,ucmJATP-Eff
where [fructose],,,,,,,,
is the amount of fructose
consumed and [acetate],,,,,
is the amount of acetate
formed in steady-state cultures.
The ATP-Eff value (2.95) of the anaerobic culture
of T type cells was nearly equal to that (2.94) of 0
-300
potential
-100
-500
-300
-100
(mV)
Fig. 2. The growth yield (0) and leukotoxin production (0) of A. uctinomvcetemcomitans
301-b grown in fructose-limited
cultures with exposure to different levels of aeration. Cultures were grown at a dilution rate of 0. I h-’ and at pH 7.0.
chemostat
195
H. Ohta et al./ FEMS Microbiology Letters 138 (19961 191-196
was very high (65-86%), suggesting that fructose
was catabolized primarily by the fermentation pathway under aerobic conditions. Assuming that fructose fermentation is the sole source of ATP even
under aerobic conditions, the Y,,, of the T type cells
grown at E, = - 200 mV is estimated as 21.5 g
mol-‘. This YATPvalue is not very different from
the yATp of 20.3 g mol-’ in the anaerobic culture of
the T type cells. These considerations suggest that
the respiratory system is not coupled to phosphorylation in the fructose-limited chemostat cultures and
that the maximum values of Yfructose
recorded in the
cultures at E, = - 300 to - 200 mV resulted from
increased acetate formation coupled with substratelevel phosphorylation.
To examine leukotoxin production, nuclease digests of whole cells and culture supematants were
prepared from each of the steady-state cultures. In all
the cultures, most of the leukotoxin produced was
associated with nucleic acids on the bacterial cell
surface and thus recovered in the nuclease digest
[8,9]. The cellular content of leukotoxin, expressed
as pg (mg [dry weight] cells)-‘, was calculated
from the amount of leukotoxin in the nuclease digest
as shown in Fig. 2. The production of leukotoxin
reached a maximum between E, values of -350
and -200 mV and declined sharply at an E, of
- 150 mV. The maximum value recorded was 1.31.6 times the anaerobic value. The responses of
leukotoxin production and of Yfructo\eto oxygen
type cells. Therefore, the YATPvalue of T type cells
(20.2-20.4 g mol-’ ) was estimated to be 1.6-fold
higher than that of the 0 type cells (12.6 g mol- ’ >.
These calculations indicate that in T type cells, the
use of ATP for biosynthesis is significantly more
efficient than that in 0 type cells.
The amounts of the fermentation products, formate, acetate, ethanol, and succinate, varied according to the extent of aeration in the culture (Fig. 3). In
the three runs of experiment, ethanol and succinate
production fell successively as the E, increased.
Conversely, formate and acetate production increased to a maximum between E, values of - 300
and -200 mV. Under anaerobic conditions, the
conversions of pyruvate (or PEP) to ethanol and
succinate functions to oxidize the NADH generated
in the degradation of fructose to pyruvate [6]. Under
aerobic conditions, A. actinomycetemcomitans
has
another option to regenerate NAD+. Mannheim et al.
[ 131 have reported that A. actinomycetemcomitans
contains desmethylmenaquinone as the respiratory
component and uses oxygen, nitrate, and fumarate as
electron acceptors. Therefore, it can be expected that
in the aerated chemostat cultures, the respiratory
system catalyzed oxidation of NADH and thus electron transport phosphorylation occurred. To address
this point, the carbon recovery from acidic fermentation products and Y,,, were estimated (Table 1). In
the aerated cultures with the maximum YfnlCtOSe
values (E, = - 300 to - 200 mV), the carbon recovery
Run 1
Run
-100
-500
Redox
2
-300
potential
Run
-100
3
-500
(mV)
Fig. 3. Production of formate (0). acetate (O), ethanol (A ),and succinate (A ) by A. actinomycetemcomitans 301-b in fructose-limited
chemostat cultures with exposure to different levels of aeration. Cultures were grown at a dilution rate of 0.1 h-’ and at pH 7.0.
196
H. Ohta et al./ FEMS Microbiology
seemed different. The former curve reached a maximum at a lower aeration level than the latter. This
suggests that the production of leukotoxin is more
sensitive to oxygen than growth and that it may be
regulated by oxygen concentration.
In the oral ecosystem, an oxygen-respiring
facultative anaerobe, Actinomyces Liscosus. is predominant. In the presence of oxygen, the organism shifts
from fermentation to respiration of carbohydrate and
increases the growth yield up to 2.4 times the anaerobic value [14]. Therefore, the advantage of A.
uiscosus over other oral microorganisms
may increase in an environment
with higher oxygen tension. Thus, from ecological
aspects,
the microaerophilic
nature of A. actinomycetemcomitans
might explain the specific distribution of the organism in the moderate pockets, where oxygen concentrations are relatively low and thus a competitive
advantage is gained over oxygen-respiring
facultatative anaerobes such as A. uiscosus.
Acknowledgements
This work was supported
by Grants-in-Aid
(04304044 and 06671812) for Scientific Research
from the Ministry of Education, Science and Culture
of Japan.
References
[I] Zambon, J. (1985) Actinobacillus actinom~cetemcomituns
in
human periodontal disease. J. Clin. Periodontol. 12, I-20.
[2] Tsai, C.-C., Shenker, B.J., DiRienzo, J.M., Malamud, D. and
Taichman, N.S. (1984) Extraction and isolation of a leukotoxin from
Actinobacillus
uctinomyetemcomituns
with
polymyxin B. Infect. Immun. 43, 700-705.
Letters 138 (19961 191-196
[31Dzink, J.L., Tanner, A.C.R., Haffdjee, A.D. and Socransky.
S.S. (1985) Gram negative species associated with active
destructive periodontal lesions. J. Clin. Periodontol. 12, 64%
659.
[41Loesche, W.J., Gusberti, F.. Mettraux, G., Higgins, T. and
Syed, S. (1983) Relationship between oxygen tension and
subgingival bacterial flora in untreated human periodontal
pockets. Infect. Immun. 42, 659-667.
[51Phillips, J.E. (1984) In: Bergey’s Manual of Systematic
Bacteriology (Krieg, N.R. and Holt, J.G., Eds.), Vol. I, pp.
570-575, Williams and Wilkins, Baltimore.
[61 Ohta, H., Fukui, K. and Kato, K. (1989) Effect of bicarbonate on the growth of Actinobacillus actinomwetemcomitans
in anaerobic fructose-limited
chemostat cultures. J. Gen.
Microbial. 135, 3485-3495.
growth
[71Ohta, H. and Gottschal, J.C. (1988) Microaerophilic
of Wolinella recta ATCC 33238. FEMS Microbial. Ecol. 53,
79-86.
[81 Ohta, H., Kato, K., Kokeguchi, S., Hara, H., Fukui, K. and
Murayama, Y. (1991) Nuclease-sensitive
binding of an Actinobacillus actinomwetemcomitans
leukotoxin to the bacterial cell surface. Infect. Immun. 59, 4599-4605.
[91Ohta, H., Hara, H., Fukui, K., Kurihara, H., Murayama, Y.
and Kato, K. (1993) Association of Actinobacillus actinomyetemcomitans
leukotoxin with nucleic acids on the bacterial cell surface. Infect. Immun. 61, 4878-4884.
[IO1 Laemmli, U.K. (1970) Cleavage of structural proteins during
the assembly of the head of bacteriophage T4. Nature 227,
680-685.
[I 11 Slots, J. (1982) Selective medium for isolation of Actinobacillus actinomyetemcomitans.
J. Clin. Microbial.
15.
606-609.
[I21 Inouye, T., Ohta, H., Kokeguchi, K., Fukui, K. and Kato, K.
(1990) Colonial variation and fimbriation of Actinobacillus
acfinomyetemcomifans.
FEMS Microbial. Lett. 69, 13- 18.
II31 Mannheim, W., Stieler, W.. Wolf, G. and Zabel, R. (1978)
Taxonomic significance of respiratory quinones and fumarate
respiration in Actinobacillus and Pasteurella. Int. J. Syst.
Bacterial. 28. 7-13.
[I41 De Jong, M.H., Van der Hoeven, J.S., Van den Kieboom,
C.W.A. and Camp, P.J.M. (1988) Effects of oxygen on the
growth and metabolism of Actinomyces riscosus. FEMS
Microbial. Ecol. 53, 45-52.


© Copyright 2026