
Overnight Access to Sugar Solutions Affects mRNA Expression of
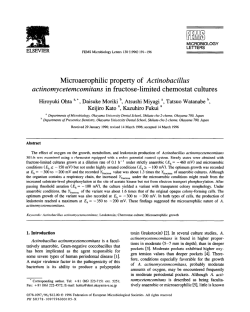
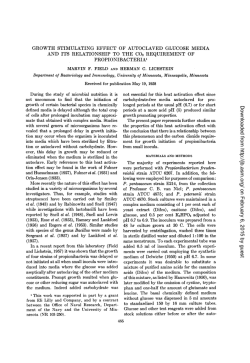
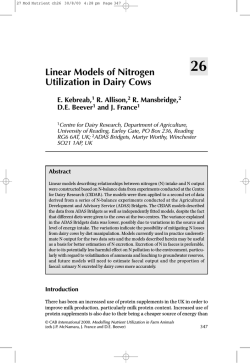
Journal of Food and Nutrition Research, 2015, Vol. 3, No. 1, 69-76
Available online at http://pubs.sciepub.com/jfnr/3/1/12
© Science and Education Publishing
DOI:10.12691/jfnr-3-1-12
Overnight Access to Sugar Solutions Affects mRNA
Expression of Several Neuropeptides in Different
Hypothalamic Regions in Rats
Changhui Zhao, Eric S. Campbell, Anna E. Tschiffely, Thomas W. Castonguay*
Department of Nutrition and Food Science, University of Maryland, College Park
*Corresponding author: [email protected]
Received January 14, 2015; Revised January 24, 2015; Accepted February 01, 2015
Abstract It has been known for years that free access to sugar solutions can cause weight gain and/or obesity in
rats. We recently reported that brief access to sugar solutions can affect the hypothalamic neuropeptides that help to
regulate energy balance. In this paper, we present the results in which we examined the effects of these sugars on the
expression of several neuropeptides within specific hypothalamic regions. We provided Sprague Dawley rats 24 h
access to 15% solutions of glucose, fructose, sucrose or high fructose corn syrup (HFCS) and then dissected portions
of the paraventricular hypothalamic nuclei (PVN), the ventromedial hypothalamus (VMH) and the lateral
hypothalamus (LH). We then evaluated the expression of several neuropeptides in these tissues, all of which were
previously shown to be influenced by free access to sugar solutions using PCR array. Of the four sugar solutions
tested, only fructose decreased expression of cholecystokinin (CCK) significantly, and only in the PVN. Glucose
and sucrose significantly increased the expression of Tumor Necrosis Factor α (TNF-α) only in the PVN. Fructose
and sucrose decreased Growth Hormone (GH) in the VMH. Further analysis indicated that it was fructose intake that
was negatively correlated with both CCK and GH expression. Rats that had access to sugar solutions consumed less
chow but maintained control levels of total caloric intake. We conclude that 24 h free access to different sugars can
influence the expression of several hypothalamic neuropeptides in different ways. Changes in the expression of these
neuropeptides do not disrupt total daily energy intake immediately but may nevertheless contribute to the obesity
caused by long term access to sugar solutions.
Keywords: fructose, HFCS, glucose, sucrose, energy regulation
Cite This Article: Changhui Zhao, Eric S. Campbell, Anna E. Tschiffely, and Thomas W. Castonguay,
“Overnight Access to Sugar Solutions Affects mRNA Expression of Several Neuropeptides in Different
Hypothalamic Regions in Rats.” Journal of Food and Nutrition Research, vol. 3, no. 1 (2015): 69-76. doi:
10.12691/jfnr-3-1-12.
1. Introduction
It has been known for years that long term ad libitum
access to sugar solutions (glucose, sucrose or fructose) can
induce excessive weight gain and/or obesity in rats [1,2].
Similarly, long term free access to HFCS -55 solutions
can also induce overweight and obesity [3]. When
laboratory rats are fed a standard chow diet, they maintain
energy balance: they match energy expenditure and
energy intake [4]. Giving rats long term access to sugar
solutions disrupts energy balance so as to induce obesity.
The question is: “Which mechanism(s) is (are) involved in
promoting sugar induced obesity?”
Energy intake is controlled by both peripheral and
central regulators. Not all sugars are equally effective in
promoting changes in these metabolic controls. For
example, unlike glucose intake, fructose intake can
quickly induce hypertriglyceridemia [5], a condition that
frequently coexists with obesity, type 2 diabetes and
metabolic syndrome. We have recently reported that
fructose consumption can quickly suppress the expression
of 11β-hydroxysteroid dehydrogenase type 1 (11β -HSD1)
in liver and visceral adipose tissue [6] leading to
regeneration of intracellular glucocorticoids. Increased
intracellular glucocorticoids are commonly observed in
obesity in human and animal models [7,8]. Both of these
effects are examples of how a nutrient (in this case sugars)
can have a dramatic effect on gene expression and in that
way change short term regulation.
Sugars can have differing effects on the hypothalamus,
the brain’s food intake control center, where appetite,
motivation and reward processing functions are regulated
[9]. Different hypothalamic structures and regions influence
hunger and satiety. For example, Stellar proposed that the
VMH and LH acted together to control food intake [10].
The “Dual Center Hypothesis” was one of the most
studied theses in 20th century neurophysiology. The PVN
was added to this mix later, noting that there were
differences in metabolic and behavioral controls of hunger
[11]. Many neuropeptides synthesized in these hypothalamic
regions play critical roles in energy maintenance [4].
70
Journal of Food and Nutrition Research
We have hypothesized that brief access to sugar
solutions can change the expression pattern of specific
hypothalamic neuropeptides that control energy balance.
We recently measured 84 obesity-related genes (using
PCR arrays) in the hypothalamus of Sprague Dawley rats
fed different sugar solutions. We found that several
hypothalamic neuropeptides are affected differently by
different sugar intakes from solution [12]. These neuropeptides
include CCK, TNF-α, GH, receptor activity modifying
peptide (RAMP3), corticotropin releasing hormone (CRH)
and thyrotropin releasing hormone (TRH). Interestingly,
two important orexigenic neuropeptides -neuropeptide Y
(NPY) and Agouti related peptide (AgRP) in the arcuate
nucleus (ARC) were not changed after sugar access. It
might be that brief sugar intake from solution somehow
bypasses ARC and acts on the other hypothalamic regions.
As a result, the purpose of the present study was to
examine how these neuropeptides were affected by
different sugars in three hypothalamic regions - the PVN,
the VMH and the LH.
2. Materials and Methods
2.1. Animals
Forty adult male Sprague-Dawley (CD strain) rats of
approximately 300 g body weight (Charles River
Laboratories, Wilmington, MA) were used. They were
maintained on a 12 h light/dark cycle (lights on at 0800h)
in a temperature controlled animal room (22± 1°C).
During a 1 week acclimation period the rats were given
free access to water and chow. The chow was a
nutritionally complete low fat diet [Rodent diet 7012]
prepared by Harlan Teklad (Bethlehem, PA). The chow
contained 3.41 kcal/g of diet, of which 2.14 kcals were
derived from carbohydrate, 0.79 kcals were derived from
protein, and 0.51 kcals derived from fat. All animals were
given free access to chow and water throughout the
experiment.
2.2. Sugar Treatment
Rats were randomly assigned to one of five weightmatched groups (n= 8/group). One group of rats had ad
libitum chow and water and served as the control group.
Rats assigned to the other groups had ad libitum access to
chow and water as well as to one of four solutions: a 15%
weight/volume (w/v) fructose (Tate & Lyle, Decatur IL)
solution, a 15% (w/v) glucose (Sigma Aldrich, St Louis
MO) solution, a 15% (total solute per volume) high
fructose corn syrup (HFCS) (IsoSweet® 5500, 55%
fructose–41% glucose, 77% solids, Tate & Lyle, Decatur
IL) or a 15% (w/v) sucrose (Domino Foods, Baltimore
MD) solution. All sugar solutions were prepared 24 h in
advance and stored at 4°C until used. The rats were
maintained with free access to their respective diets for
24h before sacrifice (at approximately 9:00 am). This
method was chosen so as to minimize the stress associated
with administering fixed volumes of solution intragastrically,
as weight gain is thought to be facilitated by increased
glucocorticoids. All rats were killed by slow replacement
of air in a specialized chamber with pure CO2 followed by
rapid decapitation and exsanguination. At the time of
sacrifice, the brains were dissected, snap frozen in
isopentane/dry ice and then stored at -80 °C until use.
2.3. Brain Sectioning
Frozen brains were embedded using M1 embedding
matrix (Lipshaw, Pittsburgh, PA) on dry ice. An IEC
Minot Custom Microtome (Damon/IEC Division) was
used for cryosectioning. The cryostat’s blade and antiroll
plate were pretreated with RNaseZap® to remove any
possibility of RNase contamination and then cleaned with
a paper towel soaked in DEPC-treated water. Slices were
obtained from Interaural 7.70 mm (Bregma -1.30 mm) to
Interaural 4.48 mm (Bregma -4.52 mm) at a thickness of
110 µm each and carefully transferred to pre-cleaned
slides (Fisher Scientific, Pittsburgh, PA). The slices were
then stored at -80 °C until sampled.
2.4. Sampling of Hypothalamic Regions
RNA is unstable and subject to degradation. When
following standard staining procedures, brain slices can
lose as much as 10% of their initial RNA in as little as 30
minutes [13]. Water is the key factor that facilitates RNA
degradation, however RNA integrity can be preserved up
to 90 min following ethanol dehydration [13]. Preliminary
tests showed that cresyl violet staining did not reveal
internal hypothalamic structures quickly. Rather than
attempt to stain the sections, we employed a three-step
alcohol dehydration procedure (95% alcohol immersion
for 30 seconds, followed by 100 % alcohol immersion for
1min and then another 100 % alcohol immersion for at
least an additional minute). After dehydration, the slices
were immediately dissected under a light microscope.
Centered on the third ventricle, several 110 µm slices of
each region (PVN, VMH and LH) were dissected using
sterile 23 G x 1” hypodermic needles (B-D PrecisionGlide,
Franklin Lakes. NJ). Specifically, 6-7 brain slices were
used for PVN dissection. PVN sampling was initiated
approximately at -1.30 mm behind Bregma. VMH and LH
samples were dissected starting at around -2.12 mm
behind Bregma. Captured tissues were carefully
transferred into 1.5 ml polypropylene eppendorf tubes on
ice. 350 µl RLT lysis buffer (containing10 μl βmercaptoethanol per 1 ml Buffer RLT) was added and
samples were then subjected to 30 sec vortexing for cell
breakage and RNA release. Samples were stored at -80 °C
until RNA extraction.
2.5. RNA Extraction and cDNA Synthesis
Tissue lysates were thawed in a 37℃ water bath until
all the salts were dissolved. VMH and LH lysates were
centrifuged using an Eppendorf centrifuge (model 5424)
at full speed for 3 min to remove the cell debris. Samples
from all three regions were then processed using a Qiagen
RNeasy micro kit. This kit included DNase I to remove
DNA that might affect the downstream applications. RNA
quality was examined using a NanoDrop 2000
spectrophotometer (A260/A280 >1.8). The cDNA
synthesis was completed using iScript™ cDNA Synthesis
Kit (Bio-Rad) following the manufacturer’s protocol. The
final cDNA products were stored at -20 °C until use.
Journal of Food and Nutrition Research
2.6. Quantitative real time PCR
PCR reactions were performed in two replicates using
iQ SYBR Green Supermix and a Bio-Rad CFX96 BioRad system. The program used for all PCR reactions was
95°C for 3 min and 40 cycles of 95°C for 15 sec,
71
annealing temperature (Ta) for 30 sec (see Table 1) and
68°C for 30 sec. A melting curve program was then
appended. All primers that were designed using Beacon
Designer 7 software met the ΔΔCt requirement for the
product length less than 200 bp.
Table 1. Primer set
Primer Name
sequences (5' to 3')
RPLP1 sense
GAAGAATCCGAGGATGACA
RPLP1 antisense
CAGGTTCAGCTCTTTATTGG
CCK sense
GCGTTTATTTATTAAGTCC
CCK antisense
ATAGCATAGCAACATTAG
Tnf-α sense
CCAATCTGTGTCCTTCTAA
Tnf-α antisense
TTCTGAGCATCGTAGTTG
RAMP3 sense
CAAGGTCATCTGGAAGGT
RAMP3 antisense
GACTCCTAACAACTCCATTC
GH sense
GTCTGTTTGCCAATGCTGTG
GH antisense
TGGGATGGTCTCTGAGAAGC
TRH sense
AAAGACATTGAAGCTGAAGAGAGG
TRH antisense
GGGGTGCTGTCGTTTGTG
CRH sense
TGGAGATTATCGGGAAAT
CRH antisense
TACATCTTCTATGCTTCAAG
2.7. Data Analysis
The formula below was used to plot the final result
from qPCR data:
∆Ct (=
test ) Ct (target,test) − Ct ( ref , test )
∆Ct ( calibrator ) −∆Ct(test)
The Ct mean value from ribosomal protein, large, P1
(RPLP1) was used as the reference gene as before [12]
and the water treated group mean Ct was used as the
calibrator. All values were expressed as means ± SEM.
One way ANOVA with Duncan post hoc testing was
applied to food intake and energy intake using IBM SPSS
Statistics 21. Student’s t tests were used to determine
significance between groups using JMP Pro 10.0.2.
51
133
43
85
47
109
50
152
55
75
55
158
47
Pearson’s correlation coefficients were calculated to
evaluate the relationship between sugar intake from
solution and the expression of the specific neuropeptides.
P value less than 0.05 was considered statistically significant.
When sugars were presented, the chow intake in all
sugar fed groups decreased significantly compared with
the control group. Although rats fed with sucrose and
HFCS consumed nearly 10% more energy compared with
the control, the total caloric intakes of each group over the
24 h experimental period did not significantly differ from
one another. The percentage of total calories derived from
sugar intake from solution ranged from 44 to 53%. See
Table 2 for details.
Table 2. Calorie intake of rats fed with different sugars
Water
Glucose
Sucrose
Chow Intake (g)
28.8±3.3a
Sugar Intake from Solution (g)
NA
Chow Calorie (Kcal)
81
3.1. Food and Energy Intake
= Ct ( target, calibrator ) − Ct ( ref , calibrator )
Group
Ta (°C)
3. Results
∆Ct ( calibrator )
2−∆∆Ct = 2
Product Length (bp)
a
93.1±10.8
14.1±1.6b
15.2±2.3b
11.5±0.6
13.2±1.0
46.2±5.2
b
49.56±7.4
HFCS
Fructose
17.5±2.7b
17.6±3.7b
11.1±0.9
b
57.18±8.7
9.7±1.4
b
57.67±12.7 b
Sugar Calorie from Solution (Kcal)
NA
46.2±2.2
52.71±3.9
44.6±3.4
38.8±5.7
Total Calorie (Kcal)
93.1±10.8
92.3±4.8
102.3±7.8
101.8±7.0
96.4±15.2
52.8±4.9
45.9±5.6
44.3±5.2
NA
51.1±4.3
% calories intake as sugar from solution
Note: Values are means ± SEM
Values sharing a common superscript are not different from one another (P>0.05).
3.2. Neuropeptides Regulated by Sugars
3.2.1. CCK
Fructose downregulated CCK expression in the PVN
(p<0.05; Figure 1A). CCK expression was not changed in
the VMH or the LH (Figure 1B and 1C).
3.2.2. TNF-α
Glucose and sucrose intake significantly increased the
expression of TNF-α in the PVN (P<0.05). HFCS and
fructose groups failed to change TNF-α in the PVN
(Figure 1D). No differences between any groups were
found in the VMH or the LH (Figure 1E and 1F).
72
Journal of Food and Nutrition Research
3.2.3. GH
We failed to detect any GH in the PVN. In the VMH,
sucrose and fructose decreased GH expression (Figure 1G).
In the LH, sucrose and fructose decreased GH expression
when compared with glucose (Figure 1H).
Figure 1. Different sugars affect the expression of CCK, TNF-α and GH in the PVN, VMH and LH. (A-C) Fructose downregulated CCK mRNA
expression in the PVN (p<0.05), but not in VMH or the LH (D-F) Glucose and sucrose intake significantly increased the mRNA expression of TNF-α in
the PVN (P<0.05) but not in the VMH or LH. (G-H) In the VMH, sucrose, HFCS and fructose all decreased GH expression whereas only sucrose and
fructose decreased GH expression at a significant level (Figure 1G). Sucrose and fructose decreased GH expression in both VMH and LH when
compared with glucose
3.2.4. RAMP3, TRH and CRH
When compared to controls, none of the sugars tested
had a significant effect on RAMP3, TRH or CRH messages
(Figure 2). However, we did detect some differences of
RAMP3 and TRH between sugar groups. Both HFCS and
fructose significantly decreased RAMP3 mRNA expression
compared with glucose in the VMH (Figure 2B). In the
LH RAMP3 expression was only significantly reduced in
the HFCS group when compared to the glucose group
(Figure 2C). Both fructose and HFCS reduced TRH
expression when compared with sucrose in the PVN
(Figure 2D). No differences were found in the VMH or
LH (Figure 2E and 2F). We failed to detect any significant
difference in CRH in any regions tested (Figure 2G-I).
3.3. Effect of Fructose or Glucose on CCK,
TNFα and GH Expression
Pearson correlation analyses revealed that CCK
expression was regulated by fructose but not by glucose.
A statistically significant inverse correlation between
CCK expression in the PVN and fructose intake (r= -0.36,
p<0.05) was found (Figure 3A-B). No correlations
between fructose or glucose intake and TNF-α were
statistically significant (Figure 3C-D). GH expression is
inversely correlated with fructose intake (r=-0.44, p=0.01)
and positively correlated with glucose intake (r=0.59,
p<0.01) (Figure 3E-F). The correlations between fructose
or glucose intakes with other neuropeptides in any of the
three hypothalamic regions sampled failed to achieve
statistical significance.
4. Discussion
Sugar induced obesity is well documented, but how
sugars induce obesity is still not clear. Differences in
sugar metabolism in the liver are not sufficient to explain
how long term ad libitum sugar access can cause weight
gain and/or even obesity. We hypothesize that sugars can
affect the expression pattern of hypothalamic neuropeptides
that may bias energy balance in the long term. To test this
hypothesis, we gave rats brief access to different sugar
solutions. Our results showed that under ad libitum
conditions, fructose intakes were comparable (or even a
little lower(see also[14])) to intakes of other sugars. This
ad libitum method more closely mimics conditions that in
humans lead to excess caloric intake and obesity. It should
be noted that some popular sweetened drinks may have
over 12% sugar content [15] and some juices even have
higher sugar content [16].
Journal of Food and Nutrition Research
73
Figure 2. Different sugars affect the expression of RAMP3, TRH and CRH in the PVN, VMH and LH. (A-C) Both HFCS and fructose
significantly decreased RAMP3 mRNA expression compared with glucose in the VMH. In the LH RAMP3 expression was only significantly reduced in
the HFCS group when compared to the glucose group (D-F) Both fructose and HFCS reduced TRH mRNA expression when compared with sucrose in
the PVN. No other differences were found in the VMH or LH. (G-I) No significant difference in CRH was found in the PVN, VMH or LH
Figure 3. Effect of fructose or glucose on the expression of CCK, TNF-α and GH. (A-B) Expression of CCK mRNA in the PVN was inversely
correlated with fructose intake but had no significant correlation with glucose intake. (C-D) TNF-α expression in the PVN was not significantly
correlated with fructose or glucose intake. (E-F) GH mRNA expression in the VMH was significantly correlated with either fructose or glucose intake
74
Journal of Food and Nutrition Research
Free access to glucose, fructose, sucrose or HFCS can
lead to excessive weight gain and/or obesity in the
Sprague Dawley rats [1,2,3]. We found evidence that brief
exposure to different sugar solutions can change the
mRNA expression of CCK and TNF-α in the PVN as well
as GH in the VMH. This initial responses to sugar
solutions are not the result from excess energy intake, as
total caloric intake did not significantly differ among all
five groups (Table 2). We also examined NPY and AgRP
and failed to detect any significant differences (data not
shown), which was consistent with our recent report [12].
CCK is well known as an effective hunger suppressant
[17]. Brain CCK receptor deficiency results in hyperphagia
and decreased responsiveness to high fat diet in rats [1820]. Dorsal medial hypothalamic CCK inhibits food intake
for at least 22 h [21,22]. CCK microinfused in the PVN
inhibits gastric emptying and stimulates colonic transit in
a dose dependent way [23]. It has been reported that CCK
synthesis in the hypothalamus is disrupted during diabetes
development [24]. CCK release from PVN in response to
a gavaged meal is also compromised in obese (fa/fa)
Zucker rats [25]. These observations support the view that
hypothalamic CCK plays an important role in energy
control. We recently reported that 24 hour access to glucose
solutions upregulated CCK expression whereas access to
fructose resulted in significant downregulation of CCK
[12]. In the current study, we replicated our finding that
fructose access down-regulated CCK and can now report
that this suppression takes place mainly in the PVN, not in
the VMH or the LH. It has been previously reported that
hypothalamic CCK is primarily expressed in PVN,
typically in the parvocellular sub-nuclei [24].
TNF-α is an important chemokine involved in systemic
inflammation. High doses of exogenous TNF-α can reduce
food intake with weight loss being proportional to the
decrease of both food and water intake [26]. It needs to be
noted that the effect of TNF-α on food intake is mild
compared with the effects of either insulin or leptin[27].
On the contrary, hypothalamic pro-inflammatory signaling
can lead to impaired insulin sensitivity [28], increasing the
potential for excess weight gain [29]. In the current study
we found glucose and sucrose increased TNF-α mRNA
expression. This effect is similar to that caused by high fat
diet [30]. By contrast HFCS and fructose had no significant
effect on TNF-α expression. The slight increase of TNF-α
caused by glucose or sucrose was probably insufficient to
have an effect on energy balance in the short term.
Although fructose was reported to increase TNF-α in the
whole hypothalamus [12], that observation was probably a
reflection of the fact that the entire hypothalamus was
sampled.
GH is known to be a peptide that contributes to the
energy expenditure and lipid oxidation [31]. GH is critical
for fat mobilization during fasting or starvation state when
insulin is suppressed [32,33]. Adults with GH deficiency
usually have increased body fat mass and decreased
extracellular fluid volume [34]. We recently reported that
GH expression was upregulated by glucose intake. In the
current study we further found fructose decreased GH
expression in specific hypothalamic areas [12]. Although
the effect of glucose intake on the GH expression failed to
reach statistical significance, the positive correlation between
GH expression and glucose intake is robust (P<0.05).
Because fructose can induce hypertriglyceridemia, our
observation is also consistent with the fact that plasma
triglycerides inhibit GH release [35].
RAMP3 can interact with several protein-coupled
receptors. Adrenomedullin receptors and amylin receptors
are two well-studied complex forms that require RAMP3.
Adrenomedullin is a potent endogenous vasodilatory
peptide. Increased amylin is associated with reduced body
weight gain and adiposity [36]. Unlike CCK, glucose and
fructose failed to affect the expression of RAMP3 in the
PVN. Interestingly, although RAMP3 is mainly expressed
in PVN, HFCS suppressed RAMP3 in both the VMH and
the LH when compared to the glucose group, but not with
the water-fed control group.
Finally, TRH is mainly located in the PVN and its
secretion is connected with pituitary hormone release.
TRH has an anorexigenic effect both by central or
peripheral administration [37]. In contrast to the results
from the whole hypothalamus reported earlier [12],
fructose failed to significantly decrease TRH in the PVN,
the VMH or the LH. It has been pointed out elsewhere [38]
that TRH expression is highly specific to the PVN. We
failed to replicate the previously reported finding (that
fructose promoted decreases in TRH message and that
HFCS intake downregulated CRH message). It is likely
because that earlier work from our laboratory used tissues
from a much larger region of the hypothalamus, whereas
the sampling performed in this paper was confined to
discreet hypothalamic nuclei or regions.
When we examined food intake and energy intake, we
found that standard chow consumption was reduced but
total energy intake remained unchanged. Although the
reduction of CCK and GH or increase of TNF-α failed to
affect energy intake immediately, the change in expression
of these neuropeptides could possibly contribute to the
obesity induced by long term use of sugars.
We have compared the effects of HFCS to the effects of
other sugars including glucose, sucrose and fructose.
Sucrose and HFCS have differing effects on several
neuropeptides including TNF-α, GH, RAMP3 and TRH.
The consumption of sugars that contain more fructose than
glucose (such as HFSC) can cause malabsorption[39]. As
a result HFCS (55% fructose, 41% glucose) has the
potential to result in greater malabsorption than does
sucrose, since sucrose is composed of 50% glucose and
50% fructose. Additionally, some sugars may also have
unique effects on the gut microbiota. All these factors may
lead to their distinct role in energy metabolism.
5. Conclusions
People who regularly consume sugar sweetened drinks
usually have lower dietary quality as well as increased
risks of metabolic syndrome [40]. For economic reasons,
HFCS has replaced a great deal of the sucrose in our diets.
We found a close link between the expression of the
neuropeptide CCK and GH and fructose intake. No
differences in CCK or GH between HFCS and sucrose
groups were observed. We have presented evidence here
that makes it clear that different sugars can and do have
different effects on different targets, even within the
hypothalamus. Our study clearly indicates that brief sugar
intake from solution can change hypothalamic neuropeptides.
This is a preliminary but requisite test to investigate the
Journal of Food and Nutrition Research
mechanism of sugar induced obesity. The mRNA
measurement in the current study cannot predict protein
levels but reflects on the expression changes of the
neuropeptides which are critical for control of energy
homeostasis. Further study is needed to confirm whether
the change of these neuropeptides is sufficient for obesity
induced by the long term use of sugars.
Acknowledgments
C. Z. is supported by the China Scholarship Council.
This work was supported in part by a grant from the
Maryland Agricultural Experiment Station to TWC.
[15] Ventura EE, Davis JN, Goran MI. Sugar content of popular
[16]
[17]
[18]
[19]
[20]
Conflict of Interest
The authors declare no competing financial interests.
References
[1]
[2]
[3]
[4]
[5]
[6]
[7]
[8]
[9]
[10]
[11]
[12]
[13]
[14]
Castonguay TW, Hirsch E, Collier G. Palatability of sugar
solutions and dietary selection? Physiology & Behavior 1981; 27:
7-12.
Kanarek RB, Orthen-Gambill N. Differential effects of sucrose,
fructose and glucose on carbohydrate-induced obesity in rats. The
Journal of nutrition 1982; 112: 1546-54.
Bocarsly ME, Powell ES, Avena NM, Hoebel BG. High-fructose
corn syrup causes characteristics of obesity in rats: Increased body
weight, body fat and triglyceride levels. Pharmacology
Biochemistry and Behavior 2010; 97: 101-6.
Schwartz MW, Woods SC, Porte D, Seeley RJ, Baskin DG.
Central nervous system control of food intake. Nature 2000; 404:
661-71.
Campbell ES, Castonguay TW. Fructose intake and circulating
triglycerides: an examination of the roles of APOC 3 and FOXO1.
The FASEB Journal 2013; 27: 1074.8.
London E, Castonguay TW. High Fructose Diets Increase 11β‐
Hydroxysteroid Dehydrogenase Type 1 in Liver and Visceral
Adipose in Rats Within 24‐h Exposure. Obesity 2011; 19: 92532.
Masuzaki H, Flier J. Tissue-specific glucocorticoid reactivating
enzyme, 11 beta-hydroxysteroid dehydrogenase type 1 (11 betaHSD1)--a promising drug target for the treatment of metabolic
syndrome. Current drug targets. Immune, endocrine and metabolic
disorders 2003; 3: 255-62.
Masuzaki H, Paterson J, Shinyama H, Morton NM, Mullins JJ,
Seckl JR, Flier JS. A transgenic model of visceral obesity and the
metabolic syndrome. Science 2001; 294: 2166-70.
Page KA, Chan O, Arora J, Belfort-DeAguiar R, Dzuira J,
Roehmholdt B, Cline GW, Naik S, Sinha R, Constable RT. Effects
of Fructose vs Glucose on Regional Cerebral Blood Flow in Brain
Regions Involved With Appetite and Reward PathwaysFructose
Consumption and Weight Gain. JAMA 2013; 309: 63-70.
Stellar E. The physiology of motivation. Psychological review
1954; 61: 5.
Weingarten HP, Chang P, McDonald T. Comparison of the
metabolic and behavioral disturbances following paraventricularand ventromedial-hypothalamic lesions. Brain research bulletin
1985; 14: 551-9.
Colley DL, Castonguay TW. Effects of sugar solutions on
hypothalamic appetite regulation (in press). Physiology &
Behavior 2014.
Clément-Ziza M, Munnich A, Lyonnet S, Jaubert F, Besmond C.
Stabilization of RNA during laser capture microdissection by
performing experiments under argon atmosphere or using ethanol
as a solvent in staining solutions. Rna 2008;14:2698-704.
Lindqvist A, Baelemans A, Erlanson-Albertsson C. Effects of
sucrose, glucose and fructose on peripheral and central appetite
signals. Regulatory Peptides 2008; 150: 26-32.
75
[21]
[22]
[23]
[24]
[25]
[26]
[27]
[28]
[29]
[30]
[31]
[32]
[33]
[34]
sweetened beverages based on objective laboratory analysis: focus
on fructose content. Obesity 2011; 19: 868-74.
Walker RW, Dumke KA, Goran MI. Fructose content in popular
beverages made with and without high-fructose corn syrup.
Nutrition 2014; 30: 928-35.
Kraly FS, Carty WJ, Resnick S, Smith GP. Effect of
cholecystokinin on meal size and intermeal interval in the shamfeeding rat. Journal of comparative and physiological psychology
1978; 92: 697.
Schwartz GJ, Whitney A, Skoglund C, Castonguay TW, Moran
TH. Decreased responsiveness to dietary fat in Otsuka LongEvans Tokushima fatty rats lacking CCK-A receptors. American
Journal of Physiology-Regulatory, Integrative and Comparative
Physiology 1999; 277: R1144-R51.
Chen H, Kent S, Morris MJ. Is the CCK2 receptor essential for
normal regulation of body weight and adiposity? European Journal
of Neuroscience 2006; 24: 1427-33.
Weiland TJ, Voudouris NJ, Kent S. The role of CCK2 receptors in
energy homeostasis: insights from the CCK2 receptor-deficient
mouse. Physiology & Behavior 2004; 82: 471-6.
Chen J, Scott KA, Zhao Z, Moran TH, Bi S. Characterization of
the feeding inhibition and neural activation produced by
dorsomedial hypothalamic cholecystokinin administration.
Neuroscience 2008; 152: 178-88.
Zhu G, Yan J, Smith WW, Moran TH, Bi S. Roles of dorsomedial
hypothalamic cholecystokinin signaling in the controls of meal
patterns and glucose homeostasis. Physiology & Behavior 2012;
105: 234-41.
Tebbe J, Mönnikes H, Pluntke K, Bauer C, Arnold R.
Cholecystokinin (CCK) microinfused into the paraventricular
nucleus of the hypothalamus (PVN) inhibits gastric emptying and
stimulates colonic motor activity in the conscious rat.
Gastroenterology 1998; 114: A1184-A5.
Abramov A, Kolesnik YM, Trzhetsinskii S, Orlovskii nM.
Changes in the cholecystokinin-synthesizing system of the
hypothalamus in experimental diabetes mellitus in rats.
Neuroscience and behavioral physiology 1999; 29: 621-4.
De Fanti BA, Backus RC, Hamilton JS, Gietzen DW, Horwitz BA.
Lean (Fa/Fa) but not obese (fa/fa) Zucker rats release
cholecystokinin at PVN after a gavaged meal. American Journal
of Physiology-Endocrinology and Metabolism 1998; 275: E1-E5.
Mahony S, Tisdale M. Induction of weight loss and metabolic
alterations by human recombinant tumour necrosis factor. British
journal of cancer 1988; 58: 345.
Romanatto T, Cesquini M, Amaral ME, Roman ÉA, Moraes JC,
Torsoni MA, Cruz-Neto AP, Velloso LA. TNF-α acts in the
hypothalamus inhibiting food intake and increasing the respiratory
quotient—effects on leptin and insulin signaling pathways.
Peptides 2007; 28: 1050-8.
De Souza CT, Araujo EP, Bordin S, Ashimine R, Zollner RL,
Boschero AC, Saad MJ, Velloso LcA. Consumption of a fat-rich
diet activates a proinflammatory response and induces insulin
resistance in the hypothalamus. Endocrinology 2005; 146: 4192-9.
Swaroop JJ, Rajarajeswari D, Naidu J. Association of TNF-α with
insulin resistance in type 2 diabetes mellitus. The Indian journal of
medical research 2012;135:127.
Wang X, Ge A, Cheng M, Guo F, Zhao M, Zhou X, Liu L, Yang
N. Increased hypothalamic inflammation associated with the
susceptibility to obesity in rats exposed to high-fat diet.
Experimental diabetes research 2012; 2012.
Jørgensen JOL, Pedersen SB, Børglum J, Møller N, Schmitz O,
Christiansen JS, Richelsen B. Fuel metabolism, energy
expenditure, and thyroid function in growth hormone-treated
obese women: A double-blind placebo-controlled study.
Metabolism 1994; 43: 872-7.
Sakharova AA, Horowitz JF, Surya S, Goldenberg N, Harber MP,
Symons K, Barkan A. Role of growth hormone in regulating
lipolysis, proteolysis, and hepatic glucose production during
fasting. The Journal of Clinical Endocrinology & Metabolism
2008; 93: 2755-9.
Gahete MD, Córdoba-Chacón J, Luque RM, Kineman RD. The
rise in growth hormone during starvation does not serve to
maintain glucose levels or lean mass but is required for
appropriate adipose tissue response in female mice. Endocrinology
2012; 154: 263-9.
Rosen T, Bosaeus I, TöIli J, Lindstedt G, Bengtsson B-Å.
Increased body fat mass and decreased extracellular fluid volume
76
Journal of Food and Nutrition Research
in adults with growth hormone deficiency. Clinical Endocrinology
1993; 38: 63-71.
[35] Coxam V, Davicco M-J, Barlet J-P. Effect of triglycerides on
growth hormone (GH)-releasing factor-mediated GH secretion in
newborn calves. Domestic animal endocrinology 1989; 6: 389-93.
[36] Lutz TA. Control of energy homeostasis by amylin. Cellular and
molecular life sciences 2012; 69: 1947-65.
[37] Schuhler S, Warner A, Finney N, Bennett G, Ebling F, Brameld J.
Thyrotrophin-Releasing Hormone Decreases Feeding and
Increases Body Temperature, Activity and Oxygen Consumption
in Siberian Hamsters. Journal of neuroendocrinology 2007; 19:
239-49.
[38] Fekete C, Légrádi G, Mihály E, Huang Q-H, Tatro JB, Rand WM,
Emerson CH, Lechan RM. α-Melanocyte-stimulating hormone is
contained in nerve terminals innervating thyrotropin-releasing
hormone-synthesizing neurons in the hypothalamic paraventricular
nucleus and prevents fasting-induced suppression of
prothyrotropin-releasing hormone gene expression. The Journal of
Neuroscience 2000; 20: 1550-8.
[39] Rumessen JJ. Fructose and related food carbohydrates: sources,
intake, absorption, and clinical implications. Scandinavian journal
of gastroenterology 1992; 27: 819-28.
[40] Bray G, Popkin B. Calorie‐sweetened beverages and fructose:
what have we learned 10 years later. Pediatric obesity 2013; 8:
242-8.

© Copyright 2026