
Download Supporting Information (PDF)
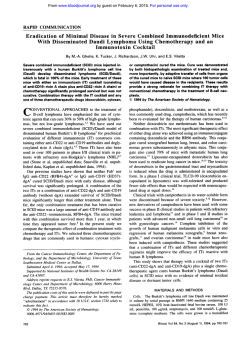
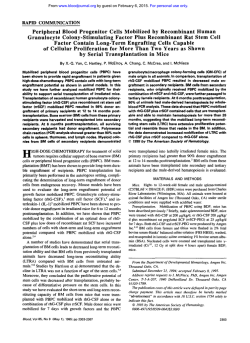
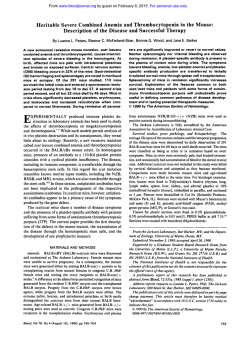
Supporting Information
Catalán et al. 10.1073/pnas.1415739112
SI Materials and Methods
ACID-mT/mG Mouse Imaging. Fresh 150-μM-thick SMG slices were
obtained using a Leica VT1000 S vibrating blade microtome and
placed on the stage of an Olympus IX81 inverted multiphoton
microscope equipped with an Olympus Fluoview FV 1000
scanning head, a Mai Tai DeepSee laser (Spectra-Physics), a 20×
objective (NA 0.75), and an Olympus FV10-MRG/R filter.
Emissions of intrinsic fluorescence of membrane-bound versions
of tomato (mT) and green fluorescent (mG) proteins were scanned
simultaneously using an excitation wavelength of 1,000 nm, and
the emissions were separated and collected on internal photomultiplier detectors using an Olympus dichroic mirror (FV10MRG/R:DM570) and emission filters (FV10-MRG/R:BA495540HQ and BA575-630).
Immunohistochemistry. Mice were euthanized by CO2 asphyxiation
followed by cervical dislocation. SMGs were then removed and
minced (0.5-mm-diameter fragments) and fixed in Bouin’s fixative at room temperature for 48 h before being embedded in
paraffin. Then 5-μm-thick sections were dewaxed and hydrated
before immunostaining. Pseudoperoxidase activity was eliminated
by treatment with 10% (vol/vol) hydrogen peroxide. Before immunostaining, all tissues were microwaved with 50 mM Tris·HCl
pH 10.0 for 8 min at 95 °C. Sections were then incubated overnight
with an anti-peptide antibody against Tmem16A (Abcam), Aqp5
(EMD Millipore), or Nkcc1 (Santa Cruz Biotechnology). Bound
immunoglobulins were detected with the Vectastain Elite ABC
kit (Vector Laboratories), and peroxidase was visualized by incubation with 3,3′-diaminobenzidine (Vector Laboratories) for
5 min. Finally, the sections were dehydrated in ethanol, cleared
with xylene, and mounted using Permount (Fisher Scientific).
Electrophysiology. Single acinar cells from SMGs were obtained by
combined trypsin and collagenase digestion. In brief, mice were
euthanized by CO2 asphyxiation followed by cervical dislocation.
SMGs were surgically removed and finely minced with scissors,
and then digested for 15 min with 0.01% trypsin-EDTA (Invitrogen) in Basal Medium Eagle (BME) medium (Invitrogen)
supplemented with 1% BSA (type V). Cells were dissociated with
two consecutive incubation steps of 25 min each with 0.5 mg/mL
collagenase 2 (type 2; Worthington Biochemical) in BME with
1% BSA. All solutions were gassed continuously with 95% O2/5%
CO2 and maintained at 37 °C.
Whole-cell patch clamp recordings were acquired at room
temperature using an Axopatch 200B amplifier (Molecular
Devices). Voltage pulses were generated with Clampex 10 software
(Molecular Devices) through a Digidata 1440 interface (Molecular
Devices), which also served to acquire the currents. Glass pipettes
(Warner Instruments) were pulled using a P97 puller (Sutter Instruments) to give a resistance of 2–3 MΩ using an internal pipette
solution containing 58 mM NaCl, 60 mM Na gluconate, 0.63 mM
CaCl2, 1 mM EGTA, and 10 mM Hepes, pH 7.2 (pH adjusted with
NaOH). The calculated Ca 2+ -free concentration was 285 nM
(Winmaxc32; maxchelator.stanford.edu). The external solution
contained 150 mM NMDG-Cl, 1 mM CaCl2, 1 mM MgCl2, 10 mM
Hepes, and 20 mM sucrose, pH 7.4 (pH adjusted with NMDG).
Nystatin-perforated whole-cell recordings were performed on
isolated acinar cells as described above. In brief, the glass microelectrode was backfilled with internal pipette solution containing 300 μg nystatin/mL of solution, and the tip of the
microelectrode was filled with nystatin-free pipette solution. Cell
perforation with the ionophore was monitored by the changes in
Catalán et al. www.pnas.org/cgi/content/short/1415739112
capacitance and the current at −60 mV. After gigaseal generation,
it took ∼10 min to reach maximal permeabilization. Experiments
displaying an access resistance of <20 MΩ were considered for
further analysis. The internal pipette solution contained 58 mM
NMDG-Cl, 60 mM NMDG-glutamate, 4.5 mM EGTA, and
10 mM Hepes, pH 7.2 (pH adjusted with NMDG). The hypotonic
external solution contained 90 mM NaCl, 25 mM NaHCO3,
4.3 mM KCl, 1 mM CaCl2, 1 mM MgCl2, 5 mM glucose, and
10 mM Hepes, pH 7.4. (The desired pH value was achieved by
gassing the solution with a mix of 95% O2/5% CO2.) An isotonic
solution was prepared from the hypotonic solution by adding
mannitol until an osmolality of 315 mOsm/kg was reached.
Western Blot Analysis. Fresh SMG tissue slices (150 μm thick) from
control and Tmem16A−/− mice were obtained as described above.
A plasma membrane-enriched fraction was obtained using
a commercial protein isolation kit (Subcellular Protein Fractionation Kit for Tissue; Thermo Scientific) according to the manufacturer’s instructions. Then 10 μg of plasma membraneenriched fractions from control and Tmem16A−/− glands were
diluted in DTT-supplemented LDS sample buffer (Invitrogen) and
then incubated for 10 min at 50 °C. Then samples were separated
by SDS/PAGE using 4–12% (wt/vol) Bis-Tris plus gels (Invitrogen)
and further transferred into PVDF membranes (Invitrogen) using
the iBLOT2 system (Invitrogen). Membranes were blocked for 1 h
at room temperature using Tween 20 and Tris-buffered saline
(TTBS) supplemented with 5% (wt/vol) nonfat dry milk, and then
incubated for 1 h at room temperature with primary antibodies
against Aqp5 (EMD Millipore) and Nkcc1 (1), followed by three
5-min washes with TTBS. Membranes were then incubated with
peroxidase-conjugated IgG fraction monoclonal mouse antirabbit IgG (Jackson ImmunoResearch), and antibody-bound proteins were visualized using an enhanced chemiluminiscence kit
(SuperSignal West Femto Chemiluminescent Substrate; Thermo
Scientific) and digitally acquired using the ChemiDoc XRS+ System (Bio-Rad). Protein band intensity analyses were performed
using ImageJ software (imagej.nih.gov/ij).
In Vivo Saliva Secretion. Mice were anesthetized by i.p. chloral
hydrate injection (400 mg/kg) and maintained at 37 °C using
a temperature-regulated blanket (Harvard Apparatus). Before
saliva collection, a tracheal tube was placed to prevent asphyxiation due to blockage of the windpipe from excessive mucus
production during stimulation. Secretion was initiated by injection of the cholinergic agonist pilocarpine HCl (10 mg/kg i.p.).
Salivary gland-specific secretions were collected directly from
SMG and parotid gland main ducts that were inserted into
calibrated glass micropipettes (VWR). The rate of fluid production was measured by marking the position of the fluid front
on the micropipette wall every 5 min.
Ex Vivo Perfused SMGs. Mice were anesthetized by chloral hydrate
injection (400 mg/kg i.p.), and all branches of the common carotid
artery were ligated, with the exception of the submandibular
artery. Blood vessels supplying the main duct of the SMG were
also ligated, to avoid contamination of the collected saliva by the
perfusate. The gland was transferred to a perfusion chamber in
which the common carotid was cannulated (31 G) and perfused at
37 °C. Salivation was stimulated by perfusion with secretagogues,
and the progression of saliva within the capillary tube was recorded every minute. For ex vivo experiments, a normal saline solution containing 4.3 mM KCl, 120 mM NaCl, 25 mM NaHCO3,
1 of 5
perimental solution used for cell volume measurements was the
same as described for the ex vivo experiments. Volume changes
are expressed as F0/F that is proportional to changes in cell volume (V/V0). F0 and V0 are fluorescence intensity value and cell
volume at time = 0, respectively.
1 mM CaCl2, 1 mM MgCl2, 5 mM glucose, and 10 mM Hepes
pH 7.4 (gassed with 95% O2/5% CO2) was used as perfusate.
Low Cl−- and HCO3−-free solutions were also used to test the
anion dependence of IPR-mediated secretion. All three solutions contained the same ingredients with the following exceptions: in low-Cl− solution, KCl and NaCl were replaced by
potassium gluconate and sodium gluconate, respectively, and in
HCO3− -free solution, NaHCO3 was replaced by sodium gluconate and supplemented with 30 μM ethoxyzolamide, a carbonic anhydrase inhibitor.
Ca2+ Imaging. The fura-2 fluorescence ratiometric method was
used to measure intracellular free calcium levels in isolated cells
as described above. Cells were isolated as described above and
loaded with 2 μM fura-2/AM for 25 min at room temperature.
Imaging was performed using an Olympus IX71 inverted microscope equipped with a Polychrome IV Imaging System coupled to a high-speed digital camera. Images from cells loaded
with fura-2 (Invitrogen) were acquired every 3 s by alternate
excitation of light at 340 nm and 380 nm, and emissions were
captured at 510 nm using Imaging Workbench 6.0 software.
Chamber volume was maintained at ∼200 μL. Cells were perfused with the ex vivo perfusion solution at 37 °C. The fluorescence ratio of 340 nm over 380 nm was calculated, and all data
are presented as the change in ratio units.
Cell Volume Measurements. The fluorescent dye calcein (Invitrogen)
was used to measure changes in acinar cell volume. Cells were
isolated as described above and loaded with 2 μM calcein-AM for
25 min at 37 °C. Imaging was performed using an Olympus IX71
inverted microscope equipped with a Polychrome IV Imaging
System coupled to a high-speed digital camera (TILL Photonics).
Images from calcein-loaded cells were acquired every 5 s by excitation at 490 nm, and emissions were captured at 530 nm using
Imaging Workbench 6.0 software (INDEC BioSystems). The ex1. Kurihara K, Moore-Hoon ML, Saitoh M, Turner RJ (1999) Characterization of a phosphorylation event resulting in upregulation of the salivary Na(+)-K(+)-2Cl(−) cotransporter. Am J Physiol 277(6 Pt 1):C1184–C1193.
A
BspH1
BspH1
0
Genomic
Locus
1609
4740
8250
9713
12
11
10
5717
A
B
BspH1
Targeting
Vector
12
11
3.1 kb
1.7 kb
neo
2.5 kb
Southern blot:
Probe A (BspH1)
Probe B (BspH1)
: Exon, coding
Untargeted
9.7 kb
9.7 kb
: FRT site
Targeted
4.8 kb
6.5 kb
: Southern probe
: LoxP site
B
Probe A
Probe B
kb
9.7 kb
10
9.7 kb
8
6
6.5 kb
5
4.8 kb
4
Fig. S1. Generation of a Tmem16A conditional knockout mouse. (A) The conditional Tmem16A knockout mouse was generated by flanking exon 12 by loxP
sites. The first loxP site was inserted 440 bp 5′ to exon 12, and the second loxP site and FRP-neo cassette were inserted 376 bp 3′ to exon 12. (B) Southern blot
analysis was performed on antibiotic-selected stem cells using the following probes: probe A (external to the left targeting arm), GGTCTGAGAGGATTTGCAGGACAGCCTGAGAGGCCAATAGGTTGGGCAGCCAGTTGGGCTTTGAGTTCTGTGGGGGCTTATGGATGAGGATGTGAATGGTGACAGTTCATGTCAGCTAGGGAGGACTAACAGACTCTATGGGGGTGGGAGGGTTTGCCTGATGTCTCTGACCAAGTTTCATTTGTTGCTTACACTGAATGGGGCTTGCGATGGAACCTACAACCATGGCGACA,
and probe B (external to the right targeting arm), AGCCCTAAAGGTTCTTGAAGGGTCCTCACCGAAGTGCCACCCACATGGCCTAGCCTTGAGGGTGGGAAGTGTTCACCAACAGTGAATGAAGTCTGTCACAGGTAGTGGGTAACACCTCCTTTGTCGTGGACTCACCCATGTGTACAGAGTCATCCATCTTGCCTTTGCAGAGACCTGTCGTCCCTACTCTGTATCCTGTTCCAAAGAAGGTGGCACCTG. After germline transmission was obtained, the mouse was bred with a transgenic mouse expressing Flp
recombinase to remove the neo cassette while leaving the loxP sites intact.
Catalán et al. www.pnas.org/cgi/content/short/1415739112
2 of 5
Fig. S2. CaCC-mediated Cl− currents in mouse SMG acinar cells. (A) (Upper) Representative whole-cell recording on isolated SMG acinar cells showing Cl−
conductance before (black line) and after treatment with 10 μM ionomycin (red line). (Lower) The voltage protocol used. (B) Summary of seven experiments as
shown in A. The greater increase in the Cl− currents at −74 mV compared with that at 66 mV suggests that the rise in intracellular Ca2+ concentration modifies the
gating mechanism of the Cl− conductance displayed by SMG acinar cells. Currents are normalized by cell capacitance (pA/pF). Data are presented as mean ± SEM.
Fig. S3. Ca2+ mobilization on muscarinic stimulation in SMG acinar cells. (A and B) Intracellular Ca2+ rise in response to 0.3 μM CCh in control (A) and
Tmem16A−/− (B) SMG acinar cells. Fura-2–loaded acinar cells were excited at 340 and 380 nm, and emission was captured at 510 nm. (C) Summary of experiments as shown in A and B. Shown are the maximal Ca2+ responses exhibited by control (n = 6 experiments) and Tmem16A−/− (n = 4 experiments) SMG
acinar cells. Data are presented as mean ± SEM. The P value was obtained by the Student’s t test.
Catalán et al. www.pnas.org/cgi/content/short/1415739112
3 of 5
A
Control
Tmem16A-/-
Aqp5-/-
Control
Tmem16A-/-
Nkcc1-/-
Anti Aqp5
B
Anti Nkcc1
D
kDa
38
kDa
198
28
98
14
62
E
Protein levels at
plasma membrane
C
1.5
Control
-/Tmem16A
1.0
**
*
0.5
0.0
Aqp5
Nkcc1
p=0.007 p=0.013
Fig. S4. Aqp5 and Nkcc1 expression in control and Tmem16A−/− SMGs. (A and B) The expression patterns of Aqp5 (A) and Nkcc1 (B), two key players in saliva
secretion, were compared between control and Tmem16A−/− SMGs. The specificity of the antibodies used was tested using SMGs from Aqp5−/− and Nkcc1−/−
mice. (C and D) Western blot analysis for Aqp5 (C) and Nkcc1 (D) plasma membrane levels on control and Tmem16−/− glands. In each lane, 10 μg of proteins
from individual control and knockout glands were loaded. (E) Summary of three independent experiments. Data are expressed as the mean ± SEM of normalized band intensities obtained from densitometric analysis. P values (Student’s t test) are shown at the bottom of the bar graph. Protein samples from
Aqp5−/− (1) and Nkcc1−/− (2) mice were included to evaluate the specificity of the Aqp5 and Nkcc1 antibodies used in the experiments.
1. Krane CM, et al. (2001) Salivary acinar cells from aquaporin 5-deficient mice have decreased membrane water permeability and altered cell volume regulation. J Biol Chem 276(26):
23413–23420.
2. Evans RL, et al. (2000) Severe impairment of salivation in Na+/K+/2Cl− cotransporter (NKCC1)-deficient mice. J Biol Chem 275(35):26720–26726.
Catalán et al. www.pnas.org/cgi/content/short/1415739112
4 of 5
Fig. S5. Ex vivo SMG saliva secretion in response to forskolin. (A) Ex vivo submandibular secretions exhibited by control (gray circles; n = 5 glands) and Tmem16A−/−
(black circles; n = 5 glands) mice in response to 10 μM forskolin. (B) Summary of the data shown in A. The P value was obtained by the Student’s t test.
A
Control
B
IP R
IPR-Control
D
30
20 pA/pF
C
I/C (pA/pF)
250 ms
15
ECl
-80
-40
40
80
120
V (mV)
-15
−
Fig. S6. Cl conductance is activated by IPR in acinar cells. (A and B) A typical nystatin-perforated whole-cell experiment showing the macroscopic currents
exhibited by SMG acinar cells under control (A) and after reaching maximal effect by 5-μM IPR treatment (B) in response to voltage pulses (500-ms duration)
from −60 mV to 100 mV (with 10 s between voltage steps). (C and D) When the macroscopic currents elicited under control conditions were subtracted from
those elicited after IPR treatment (C), an outward-rectifying conductance with a reversal potential close to ECl was observed (D). In A–C, the dashed line
represents the zero current level.
Catalán et al. www.pnas.org/cgi/content/short/1415739112
5 of 5


© Copyright 2026