
HOW OLD ARE SMALL LUNAR CRATERS ? - A DEPTH-TO
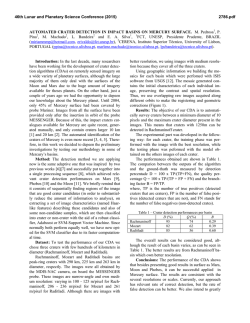
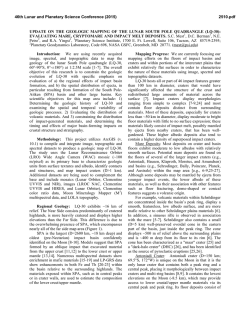
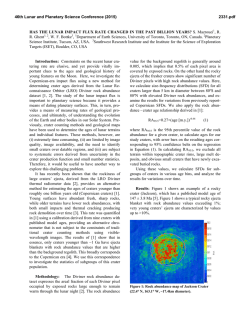
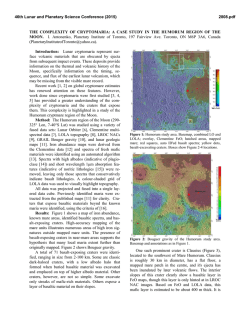
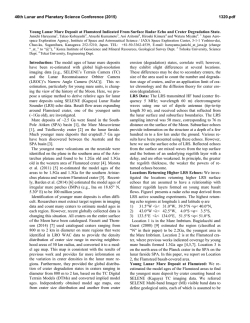
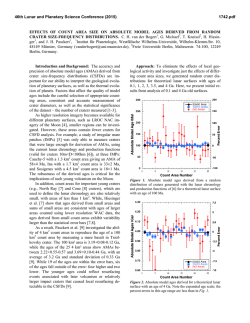
46th Lunar and Planetary Science Conference (2015)
1615.pdf
HOW OLD ARE SMALL LUNAR CRATERS ? - A DEPTH-TO-DIAMETER RATIO BASED ANALYIS
P. Mahanti1 , M.S. Robinson1 , R. Stelling1 1 Lunar Reconnaissance Orbiter Camera, School of Earth and Space
Exploration, Arizona State University, Tempe,AZ,USA; [email protected];
Introduction: In contrast to the larger craters
(D > 10km) and basins which shaped the baseline morphology of the Moon, small lunar craters (SLC) continue to form and modify the local topography of the
Moon. SLCs form on and around larger craters and
basins, are the most populous impact features on the surface but also the least studied - topographic data was
available only for larger craters until recent missions
(e.g. Lunar Reconnaissance Orbiter (LRO), Kaguya),
carrying high resolution cameras (e.g. Lunar Reconnaissance Orbiter Camera (LROC) Narrow Angle Camera (NAC) [1], Selene Terrain Camera [2]). A clear understanding of degradation rates of SLCs can help ascertain the ages of the youngest craters of the Moon.
Analysis of depth (d; rim-to-floor) to diameter (D;
rim-to-rim) ratio for lunar craters is a well-established
method for quantifying the morphological state (and
thus relative age) of a crater. Following the event of
crater formation, redistribution of mass both inside and
outside the crater rim by various methods continuously
d
ratio was
modifies the crater depth and diameter. The D
used to broadly classify craters (simple and complex)
[3, 4, 5] and also to study the evolution of craters [6].
In this work, we discuss and model the time-dependant
of degradation state of SLCs by analyzing the populad
tion density vs D
for selected locations on the Moon.
Further, we discuss the relationship of angle of repose
(θ)(angle at which granular material begins to move und
der the influence of gravity)and D
for SLCs.
A recent study [7] (20m < D < 200m) shows that
d
crater population decrease asymptotically with D
ratio
d
and the probability distribution function (PDF) of D
is
a skewed bell-shaped curve (Figure 1). First, since the
PDF is bell-shaped, the shape of the cumulative distribution function (CDF) is sigmoidal and can be modeled
d
using a known function from observed D
values with
no assumptions. Second, if the representative crater
dataset contains almost all craters within a given range
(an exhaustive dataset), then the CDF can lead to an understanding of the degradation rate for SLCs. Smaller
craters (D < 200m) form a steady state population such
that the craters disappear at the same rate as others are
formed [8, 9, 10]. By assuming this equilibrium, the
change in the cumulative population of craters can be
re-written as [11]
−
∂
d
D
∂t
= −R
∂N
∂
d
D
−1
(1)
d
Here N is a function of D
and is the number of craters
d
with D greater than a given d/D value in the consid-
Figure 1: Number of SLCs (PDF) at different Dd expressed
as percentage of total population. Note the skewed bell-shape
d
bins are equally spaced (binsize
nature of the distribution. D
= 0.03)
ered crater population. R is the crater production rate
obtained from previous work (Neukum 2001, Hartmann
1999, Marchi 2009). The value of R can be obtained
from previous work on crater production rate and was
found to vary between 10−10 to 10−8 (cumulative number; per square km per year) [12]. Hence, an appropriate
model for ∂∂Nd directly helps in the computation of the
(D)
d
degradation rate (for a particular D
and D), which takes
us a step further in ascertaining the freshness of the observed SLC.
Methods: Craters are identified manually from
NAC ortho-photo image, the digital elevation model
and a derived slope map. Details for obtaining measurements are same as in [7]. While a dataset obtained
globally was used for comparison, the three regions
considered in this work are Apollo 11, Apollo 16 and
Apollo 17. Data acquired from these regions (obtaining measurements for all craters with D < 200m)
represent a dynamic equilibrium of crater formation
and crater degradation procedures. The PDF and
d
CDF were computed from observed D
values. The
classes A,AB,B,BC and C have the same description
for bowl-shaped craters as found in earlier work [6].
Class A represents the freshest, steep sloped (> 35◦ )
craters, class B are moderately steep sloping craters
(15◦ to 25◦ ) and class C are craters with shallow slopes
(< 10◦ ). The other two classes are intermediate.
There is a difference in the definition of N (number
d
d
of craters with D
greater than a given D
value) and
d
the CDF (number of craters with D less than a given
46th Lunar and Planetary Science Conference (2015)
Figure 2: Cumulative number of SLCs (CDF) at different
d
expressed as percentage of total population.
D
equally spaced (binsize = 0.03).
d
D
bins are
d
D
value). However, under the assumptions of an exhaustive dataset and expressing N as a fraction, the definition can be inverted via probability to express N in
terms of the PDF (Figure 1). The PDF and CDF (Figure
2) can be obtained directly from observations by bind
ning a range of D
values (a bin size of 0.03 was chosen
for this work).Further, a logistic distribution model was
chosen to represent the PDF from which the parameters
for CDF can be obtained. The expression for logistic
d
CDF (F(x); x is D
) is
F (x; µ, s) =
1
1 + e−
x−µ
s
(2)
The parameters µ and s represent the shape of the CDF.
Results and Discussion: The percentage of Class
A SLCs is < 10% (Figure 2) but significantly higher
than 1% as indicated in earlier work [6] due to observed
d
D (across multiple regions from which SLCs were idend
tified) higher than 0.33. Higher D
values were also
d
noted in another recent work [13]. SLCs with D
values
more than 0.33 also appear to have higher wall-slope
stability from the angle-of-repose point-of-view. For
SLCs the topographic profile is parabolic and the theoretical maximum slope occurs just below the rim. Then,
d
and the maximum slope are reit can be shown that D
d
tan θ
lated as D ≤ 4 . For stability of the crater shape, θ
should be less than or equal to the angle of repose, assuming a gravity regime. For the Moon, θ lies between
32◦ to 36◦ [14] for both highland and mare targets derived for larger diameter (20 km) craters. If the same
d
range is valid for SLCs, then D
varies between 0.14 to
0.18 for a stable crater morphology after the crater ford
mation event. As degradation occurs the D
value (as
well as the average wall slope) decreases. However, the
d
CDF obtained for D
for the Apollo 11, 16, 17 show
1615.pdf
d
number of D
above 0.18 suggesting that higher slopes
(> 45) are maintained for a small percentage of SLCs.
d
value of 0.18 was selected in a recent work [11]
AD
d
> 0.18 is due to material propWe interpret that D
erties where the cohesive strength of regolith and (or)
layering of regolith and bedrock maintain a wall slope
greater than the angle of repose (gravity regime). Slopes
greater than angle of repose is possible for more coherent non-granular material. The average time spent at
any degradation phase is proportional to the observed
population density (Figure 1) if a dynamic equilibrium
is assumed in the SLC formation-degradation process.
d
> 0.18 condition is short lived and soon
Thus, the D
d
d
which is (a) same
the D value reaches a value D
θ
(within a small standard deviation) for a given diameter range of craters and (b) correlates to angle of repose.
d
For example, a SLC may initially possess a D
value of
d
0.3, but the D ratio is reduced to the 0.14 to 0.18 range
in a short period of time. Following this initial degrad
dation, the D
decreases at a slower pace (inferred from
Figures 1 and 2), over a long period of time,till the SLC
is obliterated.
The CDF of SLCs was modeled using a logistic distribution function (model fitting R-squared value = 1). The
values of µ for highland and mare SLCs were found to
be different with mare values at 0.12 and highland values at 0.14. SLCs from Apollo 16 show µ values same
as that for the highlands. The values of s is approximately 0.04 for both mare and highland SLCs suggesting similarity in the degradation process. From equation
1, if R is invariant, then the degradation rate for mare
craters is lower compared to highland craters - possibly influenced by the relative depths at which bedrock
is present in mare and highlands.
References: [1] M. Robinson, et al. (2010) Space
science reviews 150(1):81. [2] J. Haruyama, et al. (2006)
Advances in Geosciences, Planetary Science 3:101. [3] R.
Pike (1977) in Impact and Explosion Cratering: Planetary
and Terrestrial Implications vol. 1 489–509. [4] R. Baldwin
(1965) New York, McGraw-Hill [1965] 1. [5] C. Elachi, et al.
(1976) Earth, Moon, and Planets 15(1):119.
[6] A.
Basilevskii (1976) in Lunar and Planetary Science
Conference Proceedings vol. 7 1005–1020. [7] P. Mahanti,
et al. (2014) in Lunar and Planetary Institute Science
Conference Abstracts vol. 45 1584. [8] L. A. Soderblom
(1970) Journal of Geophysical Research 75(14):2655.
[9] E. M. Shoemaker (1965) in The Nature of the Lunar
Surface vol. 1 23. [10] H. Moore (1964) 1964 34–51. [11] A.
Basilevsky, et al. (2014) Planetary and Space Science 92:77.
[12] M. Le Feuvre, et al. (2011) Icarus 214(1):1. [13] I. J.
Daubar, et al. (2014) Journal of Geophysical Research:
Planets. [14] R. Wagner, et al. (2013) in Lunar and Planetary
Institute Science Conference Abstracts vol. 44 2924.
© Copyright 2026