
Has the Lunar Impact Flux Rate Changed in the Past Billion Years?
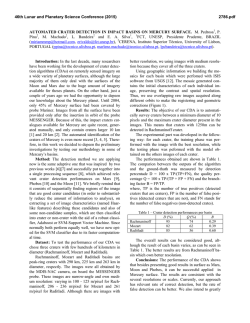
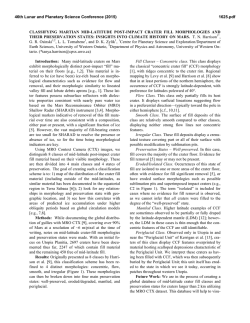
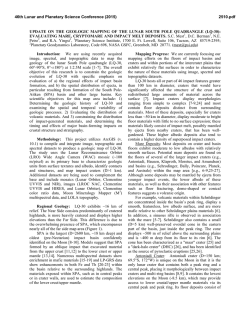
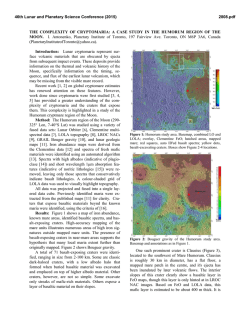
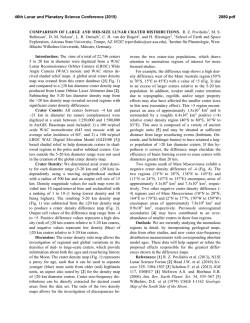
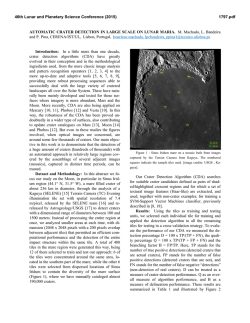
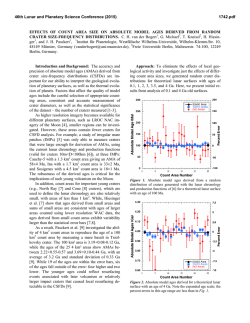
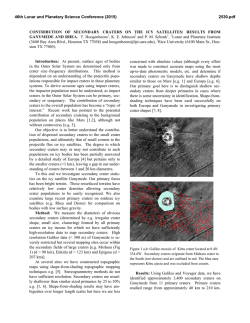
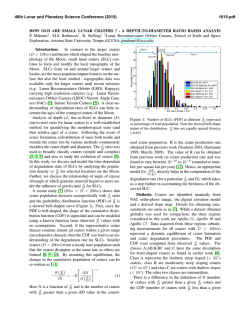
46th Lunar and Planetary Science Conference (2015)
2331.pdf
HAS THE LUNAR IMPACT FLUX RATE CHANGED IN THE PAST BILLION YEARS? S. Mazrouei1, R.
R. Ghent1, 2, W. F. Bottke3, 1Department of Earth Sciences, University of Toronto, Toronto, ON, Canada. 2Planetary
Science Institute, Tucson, AZ, USA. 3Southwest Research Institute and the Institute for the Science of Exploration
Targets (ISET), Boulder, CO, USA
Introduction: Constraints on the recent lunar cratering rate are elusive, and yet provide vitally important clues to the ages and geological history of
young features on the Moon. Here, we investigate the
Copernican-era impact flux using a new method for
determining crater ages derived from the Lunar Reconnaissance Orbiter (LRO) Diviner rock abundance
dataset [1, 2]. The study of the lunar impact flux is
important to planetary science because it provides a
means of dating planetary surfaces. This, in turn, provides a means of measuring rates of geological processes, and ultimately, of understanding the evolution
of the Earth and other bodies in our Solar System. Previously, crater counting methods and geological maps
have been used to determine the ages of lunar terrains
and individual features. Those methods, however, are
(i) extremely time consuming, (ii) are limited by image
quality, image availability, and the need to identify
small craters over datable regions, and (iii) are subject
to systematic errors derived from uncertainty in the
crater production function and small number statistics.
Therefore, it would be useful to have another way to
explore this challenging problem.
It has recently been shown that the rockiness of
large craters’ ejecta, derived from the LRO Diviner
thermal radiometer data [2], provides an alternative
method for estimating the ages of craters younger than
roughly one billion years old (Copernican craters) [1].
Young surfaces have abundant fresh, sharp rocks,
while older terrains have lower rock abundances, with
both small impacts and thermal cracking producing
rock demolition over time [3]. This rate was quantified
in [1] using a calibration derived from nine craters with
published model ages, providing an alternative chronometer that is not subject to the constraints of traditional crater counting methods using visiblewavelength images. The results of [1] show that in
essence, only craters younger than ~1 Ga have ejecta
blankets with rock abundance values that are higher
than the background regolith. This broadly corresponds
to the Copernican era [4]. We use this correspondence
to investigate the statistics of subgroups of this crater
population.
Methodology: The Diviner rock abundance dataset expresses the areal fraction of each Diviner pixel
occupied by exposed rocks large enough to remain
warm through the lunar night [2]. The rock abundance
value for the background regolith is generally around
0.005, which implies that 0.5% of each pixel area is
covered by exposed rocks. On the other hand the rocky
ejecta of the fresher craters show significant number of
Diviner pixels with high rock abundance values. Here,
we calculate size-frequency distributions (SFD) for all
craters larger than 5 km in diameter between 80ºS and
80ºN with elevated Diviner rock abundances, and examine the results for variations from previously reported Copernican SFDs. We also apply the rock abundance - crater age relationship derived in [1]:
RA95/5=0.27×(age [m.y.])-0.46
(1)
where RA95/5 is the 95th percentile value of the rock
abundance for a given crater, to calculate ages for our
study craters, with error bars on the resulting ages corresponding to 95% confidence belts on the regression
in Equation (1). In calculating RA95/5, we exclude all
terrain within topographic crater rims, large melt deposits, and obvious small craters that have newly excavated buried rocks.
Using these values, we calculate SFDs for subgroups of craters in various age bins, and analyze the
results for variations over time.
Results: Figure 1 shows an example of a rocky
crater (Jackson), which has a published model age of
147 ± 3.8 Ma [5]. Figure 1 shows a typical rocky ejecta
blanket with rock abundance values exceeding 1%;
very young craters’ ejecta are characterized by values
up to >10%.
Figure 1: Rock abundance map of Jackson Crater
(22.4° N, 163.1° W, ~17.4km diameter).
46th Lunar and Planetary Science Conference (2015)
2331.pdf
Figure 2 shows that for older craters such as Joule
crater, with a published age of 4.0 ± 0.1 Ga [6], rock
abundance values are low and indistinguishable from
the background regolith (values on the order of 0.005).
Figure 2: Rock abundance map of Joule Crater (27.3° N,
144.2° W, ~96km diameter).
We identify 580 craters larger than 5 km in diameter with rocky ejecta. The SFD for the entire population of rocky craters (Fig. 3) is largely consistent with
that calculated previously for the population of Copernican craters [4, 7], identified as such on the basis of
geologic mapping and crater rays. Eight craters larger
than 20 km in diameter on the farside, identified as
Copernican by [7], do not show high rock abundance
in their ejecta. These craters are therefore excluded
from our dataset. An example is Coriolis Y, which was
indicated by [7] as having an uncertain identification
of bright rays. On the contrary, we have defined Joule
T crater as Copernican, which showed uncertain bright
rays for [7]. On the nearside, there are 15 craters previously identified as Copernican by [4] that have been
excluded from our dataset due to lack of blocky ejecta,
such as Rutherford crater.
Figure 3: Size-frequency distribution comparison: Copernican craters shown in red [7], versus identified craters with distinct rock abundance in their ejecta, shown
in blue, and the Neukum 2001 Production Function [8].
Craters identified as younger than 100 my. in this study
are shown in green.
Current Work: As outlined above, we are currently analyzing sub-populations of Copernican craters
with ages calculated using the regression of [1]. We
have already identified deviations from the Neukum
production function [8], though our work is preliminary. In addition to the SFD calculated for our entire
Copernican population, Figure 3 also shows the SFD
for craters with ages calculated as above at <100 my.
The deviation in slope from that of the cumulative
curve for crater diameters <20 km demonstrates a population of small craters in excess of that predicted by
the function of [8]. This work, and other results that
will be shown in our talk, show that the impact flux
has varied substantially over the past 1 Gyr, in contrast
to standard assumptions of a constant impact flux over
the last 3 Gyr.
References: [1] Ghent, R.R., et al. (2014), Geology
42, N10. [2] Bandfield, J.L., et al. (2011), Journal of
Geophysical Research 116: E12. [3] Delbo, M., et al.
(2014), Nature, 508. [4] Wilhelms, D. E., et al. (1978),
Planetary Science Conference 9, 3735-3762. [5] van
der Bogert, C. H., et al. (2010), LPSC XLI, Abstract
#2165. [6] Kirchoff, M.R., et al. (2013), Icarus 225,
325-241. [7] McEwen, A.S., et al. (1997), Journal of
Geophysical Research 102: E4. [8] Ivanov, B.A., et al.
(2002), Asteroids III, 89-101.
© Copyright 2026