
measurement of the current martian cratering size frequency
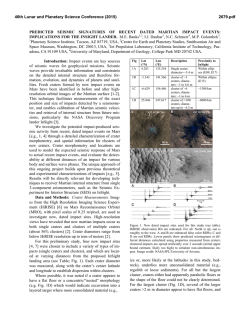
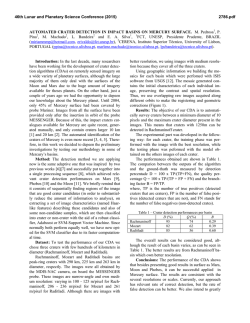
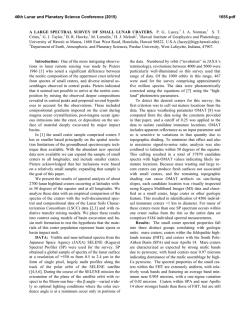
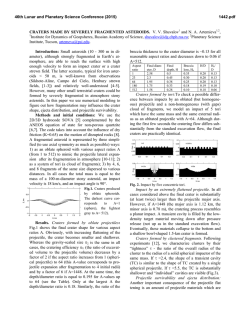
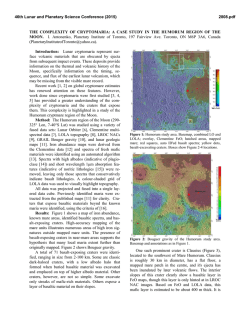
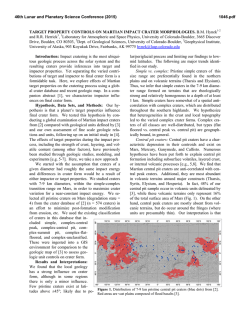
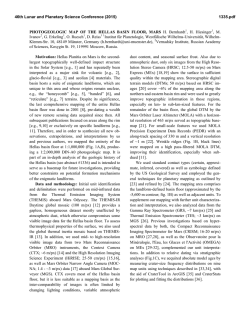
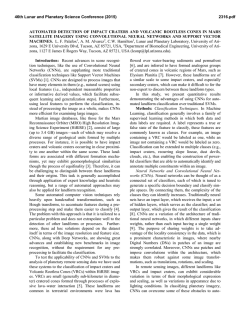
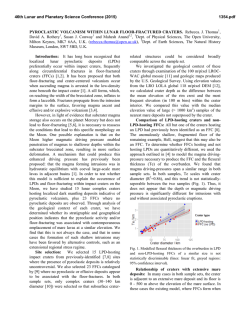
46th Lunar and Planetary Science Conference (2015)
2468.pdf
MEASUREMENT OF THE CURRENT MARTIAN CRATERING SIZE FREQUENCY DISTRIBUTION,
PREDICTIONS FOR AND EXPECTED IMPROVEMENTS FROM INSIGHT. I. J. Daubar1, M. P.
Golombek1, A. S. McEwen2, S. Byrne2, M. Kreslavsky3, N. C. Schmerr4, M. E. Banks5,6, P. Lognonné7, T. Kawamura7, F. Karakostas7. 1Jet Propulsion Laboratory, California Institute of Technology, Pasadena CA 91109 ([email protected]. gov). 2University of Arizona, Tucson AZ. 3University of California Santa Cruz, Santa Cruz
CA. 4University of Maryland, College Park MD. 5Planetary Science Institute, Tucson AZ. 6Smithsonian Air and
Space Museum, Washington DC. 7IPGP, Sorbonne Paris Cité, Univ Paris Diderot, France.
Introduction: In the last decade, nearly 500 new,
dated impact sites have been identified on Mars based
on before and after imaging (Fig. 1). The current cratering rate has been calculated using this data set [1, 2].
We will be able to use that measured production function (PF) to predict what the upcoming NASA Discover Program lander InSight [3] will be able to detect.
InSight will improve on this measurement in several
ways, including eliminating observational biases.
of eight for long time periods.
Monte-Carlo analysis of the spatial distribution of
this data set [2] leads to the conclusion that randomness of the detected population (even within dusty areas) is rejected with great confidence. Dark spots are
not uniformly created or detected everywhere in dusty
regions (Fig. 1). To compensate for the effect of nonuniform crater detection efficiency the PF needs to be
increased by a minimum factor of 1.7 [2]. More realistically, this factor probably varies with diameter since
it is likely that smaller craters are preferentially missed
over certain dusty terrains, biasing the SFD slope.
90
60
1.E-03
Latitude
30
0
All dated impacts
Icy impacts
Malin et al. 2006
CTX-CTX
-60
-90
0
60
120
East Longitude
180
240
300
Figure 1: 484 new dated impact sites on a map of the
TES Dust Cover Index [9]. Also shown are 19 confirmed sites from [6] & the subset constrained by CTX.
Current measured cratering rate:
Method: New impacts are initially recognized as
dark spots in Context Camera (CTX) [4] images that
were not present in previous images. The High Resolution Imaging Science Experiment (HiRISE) [5] follows
up to confirm an impact origin and measure the craters.
We scale the impact size frequency distribution (SFD)
to only those areas with repeat coverage and a minimum amount of dust cover, and by a spatial randomness correction. We use an Area-Time Factor (ATF)
that is a sum of area covered repeatedly by CTX, multiplied by the time difference between images at each
spot [1]. Figure 2 shows the resulting SFD using effective diameters (combined for clusters as in [6]) for 110
impacts with CTX before and after images, scaled to
an ATF of 4.68×10⁷ km2 yr. Our measured PF falls
below model PFs by Ivanov/Neukum [7] and Hartmann [8] by a factor of ~4 for ~4 m < D < 30 m. If
long-term orbital eccentricity variations are taken into
account [7], this discrepancy might increase to a factor
360
F(D)=Differential craters / km^3 / year
1.E-04
-30
1.E-05
1.E-06
Malin et al. 2006
CTX-CTX, 2013 (N=44)
CTX-CTX, updated (N=110)
Hartmann 1 y
1.E-07
1.E-03
1.E-02
1.E-01
Diameter (km)
Figure 2: Current SFD for a one-year PF using craters discovered in CTX before and after images [1, 2].
Shaded line is the best fit for craters 4-30 m diameter.
Results: The current cratering rate at Mars was
measured by [1] to be 1.7×10⁻⁶ D≥3.9 m/km2/yr. Recently we updated this measured rate to include newer
data; the results are nearly identical: 1.8×10⁻⁶ D≥3.9
m/km2/yr [2]. Detected craters are not randomly distributed, even within dusty areas with repeat coverage.
The modern CSFD (Fig. 2) is lower for D<50 m than
models commonly used to estimate crater retention
ages on Mars. If extrapolated to larger sizes, it would
be greater than those models. Using this PF to date a
46th Lunar and Planetary Science Conference (2015)
given surface would result in model ages that are higher by a factor of ~four if using small diameters, or
lower by some factor if extrapolated to larger sizes
[e.g., 10]. This surprising near-agreement might yet be
an accident if the current impact rate is not typical of
geologic time, i.e., we can’t rule out large short-term
fluctuations. The published martian isochrons should
be used with great caution for small craters. Our current impact rate statistics provide the best empirical
isochrons for the youngest surfaces on Mars, but they
still include uncertainties of a factor of about four.
Spatial distribution: The dark blast zones used for
initial detection are interpreted as being formed by
disturbance or removal of high-albedo surface dust in
the impact blast. Because this is key to the identification of new impact sites, the data set has an obvious
spatial bias toward the dustiest areas of Mars (Fig. 1).
Even within these areas, all dusty areas do not appear
to form dark blast zones equally efficiently [2]. Thus
current impacts may be occurring that are not being
detected, even in places where CTX has repeat coverage. InSight will address this problem by avoiding
such an observational bias toward dusty areas.
InSight: The InSight Discovery mission [3]
launches in 2016 and will carry a seismometer, Seismic Experiment for Interior Structure (SEIS) [11]. One
of the mission’s scientific objectives is to measure the
rate of meteorite impacts [3].
Predicted impact detections: Impacts are likely to
occur close to the InSight landing site. In fact, several
have occurred in the last few years near, and even
within, proposed landing ellipses [12, 13] (Figure 3).
SEIS will be able to distinguish impact-induced seismic signals from those of small quakes through the
analysis of the cutoff frequency [13]. SEIS will detect
small impacts nearby and large ones farther away; the
minimum detectable crater size increases with increasing distance out to ~3,000 km for the largest craters we
are likely to observe. Once the detection capability as a
function of distance is better characterized, we will be
able to predict the number of impacts that will be detected of a given size, using various production functions (PFs) from [1], [2], [8] and [14]. InSight will test
these predictions and provide an independent measure
of the current cratering rate at Mars.
Different biases: The detection capability of SEIS
is independent of a surface covering of high-albedo
dust, thus eliminating the bias toward blast-zoneforming areas in the method used by [1, 2]. Nonrandom distributions due to differing dust removal
behaviors will also be avoided.
Of course, SEIS will have its own observational biases that will need to be accounted for. (1) The capability of size detection with distance, which can be
2468.pdf
Figure 3: Locations of new dated impacts (yellow
squares) that have occurred near proposed InSight
landing ellipses (white; shown before downselection).
Basemap is TES DCI [9] (same scale as Fig. 1) over
THEMIS Day IR [15]. Lower dust cover to the west is
likely contributing to fewer craters being found there.
addressed by scaling the production function to appropriate areal extents for different diameters. (2) Target
properties and uncertainties in the calibration will initially influence the estimated sizes and distances of
impacts. Once several impacts have been detected by
SEIS, and located and measured in orbital images, this
issue will be addressed by that calibration. (3) Detection capability may be reduced for impactors that break
up in the atmosphere creating clusters of craters [12,
13], which comprise about half of the new impacts [1].
The seismic signal from a cluster may be spread out in
time, and its waveform will differ from that of a single
impact. These issues may complicate cluster impact
identification. Given that the proportion of clusters to
single-crater impacts is known, however, this bias can
also be corrected, given adequate statistics.
Conclusions: Measured current and model production function CSFDs will be used to predict the number
of impacts InSight will detect as a function of crater
size. InSight will test these predictions and clarify
some of the uncertainties in previously used CSFD
measurement methods and models.
References: [1] Daubar et al. (2013) Icarus 225,
506-516. [2] Daubar et al. (2014) 8th Mars Conf., Abs.
1007. [3] Banerdt et al. (2013) LPSC, Abs. 1915. [4]
Malin et al. (2007) JGR 112, 5. [5] McEwen et al.
(2007) JGR 112, 5. [6] Malin et al. (2006) Science
314, 1573-1577. [7] Ivanov (2001) SSR 96, 87-104. [8]
Hartmann (2005) Icarus 174, 294-320. [9] Ruff and
Christensen (2002) JGR 107, 5127. [10] Landis et al.
(2014) LPSC, Abs. 2661. [11] Lognonné et al. (2000)
Planet. Space Sci. 48, 1289-1302. [12] Schmerr et al.
(2014) GSA Abs. 259-12. [13] Banks et al., (2015)
LPSC. [14] Williams et al. (2014) Icarus 235, 23-36.
[15] Edwards et al. (2011) JGR 116, E10008.

© Copyright 2026