
THEORETICAL AND OBSERVATIONAL ESTIMATES OF
Marine Geology, 64 (1985) 91-111
Elsevier Science Publishers B.V., Amsterdam- Printed in The Netherlands
91
THEORETICAL AND OBSERVATIONAL ESTIMATES OF NEARSHORE
BEDLOAD TRANSPORT RATES
M.R. GOUD and D.G. AUBREY
Woods Hole Oceanographic Institution, Woods Hole, MA 02543 (U.S.A.)
(Received January 4, 1984; revised and accepted June 11, 1984)
ABSTRACT
~ ·i
Goud, M.R. and Aubrey, D.G., 1985. Theoretical and observatio,nal esti~ates of near·
shore bedload transport rates. Mar. Geol., 64: 91-~11.
Sediment transport rates in a shallow ( < 3 m) nearshore region are estimated using
theoretical models and using bedform migration rates measured from vertical aerial
photographs covering a 10-yr interval. Aerial photographs of the study area in Nantucket
Sound, Massachusetts, showed low-amplitude (tens of centimeters}, long wave- and crest·
length (tens to hundreds of meters), shore-normal sand waves in distinct geometrical
patterns. The waves migrated an average of 10-20 m yr-• over a 10-yr period; the migration distances and bedform dimensions were used to calculate an average volume trans·
port rate for the area. This rate was compared to bedload transport rates calculated using
a Meyer-Peter and Miiller model and a Bagnold model; field observations of steady cur·
rents and directional waves provided data for the calculations. Theoretical rates based
solely on asymmetrical tidal currents are as much as an order of magnitude smaller than
t}!e observed rates, but inclusion of storm wave effects in the theoretical predictions
brings them into better agreement with observations. This suggests that even in tidally
dominated, protected regions with low background wave energy, infrequent storm wave
events significantly modify sand transport rates and patterns.
INTRODUCTION
Studying the transport of sediment in the nearshore and shelf environment
raises problems of both theoretical and practical interest. In practice, problems of contaminant dispersal, coastal erosion and seafloor stability require
an understanding of sediment transport processes and this need has
generally been met through empirical studies. Theoretical advances in the
study of interactions between a movable bed and a fluid flow, however, have
provided new and effective tools for modeling sediment transport processes
in natural environments (e.g., Smith, 1977; Grant and Madsen, 1979).
Aspects of these theoretical approaches can be combined with field observations and empirical transport formulas to improve the understanding of
sediment transport processes in the natural environment.
Direct measurement of marine sediment transport is difficult and investigators have used a variety of techniques: dyed sand (e.g., Komar and Inman,
1970), radioactive tracers (e.g., Heathershaw, 1981) and bedform migration,
0025·3227/85/$03.30
©
1985 Elsevier Science Publishers B. V.
92
monitored with bathymetric profiles (Aubrey, 1979) or stake fields (e.g.,
Salsman et al., 1966). The difficulty of monitoring the small changes in
these transport indicators limits these studies to short time durations and
small areal extent. Transport rates evaluated in these types of studies are
time-averaged measures of the response of the bed to the flow and can
be generalized only in so far as the flow conditions during the period
of study can be assumed to be typical of a longer time duration and a
larger area.
Transport estimates can also be made with a more dynamically oriented
approach: measure the physical forcing mechanisms (i.e., waves and currents)
in the marine environment, employ fluid dynamical theory to convert these
records into bottom shear stress estimates and use empirical models to
calculate sediment transport rates. This method overcomes some of the
problems of direct measurement, since the estimates are derived from the
area's flow field and seafloor configuration. The flow field can be easily
measured over relatively long periods (months or years) or extrapolated from
long-term weather records; the seafloor configuration can be characterized
using samples, bathymetric profiles, photographs or direct observations.
However, uncertainties in calculating boundary shear stress based on point
velocity measurements in the water column and lack of field corroboration
for flume-derived sediment transport formulas make this approach unreliable in practice, even in steady-flow environments where the bed configuration is constant. Introduction of surface gravity waves and a movable bed
makes sediment transport calculations even more suspect. The empirical
transport formulas themselves were derived from steady-flow flume experiments and have undergone only limited testing in the field.
The uncertainties in the calculations are obvious when the method is
applied. Gadd et al. (1978) compared three bedload transport formulas
(disregarding suspended load) in a tidally dominated region and found
an order of magnitude difference in the predicted transport rates.
Heathershaw (1981) compared predicted transport with sand movement
measured using radioactive tracers; the predicted direction of transport
coincided with the observed, but with a large variation between estimates
of transport rates. The variations between the theoretical estimates in these
results emphasize the necessity for field experiments to constrain the theoretical approach.
This study compares sediment transport predictions based on currentmeter records and bedload formulas with transport calculated from sandwave migration distances. Use of aerial photographs to measure sand-wave
movement makes possible an unusually long time scale since photographic
coverage spanned ten years. High-frequency surface gravity waves are shown
to be important for sediment transport, even in a shallow, tidally dominated
nearshore region.
~
93
STUDY AREA
Sediment transport was examined on a shallow platform (<3m in depth)
extending one kilometer offshore from Popponesset Beach on Cape Cod,
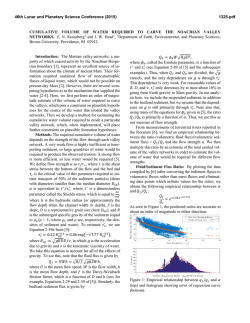
Mass. (Fig.1). The platform is located in Nantucket Sound between Cape
Cod and nearby islands. The bathymetry of the Sound is a complex configuration of shoals and channels, which complicates tidal flow patterns
and, with the sheltering effect of the islands, protects the study area from
open ocean swell.
The area of interest, referred to here as Popponesset Platform, is wedgeshaped, extending for 5 km along the shoreline from Succonesset Point
northeast to Meadow Point (Fig.1). Its seaward limit is defined by a steep
slope towards a channel which reaches depths of 11 m. The channel is less
than 3 km wide, shoaling rapidly to a linear ridge (Succonnesset Shoal). A
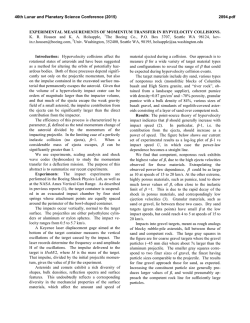
set of nearly shore-normal sand waves, easily distinguished on aerial photographs (Fig.2), cover the platform. Wavelengths and crestlengths are on the
order of tens to hundreds of meters, and soundings showed the waves range
from 30 to 60 em in height, with gently sloping, near-flat stoss slopes and
relatively steep lee slopes (Fig.3).
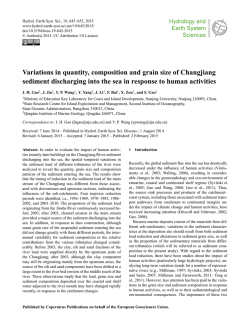
Photographs taken in successive years clearly show the sand waves
migrating slowly toward the southwest (Fig.4); the pattern of southwest
migration is also evident over time periods up to three decades (Fig.5).
Tidal flows on the platform generally parallel the shoreline and non-storm
wave energy is insignificant. Because of this, little on-offshore sediment
exchange takes place.
METHODS
~'.
'i.
A detailed net of sounding lines was run to determine the general
bathymetry of the region (Fig.6) and the dimensions of the sand waves.
Bathymetry was acquired using a 200kHz Raytheon DE719C precision echo
sounder, corrected for tides as measured at the time of the surveys. Navigation was performed with a Del Norte Trisponder microwave navigation
system with three shore-based transponders providing ranges to the vessel.
Precision is within 5 m (root-mean-square error).
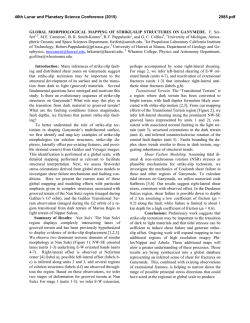
Distances of migration of the sand waves, measured from high precision,
map quality vertical aerial photographs, average 10-20 m yr- 1 over the
period 1971-1981. Series of photographs at a scale of 1:18,000 were
taken on four separate dates between August 1981 and October 1982 as a
part of this study. Migration distances from 0 to 30 m are visible over that
year (Fig.4). A set of photos taken in 1971, archived at the U.S. Department
of Agriculture, provided data for longer term migration rate measurements
(Fig.5). Forty-three sets ofaerialphotoshavebeentakenofthisareabetween
1938 and the present (Aubrey and Gaines, 1982) and platform sand wave
patterns are visible on most of them. However, variable migration rates,
differences in photo scales and poor photo quality before 1970 make
_s
0
~
,;,.
~
0~
!?
!?
0~
!?
<7to36'/V
0
I
2
3km
DEPTHS IN FEET
AT MEAN LOW WATER
TOWN OF
MASHPEE
<7fo>
v<;'
<7Jo32'
42°00'
0
<7to 3o•
_F
~
Fig.l. The Popponesset barrier beach setting, Cape Cod, Mass. Popponesset Platform is enclosed in box.
'b."
.,._,
41"30'
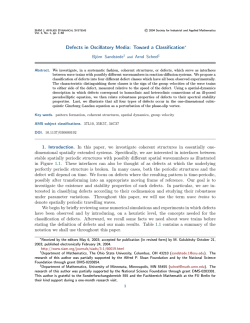
Fig.2. Aerial photograph of study area, showing sand waves on Popponesset Platform.
Photo taken 19 August 1981.
correlation of individual sand waves impossible beyond the ten-year interval
1971- 1981, limiting the study to that period.
Grain-size characteristics used in the sediment transport formulas are
determined from 27 surface sediment samples from the platform (Fig. 7).
Samples were collected using a hand-operated grab sampler and analyzed for
grain-size distribution using an electronic settling tube (Schlee, 1966). All
samples were fine-to-coarse, abiotic sand with negligible silt- or clay-sized
(0
a>
~Ala suu~otc..,X
SlDIM( N/I WA TU
I N7ftfACl
l
-..._
0
-
--------------------------
BothYJMtrlc Pl'otllo o f Study Aru
~
me1 e tt
Fig.3. Bathymetric profile of Popponesset Platform. Location shown in Fig.4.
n
-
500
'
2
2
rr><
y]
;
1
2000
97
0
kilometers
I
sand waves, m~
I
.'..-- 1911 ( 19U
f
(no ,.! m~•..!ion)
Fig.4. Sand-wave migration patterns on Popponesset Platform for the period 1981-1982.
Location of profile in Fig.3 is shown.
components and little or no gravel. Median grain sizes (Fig. 7), calculated
using graphic moments techniques (Inman, 1952), ranged from 26 to 67 Jlm.
Eigenfunction analysis of the grain-size classes of all 27 samples gave a mean
grain size for the platform of 35 11m, and this value was used in transport
calculations (for details of the eigenfunction analysis, see Aubrey and Goud,
1983). The low volume of silt and clay and lack of biological activity
allowed an assumption of cohesionless transport. Sediment grain density is
assumed to be 2.65 g cm- 3 •
Two current meter deployments were made in the study area during the
fall of 1982. A Neil Brown two-axis acoustic current meter, sampling at a
1 0-s interval, was located on the platform .. from 22 October through
9 November (Fig.7). Water depth was approximately 2.5 m with the sensor
1.5 m above the bottom. The second set of current measurements was part
of a wave gage deployment in 6.5 m of water in the channel (Fig. 7) from
2 November through 30 November, 1982. The instrument was a Sea Data
635-12 wave gage, which consists of a two-axis electromagnetic current
sensor located 1.98 m above the bottom and a precise quartz oscillator
98
0
kilometers
/
sahd waves, 1.911
sand waves, 1'81
Fig.5. Sand-wave migration patterns on Popponesset Platform for the period 1971-1981.
pressure sensor, internally recording. The instrument sampled flows continually at 30-min intervals, with burst sampling every four hours at a 1-s
rate for 2'064 s.
Both records showed a strongly rectilinear, semi-diurnal tidal flow parallel
to th¢ coast. Channel flow direction was 45°TN (clockwise from tiue north)
on flood tide and 225°TN on ebb. A rotary component spectral analysis
('Gonella, 1972) of the platform tidal data gave an ellipse orientation of
217°TN for all tidal components and practically no shore-normal flow.
Flows in the channel were generally faster than on the platform: there the
root-mean-square amplitude of the tidal flows was approximately 41 em s- 1 •
On the platform the rms amplitude was 34 em s-1 and flow velocities
reached 40 em s-1 less than 2% of the time (Fig.8). Net tidal asymmetries
to the southwest were observed in both records; asymmetries in speed and
duration of the flows are responsible for net sediment transport.
Wave energy wa.s low during the month of deployment, with an average
sea. surface variance (17 2 ) of only 61 cm 2 , calculated from measurements of
the free surface :t'rom mean sea level (17) due to surface gravity waves. Variance
is related to the total wave energy per unit area (E) by the equation:
d'
99
POPPONESSET BEACH
MASHPEE/COTUIT, MA
BENCHMARK DESCRIPTION( MASS COORDINATES-FT.)
1. COTUIT·
~· 890,674
~ • 223,320
~. ~~~~~ fUn8 E~~~'r: 1 ; ~~]8:l44Y' 2/~·Jb~.BB4
,-
DEPTHS
5
IN
METERS
BATHYMETRY
FROM
AUGUST-OCTOBER
SHORELINE FROM AUGUST
\982
\982
VERTICAL DATUM IS MEAN WATER
LEVEL
BY:
FOR AUGUST 1982
M GOUD, S GEGG, ond
D AUBREY
0
KllOMEHRS
Fig.6. Detailed bathymetric map of the Popponesset Beach region.
0
kilometers
•. ll~
• Surface sediment samples
• Sediment cores
• Current meter
t Wave gage
.'ltl• •.301
•.t'f'f
0
.lll
0
,31>~
•-311
• . 5'1-
Fig. 7. Locations and median grain size of surface sediment samples and locations of
instruments deployed (grain size in mm).
100
POPPON£SSET PLATFORM
CURRENT SPUDS
100
<I>
~
80
c.t
60
~
NORTHEAST
D
SOUTHWEST
= 60 seconds
T = 15.8 days
t::
~
<I>
<I>
~
~
.....
t::
<I>
~
.... 40
<I>
10 "'
Q..
"'
~
'-:!
.......
1:;)
.....
~ 20
5
·!2
.....
t::
<I>
~
....
<I>
0 Q..
0
0
10
20
30
40
50
Speed Class (em/sec)
Fig,8. Histogram of tidal currents during current meter deployment on Popponesset
Platform. Percent in speed class in a particular direction is indicated by upper limit of
appropriate pattern. T "' record length; At "' period over which 1 0-s samples were
averaged.
E = pg (f12 >
where p is the density of water and g is gravitational acceleration. Another
representation of wave energy, significant wave height (H 113 ), is the mean
height of the highest one third of the waves and is close to the wave height
one would estimate visually. It is approximated as:
H,/3 =4~
For the period of the study, mean significant wave height was only 24 em
and the mean peak period was between three and four seconds. Waves in
this range will have a non-linear reaction with the tidal current to enhance
boundary shear stress (Grant and Madsen, 1979) and thus increase sediment
transport. These small waves, however, add only minimally to the total
bottom stress: the enhanced shear velocity (u*) is at most 15% greater than
that calculated from the current alone. This falls within the range of uncertainty due to other factors (e.g., boundary roughness, skin friction/total
shear-stress ratio, critical shear stress, all discussed in more detail below), so
the process will be linearized to assume quasi-steady flow due to tidal
currents.
Comparisons of wave and wind activity, based on hourly meteorological
observations at nearby Otis Air Force Base during October and November,
showed surface waves responding directly to local winds (Fig.9). Both wave
energy and direction were directly correlated with winds, indicating that
wave climate for this area can be estimated from local weather records,
...:..·
101
I~pw I ,Total Wind Stress
{
~)
2
Steady Wind
sec
2800
"
2000
H ' Signi Iicon! Wove Height (m)
1
13
3
5
15
10
20
23
NOV 1982
Fig. 9. Time series of significant wave height (H, 1,) and wind stress during wave gage
deployment.
without consideration of open ocean swell. This observation is important
for long-term estimates of sediment transport.
Maximum windspeeds during November, 1982, were about 10 m s- 1 ,
generating waves with a significant height of about 1.0 m in the channel and
a period of four seconds (over the fetch of Nantucket Sound). Based on
shallow-water wave models, a 12.5 m s- 1 wind would generate 1.3 m waves
with a maximum period of five seconds; 1.0 m surface gravity waves would
be generated on Popponesset Platform by extended periods of 7.5 m s- 1
winds. Waves of that magnitude would affect sediment transport on the
platform by greatly increasing the bottom shear stress.
RESULTS AND DISCUSSION
Volume sediment transport rates were calculated using three different
methods. Net volume transport was calculated based on sand-wave migration
distances; two sets of bedload transport volumes were calculated based on
the platform current measurements, one using a modified Meyer-Peter and
Muller (1948) equation, the other with a modified Bagnold (1963) formula.
Comparison of these estimates tests the assumption that the volume of
sediment transported in the sand wave can be approximated by the bedload
transport estimates. This equivalence has been verified by a history of
observation of bedform migration as a vehicle for bedload transport of
sediment, dating from Gilbert's (1914) careful observations of sediment
movement in streams and flumes. Bedforms as transport mechanisms have
102
been studied widely since then in both the laboratory (e.g., Simons and
Richardson, 1961) and the field (e.g., McCave, 1971; Bokuniewicz et al.,
1977). Since neither bedform migration nor the bedload transport equations
include suspended load, both are minimum estimates of total sediment
transport.
While the term sand wave is sometimes used to describe any periodic
irregularity in a granular material from scales of centimeters to hundreds
of meters (Yalin, 1972), its use here is limited to large scale bedforms which
do not respond to short-period (i.e., tidal cycle) variations in the sediment
flux. Smaller scale (em) bedforms which form in response to flows only
slightly greater than threshold for sediment motion will be referred to as
ripples; they are superimposed on the large sand waves and are assumed to
cover the platform. This usage is consistent with the literature for environments comparable to Popponesset Platform.
SAND-WAVE VOLUME TRANSPORT
Calculation of long-term sediment. transport rates based on migration of
the Popponesset sand waves required an estimate of the volume of sand
within a wave. The sand-wave volume was modeled two ways. A minimum
volume was calculated using the assumption that the sand movement is concentrated in the immediate vicinity of the wave crest, forming in cross section an isolated, asymmetric triangle which migrates across the flat platform
(analogous in appearance to a solitary wave). A reference sand-wave volume
Vo(min)(= volume per meter of crest length per wave length) was calculated,
based on a detailed survey of a single, representative sand wave. The area
under the wave, from the trough of the wave on its downstream side to
where the wave appeared flat on its stoss slope, was measured in each profile.
Integration of those areas yielded the total volume of the sand wave; division by the crest length gave Vo(min)• which can be multiplied by observed
crest length to estimate individual sand wave volume. This bulk volume
was multiplied by 0.6 to account for porosity (Yalin, 1972). This method
accounted for irregularity of wave shapes, gradual disappearance of the
waves at their ends and the need to relate measured migration distances of
wave crests to sand volumes. Vo(min) was calculated as 15.2 m 3 m- 1 A- 1 •
For a maximum estimate, a 15 em thick layer of "active sand" is assumed
to exist across the interval between wave crests, with a porosity factor of
0.6, so that Vo(max) = Vo(min) + (0.6) (0.15) A. This estimate accounts for
mobility of the bottom layer: sand is being transported across the entire
platform, not simply in the crestal area of large-scale sand waves. Ripples
serve as transport mechanisms and are ubiquitous over the platform. The
low steepness (wave height/wave length) of the sand waves made the sandwave shape indistinguishable from the local topography only a few meters
from the crest, making it impossible to integrate the sand wave volume
across the entire wavelength and necessitating this "active layer" approximation. The 15-cm layer agrees well with the maximum depth of sediment
103
"
burial determined by Heathershaw (1981) in a similar environment, based
on radioactive tracers. Also the total volume calculated using the Vo(max) for
a 100-m wave is close to a volume determined using the area under an
idealized sand wave of triangular profile, 50 em in height with a length of
100m, dimensions typical of sand waves on Popponesset Platform.
Ten-year sediment transport rates were calculated for sand waves A
through M (Figs.4 and 5). Maximum and minimum transport rates (m 3
perm of platform width per year) were calculated using the formulas:
I
=
Vo<mm>D
r(min)
A
and:
I
_(Vo(min>+
r(max)-
0.09A)D
A
where D = average annual migration distance and A = wavelength. These
normalized rates varied from sand wave to sand wave because of differences
in migration distances and wavelengths. Minimum estimates ranged from 0.4
to 2.3 m 3 m- 1 yr- 1 and maximum estimates from 1.0 to 3.3 m 3 m- 1 yr- 1 •
Mean values were 1.24 and 2.3 m 3 m- 1 yr- 1 , respectively, with uncertainty
of approximately 0.5 m 3 m- 1 yr- 1 • ·
Since these values are normalized by the wavelength, they represent the
average volume rate of sand transport past a line on the platform. For
example, for a point opposite Popponesset Spit where the platform is about
1 km wide, the transport estimates fall in the range:
1240 m 3 yr- 1
<V<
2300 m 3 yr- 1
PREDICTED SEDIMENT TRANSPORT BASED ON FLOW FIELDS
Application of laboratory-derived, empirical sediment transport formulas
to a field situation requires a set of assumptions about the physics of .the
interaCtions of the seabed with the flow. We relate our point velocity
measurements to bed shear stress using either the Karman-Prandtllogarithmic
velocity profile or a drag coefficient. The Shields curve is used to define a
threshold shear stress for initiation of motion. The bedload equations. used
in this study were formulated in laboratory flows generating shear stresses
only slightly stronger than necessary for initiation of sediment motion, so
they are not appropriate for situations involving suspended transport.
The volume of sediment in suspension can be determined by comparing
the shear velocity (u*) with the fall velocity of the sediment grains (.zp),
in the form:
w
p =s
KU*
For values of P 8 >2, suspended
~oad
is negligible (Smith, 1977); using the
104
maximum tidal current in the Popponesset area of about 40 em s- 1 and the
fall velocity of the median grain size, a value of P5 = 4.64 is obtained. The
bedload criterion is therefore met.
The Shields curve is the most reliable criterion available for initiation of
motion on a flat bed, although some investigators have suggested that it
underpredicts the threshold velocity in rippled bed environments (Dyer,
1980). The logarithmic velocity profile and drag coefficient relate the current velocity to shear stress on a flat or rippled surface, but they do not
account for the effects of large scale features found in natural environments,
such as the Popponesset Platform sand waves. An analysis of flow over a
wavy bottom (Smith, 1977) to determine the sand waves' effects on the
flow, however, showed that these small amplitude waves had a negligible
effect on the flow at 150 em from the bottom where these measurements
were made, justifying the rippled flat bed assumption.
Meyer-Peter and Muller model
The Meyer-Peter and Muller (M-PM) bedload formula is a simple, purely
empirical method for estimating sediment transport, developed using extensive flume data (Meyer-Peter and Muller, 1948). It is based on the assumption that bedload volume transport is related to boundary shear stress
beyond the value necessary for initiation of sediment motion, as expressed
in the difference in Shields Parameter values l/J - l/J c· The method has been
tested in more recent laboratory studies (Wilson, 1966; Fernandez Luque
and Van Beck, 1976) and found to be quite accurate.
To estimate sediment transport rate from flow measurements using this
method, the current velocity is converted to a boundary shear stress using
the Karman-Prandtllogarithmic velocity profile:
u
1
z
u*
K
Zo
- = -lnwhere u is the velocity measured a distance z from the bottom; K is von
Karman's constant, equal to 0.4; z 0 is a measure of the boundary roughness; and u* is the shear velocity, equal to v:r;{P; r 0 is boundary shear
stress; p is fluid density. The primary roughness elements upon which the
value of z 0 depends were assumed to be ripples whose parameters were
defined by the median grain size (d) according to Yalin (1972), so that
A.r = ripple length = 1000 d and H = ripple height = 0.1 A.r. These dimensions were used to determine the Nikuradse equivalent sand-grain roughness, kb, and thence the roughness length z 0 • In rough turbulent flow, the
condition at Popponesset during sand transport, z 0 equals kb/30. For a flat
bed, the equivalent sand-grain roughness equals the sand-grain diameter,
but for a rippled bed it is greater and for current-formed ripples can be
defined (Glenn, 1983):
kb = 30H (H/A.)
105
For a mean grain size of 35 11m and a rippled bed:
z0
=
0.35 em
A boundary shear stress can be calculated from each velocity measurement using these formulas. This shear represents the total stress acting on
the flow and can be parameterized into a skin friction component and a
form drag component according to a drag partitioning scheme (Engelund,
1966). The skin friction, which is responsible for bedload transport, is generated by the interaction of the fluid with the sand grains in the bed. In this
case, drag partitioning shows skin friction representing 60% of the total
shear stress felt by the flow; Meyer-Peter and Mi.iller (1948) found skin
friction over a rippled bed to be 50% of the total. The rest of the shear stress
is due to pressure gradients generated by flow over the ripples.
A modified Shields diagram (Madsen and Grant, 1976) was used to determine the critical shear velocity for initiation of grain motion. The critical
Shields parameter l/1 [= r 0 /(s-1)pgd] is 3.6 X 10⁻² , which translates to a
critical shear velocity of .1.41 em sd .. We assume here that the median grain
size for the platform adequately represents the bed.
Each velocity measurement was used to calculate a Shields parameter
value. If the calculated Shields parameter was greater than the critical value,
volume sediment transport was calculated using the modified M-PM bedload equation:
qsb = 8 [
dj(~- 1)pgd J (l/1- l/lc) 312
p
This equation can account for partitioning of the total shear stress, but has
been changed from the original M-PM to explicitly include the Shields parameter (Wilson, 1966).
To calculate transport rates, the 17 -day velocity record was averaged over
640-s intervals and each velocity used to produce a transport estimate. The
positive (northeast) and negative (southwest) values were summed separately
to provide gross directional transport values, then added together to estimate net transport rates for the period of current meter deployment.
Because tidal flows are generally predictable, to first order the 17 -day
record can be assumed to reflect conditions throughout the year. On this
assumption, yearly transport rates were extrapolated from the 17-day transport values (Table I).
The MP-M estimates are strongly dependent on two parameters which may
vary with unsteadiness in the flow and irregularities in bedforms: the skin
friction/total bed shear stress ratio and the z 0 value. The skin fraction
percentage calculated using the Engelund method (60%) and the z 0 value
derived from equilibrium bedforms in a steady flow over a uniform sand
(0.35 em) are maximum estimates. The effects of varying these parameters
are shown in Table I; the MP-M calculations are particularly sensitive to
variations in the skin friction percentage. Even the highest estimates, how-
106
TABLE I
Calculated sediment transport rates on Popponesset Platform (m 3 m-1 yr--1)
Net positive
to S.W.
Gross transport rates
toNE
to SW
Total
Sandwave volume, minimum
Sandwave volume, maximum
1.24
2.29
n.a.
n.a.
n.a.
n.a.
n.a.
n.a.
Meyer-Peter, Miiller (current only)
0.71
0.38
0.13
0.32
0.36
0.10
0.01
0.07
1.07
0.48
0.14
0.39
1.43
0.58
0.15
0.46
1.01
1.22
2.24
3.43
0.13
0.21
0.07
0.11
0.20
0.32
0.27
0.43
% skin friction~ 0.5
% skin friction ~ 0.4
Z0 ~
0.17
Meyer-Peter, Muller [current/
wave (t./1 cr ~ 0)]
Bagnold (current only)
(3 ~
(3 ~
4.5 X 10⁴
7.2 X 10 4
Meyer-Peter, Muller calculations have the following parameter values, with exceptions
as noted: Z 0 ~ 0.35 em; skin friction/total bed shear~ 0.6; t./1 cr ~ 0.035. Bagnold calculations have a critical velocity ucr ~ 21.0 em s--1 for current only.
ever, are substantially smaller than the minimum volume transport predictions based on sand wave migration. This suggests that currents alone are not
responsible for the observed transport, and the effects of storm waves on
total transport should be incorporated. This can be accomplished in a
general way using long-term wind records with the current measurements.
Since background (non-storm) wave energy is low, daily wave activity
has little or no effect on the boundary shear stress. A sustained wind of
greater than 15 knots (7.5 m s- 1 ), however, increases local significant wave
heights to 1.0 m or more, with periods of more than four seconds. Applying
the Grant and Madsen (1979) model for boundary shear stress due to combined wave and current activity shows waves of this size increase the shear
stress above the critical value for all values of current velocity. Under the
assumption that current measurements represent the driving force for sediment transport even during storms, with waves having only the effect of
increasing bed shear stress to make sediment available for transport, stormgenerated transport can be estimated.
Calculations using the M-PM formula were repeated with the critical
Shields parameter set to zero, assuming wave shear stress is sufficient to
initiate sediment motion. A physical limitation to this approach is its neglect
of the non-linear effects of wave/current interaction (Grant and Madsen,
1979), a problem which is compounded when the M-PM equation is
linearized by simply dropping the critical Shields parameter. The estimates,
therefore, can be viewed only as first-order approximations of the effects of
waves on sediment transport. Likewise, values of z 0 and skin friction/total
shear change as bedforms are washed out by increased wave stress, but for
the purpose of this rough comparison they will be left constant. National
weather service records show wind velocities greater than 7.5 m s- 1 approxi-
,:\
107
mately 22% of the time, so transport rate estimates are based on combined
wave/current shear stresses 22% of the year, with tidal currents alone determining the remainder.
These predicted rates fall much closer to the transport rates calculated
from sand wave migration (Table I). These wave/current estimates give a
rough indication of the effects of wave action on boundary shear stress and
sediment transport, demonstrating that excess transport calculated by sand
wave migration can be explained partly by storm wave action. The calculations reflect several simplifying assumptions: that effects of changes in bed
roughness due to increased shear stress are negligible; that transport rates
based on laboratory-developed bedload models for unidirectional flow are
representative of wave-dominated conditions in the field; that the M-PM
equation can be linearized as described above; and that currents during
storms are well-represented by our 17-day record, rather than depending on
storm setup. While the closer agreement with observed rates demonstrates
the potential importance of storm waves even in this sheltered, tidally
dominated environment, specific transpor'j;·values are only estimates.
Bagnold model
The Bagnold model rests on the assumption that the volume of bedload
transport is proportional to the stream power per unit area of the bed lost
due to friction between the fluid and the bed (Bagnold, 1963). The power
per unit area can be expressed in terms of the boundary shear velocity
cubed (Inman et al., 1966), which can be related to current velocity to
calculate transport estimates from current meter data. Other studies (Gadd
et al., 1978; Heathershaw, 1981) have applied the Bagnold sediment transport equation to nearshore current measurements; Heathershaw (1981)
also compared predictions with transport rates based on tracer dispersion.
The Bagnold formula was modified by Gadd et al. (1978) to incorporate a
threshold shear stress. Using flume data from Guy et al. (1966), they express
the original Bagnold equation in terms of the velocity one meter above the
bed, U 100 , and a critical current velocity U cr:
qsb =
!._
(U10o -
Ucr) 3
Ps
The empirical coefficient of proportionality ~. determined from the flume
data, incorporates the drag coefficient Cd 100 = 3.1 X 10⁻³ • Values of ~
ranged from 7.22 X lo-s to 1.73 X lo-s g cm-4 s2 for dso equal to 190 and
450 pm, respectively, with a mean value of 4.48 X lo-s g cm-4 s2 • The mean
and larger values were used in our calculations.
The logarithmic velocity profile was used to determine U 100 from measurements at z = 150 em, with the critical U 100 obtained from the Shields
diagram. The critical velocity obtained in this manner is 21 em s- 1 , based
on the median grain size for the platform.
108
Gross and net transport rates were calculated in the same manner used
for the MP-M method. The values determined from the 640-s average current
velocities (Table I) are substantially lower than the M-PM rates, but within
the same order of magnitude and in the same direction. Variation of the
skin friction/total shear ratio in the M-PM calculations can bring them into
near agreement.
CONCLUSIONS
This study has several implications for the study of sediment transport in
the nearshore environment. First, results provide a rough corroboration of
laboratory-derived sediment transport formulas for field situations on time
scales of years to decades. Measured and theoretical estimates determined in
this study are the· same order of magnitude and in the same direction. Given
the uncertainties and assumptions, this agreement is encouraging. The rough
agreement between the Meyer-Peter and Muller and Bagnold calculations
for unidirectional, steady flow strengthens this argument since both
Heathershaw (1981) and Gadd et al. (1978) found the Bagnold formula to
be the most accurate for prediction of bedload transport. Partitioning of
the total boundary shear stress into skin friction and form drag components
was critical to the M-PM estimates, however, and the assumptions made in
partitioning are rather uncertain. The variability introduced by changing the
skin friction/form drag ratio emphasizes the need for a reliable method for
measuring or calculating the shear stress on a rippled bed. The Meyer-Peter
and Muller equation is useful for examining the effects of variation of different parameters on transport estimates since it makes the calculation more
responsive to a particular flow. As flow conditions can be more accurately
measured and their interactions with the seafloor better understood, this
method should become more widely used.
Secondly, the study demonstrates the importance of wave action in any
nearshore environment. Wave energy is generally very low on this sheltered,
shallow platform; but infrequent, high-energy storms are critical to modeling
net transport of sediment, even in a tidally dominated region of this sort.
Finally, this study has demonstrated the utility of long-term photographic
coverage of shallow, nearshore regions floored by large bedforms. Bedform
migration rates, under suitable water conditions and depths, can be documented better from these photographs than from repeated bathymetric
profiling or tracer studies.
Theory and measurement techniques must undergo numerous changes
and advances before accurate sediment transport predictions can be confidently made from measurements of waves, currents and grain size. The
agreement between theory and measurements of net transport demonstrated
in this study, however, is an encouraging measure of the convergence of
field and lab techniques over time scales of interest to scientists and
engineers.
109
ACKNOWLEDGEMENTS
..
The research described in this paper was supported by the Town of
Mashpee, Mass., a Community Assistance Grant from the Massachusetts
Coastal Zone Management Program, the Woods Hole Oceanographic Institution Sea Grant Program Grant No. NA80AA-D-00077(RB-40), the Woods
Hole Oceanographic Institution Coastal Research Center and the Alcoa
Foundation. We would like to thank Mr. Steve Gegg of W.H.O.I. for his
support in the field work and programming. We also thank Pam Barrows for
her help in preparation of this paper. Woods Hole Oceanographic Institution
Contribution No. 5669. Thomas M. Bracher, William D. Grant and John D.
Milliman provided helpful comments on the manuscript.
APPENDIX
Key to symbols
cd100
d
D
E
g
H
H1/>
Jr
kb
qsb
s
u
u*
U100
ucr
v
vo
w
z
Zo
(1)2)
(3
1)
I<
A
Ar
p
Ps
To
V;
...
'
1\
= drag coefficient relating current velocity at z = 100 em to boundary shear stress
=mean sand-grain size (em)
= average annual sand·wave migration distance (m)
= total wave energy per unit area (dyne em--.)
= gravitational acceleration
=ripple height (em)
=significant wave height (em)
= volume sediment transport rates (m 3 m""' yr""')
= Nikuradse equivalent sand-grain roughness (em)
= bedload transport rates of sediment ( cm 3 m-1 yr""')
= relative density of the sediment particle p 5 lp
= measured current velocity (em s""')
= shear velocity = r 0 I p (em s-1 )
= current velocity 100 em above the bed (em s-1 )
= critical U1 00 for initiation of sediment motion
=volume rate of sediment transport (m 3 yr-1 )
= reference sand-wave volume (m 3 m-1 A - 1 )
= sediment grain fall velocity (em s- 1 )
= distance above seafloor (em)
=boundary roughness length (em)
= wave-energy variance (cm 2 )
= coefficient of proportionality in Bagnold formula (gem .... s 2 )
= displacement of the free surface from mean sea level, due to surface waves (m)
= Von Karman's constant
•·
= wavelength of sand wave (m)
=ripple length (em)
= fluid density (g cm-9)
= sediment density (g cm-3 )
= boundary shear stress (dyne cm-2)
= Shields parameter = r 0 I [ (s-1) pgd]
110
REFERENCES
Aubrey, D.G., 1979. Seasonal patterns of on/offshore sediment movement. J. Geophys.
Res., 84: 6347-6354.
Aubrey, D.G. and Gaines, A.G., 1982. Recent evolution of an active barrier beach complex: Popponesset Beach, Cape Cod, Mass. Woods Hole Oceanogr. Inst., Tech. Rep.,
WHOI-82-3: 77 pp.
Aubrey, D.G. and Goud, M.R., 1983. Coastal sediment transport: Popponesset Beach,
MA. Woods Hole Oceanogr. Inst., Tech. Rep., WHOI-83-26: 132 pp.
Bagnold, P.A., 1963. Mechanics of marine sedimentation. In: M.N. Hill (Editor), The
Sea, 3. Wiley, New York, N.Y., pp.507-582.
Bokuniewicz, H.J., Gordon, R.B. and Kastens, K.A., 1977. Form and migration of sand
waves in a large estuary, Long Island Sound. Mar. Geol., 24: 185-199.
Dyer, K.R., 1980. Velocity profiles over a rippled bed and the threshold of movement
of sand. Estuarine Coastal Mar. Sci., 16: 181-199.
Engelund, F., 1966. Hydraulic resistance of alluvial streams. J. Hydraul. Div., Am. Soc.
Civ. Eng., 92 (HY2): 315-326.
Fernandez Luque, R. and Van Beck, R., 1976. Erosion and transport of bed-load sediment. J. Hydraul. Res., 14: 127-144.
Gadd, P.E., Lavelle, J.W. and Swift, D.J.P., 1978. Estimates of sand transport on the New
York Shelf using near-bottom current meter observations. J. Sediment. Petrol., 48:
239-252.
Gilbert, G.K., 1914. The transportation of debris by running water, based on experiments made with the assistance of E.C. Murphy. U.S. Geol. Surv., Prof. Pap. 86,
263 pp.
Glenn, S.M., 1983. A continental shelf bottom boundary layer model: the effects of
waves, currents and a moveable bed. Ph.D. Thesis, Woods Hole Oceanographic
Institution, Woods Hole, Mass.
Gonella, J., 1972. A rotary-component method for analyzing meteorological and oceanographic vector time series: Deep-Sea Res., 19: 833-846.
Grant, W.D. and Madsen, O.S., 1979. Combined wave and current interactions with a
rough bottom. J. Geophys. Res., 84: 1797-1808.
Grant, W.D. and Madsen, O.S., 1982. Moveable bed roughness in unsteady oscillatory
flow. J. Geophys. Res., 87: 469-481.
Guy, H.P., Simons, D.B. and Richardson, E.V., 1966. Summary of alluvial channel data
from flume experiments 1955-1961. U.S. Geol. Surv., Prof. Pap. 4621, 92 pp.
Heathershaw, A.D., 1981. Comparisons of measured and predicted sediment transport
rates in tidal currents. Mar. Geol., 42: 75-104.
Inman, D.L., 1952. Measures for describing the size distribution of sediments. J. Sediment. Petrol., 22: 145-152.
Inman, D.L., Ewing, G.C. and Corliss, J.B., 1966. Coastal sand dunes of Guerrero Negro,
Baja, California, Mexico. Geol. Soc. Am. Bull., 77: 787-802.
Komar, P.D. and Inman, D., 1970. Longshore sand transport on beaches. J. Geophys.
Res., 75: 5914-5927.
Madsen, O.S. and Grant, W.D., 1976. Sediment transport in the coastal environment.
Ralph M. Parsons Lab. Rep. 209, Mass. Inst. Tech., 105 pp.
McCave, I.N., 1971. Sand waves in the North Sea off the coast of Holland. Mar. Geol.,
10: 199-225.
Meyer-Peter, E. and MUller, R., 1948. Formulas for bedload transport. Proc. 2nd Meet.,
Mtl. Assoc. Hydraulic Struct. Res., Append. 2: 39-64.
Salsman, G.G., Tolbert, W.H. and Villars, R.G., 1966. Sand wave migration in St. Andrew
Bay, FL. Mar. Geol., 4: 11-19.
Schlee, J., 1966. A modified Woods Hole rapid sediment analyzer. J. Sediment. Petrol.,
36: 403-413.
''!
111
Simons, D.B. and Richardson, E.V., 1961. Forms of bed roughness in alluvial channels.
Proc. Am. Soc. Civ. Eng., 87 (HY3): 87-105.
Smith, J.D., 1977. Modeling of sediment transport on continental shelves. In: E.D.
Goldberg, I.N. McCave, J.J. O'Brien and J.H. Steele (Editors), The Sea. WileyInterscience, New York, N.Y., pp.539-577.
Wilson, K.C., 1966. Bed-load transport at high shear stress. Proc. ASCE, J. Hydraul.
Div., 92 (HY6): 49.
Yalin, M.S., 1972. Mechanics of Sediment Transport. Pergamon, Oxford, 290 pp.
'•
·''
"


© Copyright 2026