
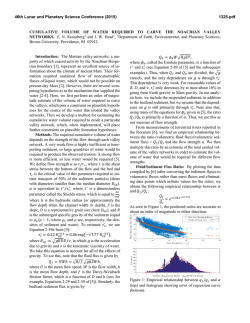
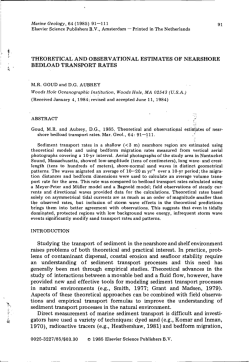
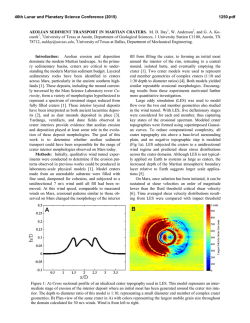
Variations in quantity, composition and grain size of Changjiang
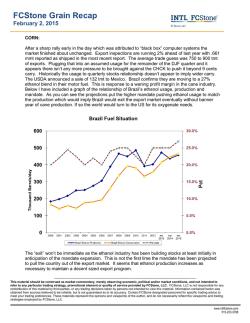
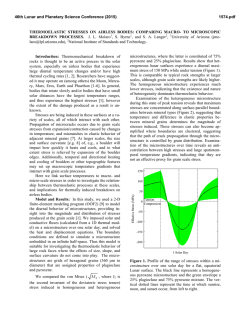
Hydrol. Earth Syst. Sci., 19, 645–655, 2015
www.hydrol-earth-syst-sci.net/19/645/2015/
doi:10.5194/hess-19-645-2015
© Author(s) 2015. CC Attribution 3.0 License.
Variations in quantity, composition and grain size of Changjiang
sediment discharging into the sea in response to human activities
J. H. Gao1 , J. Jia2 , Y. P. Wang1 , Y. Yang1 , J. Li3 , F. Bai3 , X. Zou1 , and S. Gao1
1 Ministry
of Education Key Laboratory for Coast and Island Development, Nanjing University, Nanjing 210093, China
Research Centre for Island Exploitation and Management, Second Institute of Oceanography,
State Oceanic Administration, Hangzhou 310012, China
3 Qingdao Institute of Marine Geology, Qingdao 266071, China
2 State
Correspondence to: J. H. Gao ([email protected]) and Y. P. Wang ([email protected])
Received: 7 June 2014 – Published in Hydrol. Earth Syst. Sci. Discuss.: 1 August 2014
Revised: 6 January 2015 – Accepted: 7 January 2015 – Published: 2 February 2015
Abstract. In order to evaluate the impact of human activities (mainly dam building) on the Changjiang River sediment
discharging into the sea, the spatial–temporal variations in
the sediment load of different tributaries of the river were
analyzed to reveal the quantity, grain size and composition
patterns of the sediment entering the sea. The results show
that the timing of reduction in the sediment load of the main
stream of the Changjiang was different from those associated with downstream and upstream sections, indicating the
influences of the sub-catchments. Four stepwise reduction
periods were identified, i.e., 1956–1969, 1970–1985, 1986–
2002, and 2003–2010. The proportion of the sediment load
originating from the Jinsha River continuously increased before 2003; after 2003, channel erosion in the main stream
provided a major source of the sediment discharging into the
sea. In addition, in response to dam construction, although
mean grain size of the suspended sediment entering the sea
did not change greatly with these different periods, the interannual variability for sediment composition or the relative
contributions from the various tributaries changed considerably. Before 2003, the clay, silt and sand fractions of the
river load were supplied directly by the upstream parts of
the Changjiang; after 2003, although the clay component
may still be originating mainly from the upstream areas, the
source of the silt and sand components have been shifted to a
large extent to the river bed erosion of the middle reach of the
river. These observations imply that the load, grain size and
sediment composition deposited over the coastal and shelf
water adjacent to the river mouth may have changed rapidly
recently, in response to the catchment changes.
1
Introduction
Recently, the global sediment flux into the sea has drastically
decreased under the influence of human activities (Vörösmarty et al., 2003; Walling, 2006), resulting in considerable changes in the geomorphology and eco-environment of
estuarine, coastal and continental shelf regions (Syvitski et
al., 2005; Gao and Wang, 2008; Gao et al., 2011). Thus,
the source–sink processes and products of the catchment–
coast system, including those associated with sediment transport pathways from catchment to continental margins under the impact of climate change and human activities, have
received increasing attention (Driscoll and Nittrouer, 2002;
Gao, 2006).
Because marine deposits consist of the materials from different sub-catchments, variations in the sediment characteristics at the deposition site should result from both sediment
load reduction and alterations in sediment grain size, as well
as the proportion of the sedimentary materials from different tributaries (which will be referred to as sediment composition in the present study). With regard to the sediment
load reduction, there have been studies about the impact of
human activities (particularly large hydrologic projects), analyzing long-term variation trends for a number of representative rivers (e.g., Milliman, 1997; Syvitski, 2003; Syvitski
and Saito, 2007; Milliman and Farnsworth, 2011; Yang et
al., 2011). However, less attention has been paid to the variations in the grain size and sediment composition in response
to human activities, as well as to their sedimentological and
environmental consequences. The importance of these two
Published by Copernicus Publications on behalf of the European Geosciences Union.
646
J. H. Gao et al.: Variations in quantity, composition and grain size of Changjiang sediment discharging
Figure 1. The Changjiang catchment and location of the hydrologic stations for the Changjiang catchment. The numeric symbols in the figure
denote some important reservoir sites, including (1) Er’tan, (2) Heilongtan, (3) Tongjiezi, (4) Shengzhong, (5) Baozhushi, (6) Wujiangdu,
(7) Puding, (8) Danjiangkou, (9) Ankang, (10) Zhelin, (11) Wan’an, (12) Dongjiang, (13) Jiangya and (14) Three Gorges Dam.
aspects lies in that they reflect the sediment contribution of
different sub-catchments to the marine deposits and determine the geochemical and sediment dynamic characteristics
(Gao, 2007). Therefore, knowledge about the catchment sediment characteristics for different periods is critical for an
accurate analysis of the sediment source/distribution pattern
over the estuary and coast–continental shelf regions, and for
an improved prediction of the response of the marine sedimentary system to climate change, sea level change and human activities.
The Changjiang is one of the largest rivers in the world.
A part of the sediment from the Changjiang catchment
has formed a large sub-aqueous delta system of around
10 000 km2 (Milliman et al., 1985); the remainder escapes
from the delta, being transported to the Yellow Sea, the East
China Sea and the Okinawa Trough, thereby exerting a considerable impact on the sedimentological and biochemical
conditions of these areas (Liu et al., 2007; Dou et al., 2010).
Recently, the sediment load of the Changjiang into the sea
was reduced considerably in response to dam emplacement
and soil water conservation projects (Yang et al., 2002). Dai
et al. (2008) estimated that the contribution of dam construction and the water and soil conservative measures accounted
for ∼ 88% and 15 ± 5 % of the decline in sediment influx, respectively. The Changjiang catchment consists of numerous
tributaries, which are characterized by different rock properties and climate conditions. On the other hand, the intensity and duration of human activities of these tributaries are
also varied, which leads to different spatial–temporal patterns of the sediment yield of the sub-catchments (Lu et al.,
2003). Thus, the sediment supply of each tributary to the
main stream of the Changjiang also changed with time. Fur-
Hydrol. Earth Syst. Sci., 19, 645–655, 2015
thermore, dam construction and land cover changes also have
an important impact on changes in sediment grain size for
the tributaries and main stream of the Changjiang (Zhang
and Wen, 2004). Therefore, the sediment contribution made
by the different tributaries to the sea-going sediment load,
the grain size and sediment composition may vary at the
same time for the decrease in the total sediment load of the
Changjiang River.
In order to evaluate the impact of human activities (mainly
dam construction) on the quantity, composition and grain
size of the Changjiang sediment discharging into the sea, we
attempt to (1) analyze the effect of dam emplacement on the
sediment load of different tributaries; (2) identify the spatial–
temporal variation patterns of sediment load within the main
stream of the Changjiang associated with dam emplacement;
(3) reveal the quantity, grain size and composition features of
the sea-going sediment during different periods; and (4) delineate the variations in sediment load originating from the
tributaries of the Changjiang for different historical times.
2
Regional setting
The Changjiang, with a drainage basin area of approximately
1.80 × 10⁶ km2 , originates in the Qinghai–Tibet Plateau and
flows 6300 km eastward toward the East China Sea. The
upper reach of the river, from the upstream source to the
Yichang gauging station (Fig. 1), is the major sedimentyielding area of the entire catchment (Shi, 2008). The
main upstream river has four major tributaries, i.e., the
Jinsha, Min, Jialing and Wu rivers. The upper reach region is typically mountainous, with an elevation exceeding
1000 m a.s.l. (above sea level) (Chen et al., 2001). The midwww.hydrol-earth-syst-sci.net/19/645/2015/
J. H. Gao et al.: Variations in quantity, composition and grain size of Changjiang sediment discharging
lower reach extends from Yichang to the Datong gauging
station, with three large inputs joining the main stream in
this section: the Dongting Lake drainage basin, the Hanjiang River, and the Poyang Lake drainage basin. The catchment area of this section mainly comprises alluvial plains
and low hills with elevations of less than 200 m (Yin et al.,
2007). Dongting Lake is the second largest freshwater lake in
China, and part of the main river flow enters Dongting Lake
via five different entrances. Four tributaries enter Dongting
Lake from the south and southwest, and water from Dongting Lake flows into the Changjiang main river channel at
the Chenglingji gauging station (Dai et al., 2008). Dongting Lake was a major sink of the upstream sediment of the
Changjiang and, due to sediment decrease from the upstream
Changjiang, has become a weak sediment source to its downstream sections (Dai and Liu, 2013). Poyang Lake is the
largest freshwater lake in China, and it directly exchanges
and interacts with the river. Poyang Lake receives runoff
from five smaller tributaries (the Gan, Fu, Xin, Rao, and
Xiu rivers) and discharges freshwater into the Changjiang
at Hukou (Shankman et al., 2006). The estuarine reach of
the Changjiang extends from Datong (tidal limit) to the river
mouth. The Datong gauging station is the last station along
the Changjiang before going to the sea, and its hydrological records are often used to derive a representative sediment
flux of the Changjiang into the adjacent East China Sea.
Due to intensified human activities, the catchment forest
vegetation degenerated continuously, with a large-scale reduction of forest cover in the Changjiang catchment (Xu,
2005), resulting in serious deterioration of the ecological environment (Lu and Higgitt, 2000). Starting in the late 1980s,
a major soil conservation campaign was implemented in high
sediment yielding regions of the upper Changjiang catchment. However, due to the highly variable natural conditions of the tributaries, the effect of this campaign was different in every upstream tributary. For example, most of
the Jialing River catchment is characterized by hilly areas,
with the potential for severe slope erosion (Zhang and Wen,
2004), yet its vegetation restoration rate is quite high due
to the humid climate; hence, the effect of vegetation recovery on the reduction of slope erosion is prominent (Lei et
al., 2006). As such, the sediment yield of these parts of the
Jialing River catchment has rapidly decreased since the soil
conservation campaign began in the 1980s (BSWC, 2007).
However, downstream Jinsha River has a different situation.
This section, 782 km in length, is the main sediment yield
area; although its area only accounts for 7.8 % of the upstream Changjiang, the average annual sediment load reaches
35.50 % of the quantity at the Yichang station (Zhang and
Wen, 2004). The high and steep mountains here are characterized by landslides and debris flow, reducing the effect of
vegetation restoration (Lei and Huang, 1991; Yang, 2004).
Therefore, the water and soil erosion prevention scheme
works neither in the Jinsha River nor in the Jialing River
www.hydrol-earth-syst-sci.net/19/645/2015/
647
(BSWC, 2007); in the former case, reservoir interception is
still the dominant factor of the sediment load reduction.
3
Material and method
3.1
3.1.1
Data sources
Water discharge and sediment load data
A long-term discharge and sediment monitoring program for
the entire catchment has been implemented since the 1950s
by the Changjiang Water Resource Commission (CWRC)
under the supervision of the Ministry of Water Resources,
China (MWRC). The monitoring data of each station include
field survey and measurement of water discharge, suspended
sediment concentration, suspended sediment load and suspended sediment grain size, in accordance with China’s national data standards (Ministry of Water Conservancy and
Electric Power, 1962, 1975); 10–30 vertical profiles within
the water column were established for the measurements of
each river cross-section, with the number of profiles varying with the width of the river. For each profile, the flow
velocity are measured (using a direct reading current meter) at different depths (normally at surface, 0.2, 0.6, 0.8 H
and the bottom, where H is the water depth). Meanwhile,
the water mass of these layers is sampled for the measurements of the suspended sediment concentration (using filtration) and grain size (using the suspension settling method).
Such measurements are repeated daily at each station. The
homogeneity and reliability of the hydrological data, with
an estimated daily error of 16 % (Wang et al., 2007), has
been strictly examined by the CWRC before release. The
data for the period of 1956–2001 were either published in
the Yangtze River Hydrological Annals or provided directly
by the CWRC. After 2002, these hydrological data were reported in the Bulletin of China River Sediment published by
the Ministry of Water Resources, China (BCRS, 2002–2010;
available at: http://www.mwr.gov.cn/zwzc/hygb/zghlnsgb/).
We acquired the annual sediment load data from 26 hydrological stations distributed in the main reach and seven of the
tributaries (for the location of these stations, see Fig. 1). The
data set for these gauging stations covers a 55 year period
(i.e., 1956–2010).
3.1.2
Dam data
In the present study, the reservoirs with a storage capacity of greater than 0.01 km3 (i.e., large and medium sized
reservoirs according to the MWRC) are considered. Data
on reservoir emplacement during 1949–2001 were obtained
from the MWRC (2001), and those built during 2002–2007
were obtained from the annual reports published by the
MWRC (http://www.mwr.gov.cn/zwzc/hygb/slbgb/). In total, we counted 1132 large and medium sized reservoirs located within the Changjiang catchment, of which 1037 reserHydrol. Earth Syst. Sci., 19, 645–655, 2015
648
J. H. Gao et al.: Variations in quantity, composition and grain size of Changjiang sediment discharging
voirs are situated upstream of the Datong station (Fig. 1b).
The database includes information on reservoir storage capacity, construction and impoundment time.
In the present study, the reservoir storage capacity index
(RSCI) is defined as the ratio of the reservoir storage capacity to the annual average water discharge of the contributed
catchment; thus, the total RSCI of a catchment is the ratio
of total capacity of reservoir to the annual average water discharge.
3.2
(3)
4.2
k
(1)
i=1
The mean and variance of the normally distributed statistic
dk were defined as
k(k − 1)
,
4
k(k − 1)(2k + 5)
Var [dk ] =
.
72
E [dk ] =
Then, the normalized variable statistical parameter UFk was
calculated as
dk − E [dk ]
,
(4)
UFk = √
var [dk ]
where UFk is the forward sequence. The backward sequence
UBk was obtained using the same equation but with a retrograde sample. The C values calculated with progressive and
retrograde series were named as C1 and C2 . The intersection
point of the two lines, C1 and C2 (k = 1, 2 . . . n) was located within the confidence interval, providing the beginning
of the step change point within the time series. Assuming a
normal distribution at the significant level of P = 0.05, a positive Mann–Kendall statistics C larger than 1.96 indicates a
significant increasing trend, while a negative C value with
an absolute value lower than 1.96 indicates a significant decreasing trend.
Hydrol. Earth Syst. Sci., 19, 645–655, 2015
Stepwise variations in the reservoir storage
capacity of the tributaries
(2)
The Mann–Kendall (M–K) test is a nonparametric method,
which has been used to analyze long-term hydrometeorological temporal series (Mann, 1945; Kendall, 1955).
This test does not assume any distribution form for the data
and is as powerful as its parametric competitors (Serrano
et al., 1999). Trend analysis of the sediment load changes
was conducted based on this method. Before using the M–K
test, the autocorrelation and partial autocorrelation functions
were used to examine the autocorrelation of all the hydrological data. The results indicated that there was no significant autocorrelation in the data. The modified M–K method
was used to analyze variations in the sediment load data:
Xt = (x1 , x2 , x3 . . . xn ), where the accumulative number mi
for samples for which xi > xj (1 ≤ j ≤ i) was calculated, and
the normally distributed statistical variable dk was expressed
as (Hamed and Rao, 1998)
mi .
4.1
Results
The total RSCI values of the seven tributaries and the main
stream of the Changjiang reveal stepwise increasing trends
(Fig. 2). The variations in reservoir storage capacity of the
four upstream tributaries indicated that the total RSCI of the
Min River catchment is low (1.72 % in 2010) and those of
the Jialing and Wu rivers rapidly increased in 1985. In response to the construction of the Er’tan reservoir, the total
RSCI of the Jinsha River also rose considerably in 1998. As
a result of the increase in the reservoir storage capacity of
these four rivers, the total RSCI of the Changjiang catchment,
upstream of the Yichang station with increases of 2.8 % in
1985 and 16.0 % in 2003, also showed the stepwise patterns.
The middle reaches of the Changjiang catchment consisted
of three major tributaries, namely, the Han River, Dongting
Lake and Poyang Lake. The total RSCI of the Han River began to increase in 1966, and greatly rose in 1968. In addition, the rapid increment in the total RSCI of the Poyang and
Dongting lakes were also present in 1972 and 1985, respectively. Generally, as a consequence of dam construction, the
total RSCI of the Changjiang upstream of the Datong greatly
increased in 1969 and 2003.
The changes of the total RSCI and sediment load of the
tributaries and the whole Changjiang catchment indicate that
the stepwise decrease of sediment load is apparently related
to the significant increase of the total RSCI. In the case of the
Yichang and Datong stations, over the last few decades, there
has been a significant negative correlation between average
sediment load and total RSCI at both the Yichang and Datong
stations (Fig. 3), which reflected the impact dams have on the
sediment load.
Analytical methods
dk =
4
Spatial–temporal sediment load variations within
the catchment
The trends, derived on the basis of the M–K method, of sediment load of the seven tributaries (Figs. 4 and 5) indicate that
the downstream sediment load began to decrease earlier than
the upstream sediment load. Due to the sediment load reduction of the Jialing and Wu rivers, the total sediment load of
the four upstream rivers began to decrease in 1984. In the
middle stream of the Changjiang, the sediment load for the
Han River and the Dongting and Poyang lakes began to reduce in 1966, 1984 and 1985, respectively; the M–K trends
of sediment load of the three sub-catchments exhibited significant trends of decrease (at the 95 % confidence level) in
1970, 1995 and 2000, respectively.
Due to the different patterns of sediment load variations
of the seven sub-catchments, there were significant spatial–
temporal differences in the sediment load variations of the
mainstream Changjiang: the sediment load began to decrease
www.hydrol-earth-syst-sci.net/19/645/2015/
J. H. Gao et al.: Variations in quantity, composition and grain size of Changjiang sediment discharging
649
Figure 2. Relationship between the reduction in sediment load (red line) and the total reservoir storage capacity index (green line) in the
tributaries and the main stream. Numeric symbols represent reservoirs listed in Fig. 1.
reduction of upstream and middle-reach tributaries in 1985,
the sediment load of the middle reach of the Changjiang began to further decrease in 1985. The M–K trends of sediment
load of the Datong, Hankou and Yichang stations are associated with a 95 % confidence level in 1989, 1997 and 1996,
respectively.
4.3
Figure 3. The relationship between average sediment load and total
RSCI of different periods at the Yichang and Datong stations.
later at upstream locations than at downstream locations.
The sediment load upstream of the Yichang station began
to reduce in 1985, with a 95 % confidence level for the
year of 1996. Impacted by sediment load decreasing of the
Han River, beginning in 1966, the sediment load reduction
trends of the middle reach (Hankou–Datong stations) were
observed in 1969. Furthermore, as a result of sediment load
www.hydrol-earth-syst-sci.net/19/645/2015/
Stepwise reduction of the sediment load entering
the sea
The M–K trends of sediment load variation at the Datong
station showed that 1969 and 1985 are two critical temporal nodes, reflecting the beginning time of sediment load decrease. While the M–K trends of the sediment load passes
the 95 % confidence test for 1989, another important time
node (2003) is not shown in the M–K trends of sediment
load of the Datong station. Taking into account the great impact of the Three Gorges Dam (TGD) on the sediment load
decrease of the main stream Changjiang (Hu et al., 2011),
the variations of the sediment load entering the sea could be
divided into four stepwise reduction stages, namely, 1956–
1969, 1970–1985, 1986–2002 and 2003–2010.
The variations of sediment load discharging into the sea,
measured at the Datong station, indicated that although the
sediment load of the Datong station, 503 Mt yr−1 on average,
exhibited fluctuations from 1956 to 1969, with the quantity
generally remaining at a high level (Table 1). The Han River
Hydrol. Earth Syst. Sci., 19, 645–655, 2015
650
J. H. Gao et al.: Variations in quantity, composition and grain size of Changjiang sediment discharging
Figure 4. Mann–Kendall trends of the sediment load for the Jinsha, Min, Jialing, Wu, and Han rivers and the Poyang and Dongting lakes
systems. The red bullets and green triangles denote C1 and C2 , respectively. The bold represents the beginning time of sediment load
decreasing, and the italics represent the time when the M–K trends of the sediment load pass the 95 % confidence test.
Figure 5. M–K trends of the sediment load for different gauging stations of the Changjiang main river. The red bullets and green triangles
denote C1 and C2 , respectively. The bold represents the beginning time of sediment load decreasing, and the years in italics denote the time
when the M–K trends of the sediment load pass the 95 % confidence test.
was once the most important sediment source of the middlereach Changjiang (Yin et al., 2007); however, since the annual sediment load supplied by the Han River decreased
by 95 Mt, the sediment load of the Datong station was reduced to 445 Mt in the period of 1970–1985. Previous studies elsewhere have suggested that the sediment load from the
Changjiang entering the sea began to decrease in the 1980s
Hydrol. Earth Syst. Sci., 19, 645–655, 2015
(Yang et al., 2002); however, we would propose that such a
decreasing trend already occurred in as early as 1970, and
the impact of the reduced sediment load of the Han River on
the overall sediment flux of the Changjiang was neglected in
these previous studies. The sediment load for the upstream
Changjiang had a decreasing trend starting in 1985; in terms
of the quantity, there was a reduction from 533 Mt yr−1 dur-
www.hydrol-earth-syst-sci.net/19/645/2015/
J. H. Gao et al.: Variations in quantity, composition and grain size of Changjiang sediment discharging
651
Figure 6. Relationship between the medium grain size of suspended sediments and the sediment load during different periods at the Yichang
and Datong stations. Data are not available for the Datong station in 1968–1970, 1972–1973, and 1975.
ing 1956–1985 to 404 Mt yr−1 during 1986–2002. The seagoing sediment load of the Changjiang became less than
340 Mt yr−1 during this period. With the emplacement of the
TGD in 2003, the sediment load upstream of the Changjiang
decreased to 55 Mt yr−1 during 2003–2010, with the sediment discharge into the sea being around 152 Mt yr−1 (Table 1).
Overall, four stepwise reduction stage periods of the seagoing sediment load were observed, namely, 1956–1969,
1970–1985, 1986–2002 and 2003–2010. Further, the sediment load decrease may be related to sediment load decrease
of different tributaries: the reduction during 1970–1985 was
correlated with the Han River, while the upstream tributaries
(mainly the Jialing and Wu rivers), together with the subcatchment of the middle reach (mainly Poyang Lake), were
responsible for the decrease during 1970–1985. The sediment load decrease during 2003–2010 resulted mainly from
the emplacement of the TGD.
4.4
Variations in the grain size of the sediment entering
the sea
Since most of the coarse-grained sediment is intercepted by
reservoirs, the sediment grain size downstream of the reservoirs becomes significantly finer (Xu, 2005). The variation
in the medium grain size (D50 ) of suspended sediment at
the Yichang station (Fig. 6) indicates that the average value
of D50 was 0.017 mm in 1960–1969, 0.012 mm in 1970–
1985, 0.009 mm in 1986–2002 and 0.004 mm in 2003–2010,
suggesting that the sediment grain size from the upstream
Changjiang exhibited a continuous decreasing trend. In contrast, the decreasing trend of D50 for the Datong station was
not as significant as that of the Yichang station during these
four stages: the average D50 in 1960–1969 (0.12 mm) was
similar to that in 1970–1985 (0.13 mm), with a slight decrease for the year of 2002 (0.09 mm) and for the period of
2003–2010 (0.10 mm).
In addition, the degree of inter-annual variation in the upstream sediment grain size continuously decreased during the
www.hydrol-earth-syst-sci.net/19/645/2015/
Table 1. The mean value of sediment load of the Changjiang main
river during different periods.
Time
1956–1969
1970–1985
1986–2002
2003–2010
Ping Shan
station
Mt yr−1
Yichang
station
Mt yr−1
Hankou
station
Mt yr−1
Datong
station
Mt yr−1
232
226
275
151
547
521
404
55
461
426
331
118
503
445
340
152
four periods at the Yichang station, i.e., the range of D50 variations is gradually narrowed (with a continuously reduced
standard deviation), and the distribution range of the D50
data and sediment load moves towards the side of finer grain
sizes; however, such a change is not so significant at the Datong station (Fig. 6). The sediment grain size variations of
the two stations also indicated that the average value of D50
for the Yichang station was greater than that for the Datong
station in 1960–1969, but the two stations had similar values in 1970–1985 and 1986–2002; after 2003, the average
value of D50 of the Yichang station was smaller than that
of the Datong station. Furthermore, D50 ranged from 0.003–
0.007 mm for the Yichang station and 0.008–0.013 mm for
the Datong station, in 2003–2010, suggesting that the D50
variation range of the two stations did not overlap after 2003.
Compared with previous periods, after 2003, the clay and
silt contents at the Yichang station greatly increased, and the
sand fraction significantly decreased (Fig. 7). At the Datong
station, however, although the sand fraction had no apparent variation trends, the clay content increased, and the silt
content reduced. Furthermore, before 2003, the silt and clay
contents did not differ much between the Yichang and Datong stations, and the sand content at the Yichang station was
slightly greater than that at the Datong station; however, after 2003, the sand content at the Datong station became significantly greater than that at the Yichang station, and the
Hydrol. Earth Syst. Sci., 19, 645–655, 2015
652
J. H. Gao et al.: Variations in quantity, composition and grain size of Changjiang sediment discharging
Figure 7. Distribution of the suspended sediment grain size of the Yichang and Datong stations in 1960–1969, 1970–1985, 2002 and 2003–
2010.
clay content at the Datong station became lower than that
at the Yichang station, implying that the sediment sources
other than the seven tributaries supplied a sand fraction to the
Yichang–Datong section of the Changjiang. This observation
suggests that although the average value of the grain size of
the sediment entering the sea during the different periods did
not alter greatly, the inter-annual variation range, sediment
components and the material sources changed considerably.
5
Discussion
As outlined above, the Changjiang sediment load is influenced by mixing of weathering products supplied by the
different sub-catchments. The spatial–temporal differences
among the sub-catchments, in terms of sediment load variations, caused the sediment load reduction and changes in
the sediment composition. According to the concept of sediment budget (Houben, 2012), the following equation may
be used to calculate the sediment balance of the main stream
Changjiang:
Sinput =
S + Soutput = SJinsha + SMin + SJialing
+ SWu + SHan + SPoyang ,
(5)
where
Sinput is the contribution of the tributaries to the
main stream sediment load, Soutput is the sediment load entering the sea (measured at the Datong station), S is the
quantity of deposited (+)/eroded (−) sediment of the main
Hydrol. Earth Syst. Sci., 19, 645–655, 2015
stream Changjiang and Dongting Lake. Thus, the contribution of the different tributaries to the overall sediment load
can be expressed by
SJialing
SMin
SWu
SHan
SJinsha
+
+
+
+
Soutput Soutput Soutput Soutput Soutput
SPoyang
S
+
−
= 1.
Soutput
Soutput
(6)
The calculated results indicated that (Table 2), in 1956–1969,
the sediment load of the Datong station was mainly originated from the Jinsha, Jialing and Han rivers, with their contributions being 35.0, 24.3 and 19.0 %, respectively. As the
sediment load of the Han River decreased, the Jinsha and
Jialing rivers accounted for 46.7 and 27.6 %, respectively,
in the sediment load at the Datong station during the 1970–
1985 period, whereas the contribution from the Han River
decreased to 5.8 %. During the 1986–2002 period, due to the
reduced sediment yield in the Jialing River, the contribution
of the Jinsha River to the sediment load at the Datong station
further increased to 64.2 % and that of the Jialing River decreased to 15.0 %. The sediment composition changed considerably during the 2003–2010 period due to the TGD emplacement: the sediment proportion due to channel erosion
of the main stream reached 48.3 % and the proportion of the
Jinsha River decreased dramatically to 24.1 %. Furthermore,
both the Jialing and Han rivers only contributed 5.3 % to the
sediment load at the Datong station.
The above analysis indicates that as the sediment load at
the Datong station decreased, although the average sediment
www.hydrol-earth-syst-sci.net/19/645/2015/
J. H. Gao et al.: Variations in quantity, composition and grain size of Changjiang sediment discharging
653
Table 2. The sediment contribution proportion (%) of different tributaries to the sediment load entering the sea of the Changjiang.
River/catchment
1956–1969
1970–1985
1986–2002
2003–2010
35
8.8
24.3
4.4
72.5
19
6.1
2.4
46.7
8.6
27.6
8.2
91.1
5.8
0.9
2.2
64.2
10.1
15
4.5
93.8
2.8
1.1
2.3
24.1
6.1
5.3
2.2
37.7
5.3
48.3
8.7
Jinsha River
Min River
Jialing River
Wu River
The total of the upstream four rivers
Han River
Channel erosion
Poyang Lake
Table 3. Annual quantities of clay, silt, and sand at the Yichang and Datong stations during different periods.
Time period
1960–1969
1970–1985
1986–2002
2003–2010
Clay (Mt yr−1 )
Silt (Mt yr−1 )
Sand (Mt yr−1 )
Yichang
Datong
Yichang
Datong
Yichang
Datong
78
105
128
27
78
86
113
48
297
257
212
25
291
257
174
77
172
159
63
3
134
102
50
27
grain size did not display clearly defined variations, the sediment composition changed considerably. Before 2003, the
four rivers of the upstream Changjiang were the dominating sediment source to the sediment load entering the sea,
and their total contribution was 72.5 % during 1956–1969,
91.1 % during 1970–1985 and 93.8 % during 1986–2002. In
addition, during these periods, the variations in the sediment
composition were mainly determined by the changes in the
sediment contributions of the Jinsha, Jialing and Han rivers;
i.e., with the sequential reduction in the sediment loads of the
Han and Jialing rivers, the proportion of the sediment load
originating from the Jinsha River continuously increased.
However, after 2003, the sediment contribution of the upstream to the sediment load of the Datong station greatly decreased. The middle reach of the Changjiang became one of
the major sinks of the upstream sediment (Yang et al., 2011);
after 2003, channel erosion of the middle-reach main stream
became the most important source of sediment load at the
Datong station.
Apart from the dam interception effect, the soil conservation campaign starting in 1989 and implemented for the high
sediment-yielding regions of the upper Changjiang basin (Hu
et al., 2011) may be another factor accelerating the decreasing trend of the sediment grain size at the Yichang station.
The different grain sizes of the suspended sediment at the
Yichang and Datong stations indicate that the clay, silt and
sand fluxes at the Yichang station were greater than those
at the Datong station during the following periods: 1960–
1969, 1970–1985 and 1986–2002 (Table 3); this implies that
the sediment fractions of clay, silt and sand entering the
sea were mainly originated from the upstream Changjiang,
www.hydrol-earth-syst-sci.net/19/645/2015/
with weak sediment exchange between the water column and
the riverbed. After the emplacement of the TGD in 2003,
the clay, silt and sand fractions originating from the upstream Changjiang decreased dramatically. With regard to
the amount of sediment originating from Poyang Lake and
the Han River to the main stream Changjiang, we may still
use the sediment budget concept, to calculate the balance
for the different sediment fractions for the Yichang–Datong
reach:
SYichang + SHan + SPoyang =
S + Sdatong .
(7)
The calculations show that the eroded sediment of the main
river channel (between Yichang and Datong) and Dongting
Lake contributed 13 Mt yr−1 of clay, 43 Mt yr−1 of silt and
20 Mt yr−1 of sand to the sediment load at the Datong station
in 2003–2010, which accounted for 27.1, 55.8 and 74.1 % of
the corresponding sediment components of the Datong station. Taking into account the eroded sediment supply within
the estuarine areas (Li, 2007), the percentages of the silt
and sand fractions discharging into the sea, due to the material supply by the eroding main river channel, may exceed
55.8 and 74.1 %, respectively. These data imply that the clay
fraction at the Datong station should be originated mainly
from the upstream Changjiang, and the silt and sand fractions
largely consisted of the eroded sediment of the middle-reach
river channel.
Hydrol. Earth Syst. Sci., 19, 645–655, 2015
654
6
J. H. Gao et al.: Variations in quantity, composition and grain size of Changjiang sediment discharging
Conclusions
1. The increment in reservoir storage capacity is significantly correlated with the decrease in the Changjiang
sediment load, which reflected the impact of dams
on the sediment load of the tributaries and the entire
Changjiang catchment.
2. The patterns of sediment delivery from the subcatchments of the Changjiang River have been
changed, with significant spatial–temporal differences
in the sediment load variations of the main stream
Changjiang: four stepwise reduction stages were identified, i.e., 1956–1969, 1970–1985, 1986–2002 and
2003–2010. There was a lag of the decrease in the sediment load at upstream locations compared with those at
downstream locations.
3. Before 2003, the variations in the sediment composition in the marine areas were mainly determined by the
changes in the sediment contribution made by the Jinsha, Jialing and Han rivers. However, after 2003, channel erosion of the main stream Changjiang supplied
around 48.3 % of the sediment load into the sea.
4. In response to dam construction, although mean grain
size of the sediment entering the sea during the different periods did not show clearly defined variations, the
inter-annual variations in terms of the size range, sediment components and source areas changed considerably.
5. Before 2003, the clay, silt and sand fractions entering
the sea were mainly originated from the upstream regions of the river. In contrast, after 2003, the origin of
the clay component of the sediment was dominated by
the upstream areas, while the silt and sand component
were mainly supplied by the eroding bed of the middlereach main channel of the Changjiang River.
Acknowledgements. The study was supported by the National
Basic Research Program of China (grant no. 2013CB956503) and
the Natural Science Foundation of China (grant nos. 41376068
and 41476052).
Edited by: B. McGlynn
Hydrol. Earth Syst. Sci., 19, 645–655, 2015
References
BSWC – Bulletin of soil and water conservation in China: Press
of Ministry of Water Resources of the People’s Republic
of China, http://www.mwr.gov.cn/zwzc/hygb/zgstbcgb/, last access: 30 December 2007.
Chen, Z., Li, J., Shen, H., and Wang, Z. H.: Yangtze River of China:
historical analysis of discharge variability and sediment flux, Geomorphology, 41, 77–91, 2001.
Dai, S. B., Lu, X. X., Yang, S. L., and Cai, A. M.: A preliminary estimate of human and natural contributions to the decline in sediment flux from the Yangtze River to the East China Sea, Quatern.
Int., 186, 43–54, 2008.
Dai, Z. and Liu, J. T.: Impacts of large dams on downstream fluvial
sedimentation: An example of the Three Gorges Dam (TGD) on
the Changjiang (Yangtze River), J. Hydrol., 480, 10–18, 2013.
Dou, Y. G., Yang, S. Y., Liu, Z. X., Clift, P. D., Yu, H., Berne, S., and
Shi, X. F.: Clay mineral evolution in the central Okinawa Trough
since 28 ka: Implications for sediment provenance and paleoenvironmental change, Palaeogeogr. Palaeocl., 288, 108–117, 2010.
Driscoll, N. and Nittrouer, C.: Source to Sink Studies, Marg.
Newslett., 5, 1–24, 2002.
Gao, S.: Catchment-coastal interaction in the Asia-Pacific region,
in: Global change and integrated coastal management: the AsianPacific region, edited by: Harvey, N., Springer, Dordrecht, 67–
92, 2006.
Gao, S.: Modeling the growth limit of the Changjiang Delta, Geomorphology, 85, 225–236, 2007.
Gao, S. and Wang, Y. P.: Changes in material fluxes from the
Changjiang River and their implications on the adjoining continental shelf ecosystem, Cont. Shelf Res., 28, 1490–1500, 2008.
Gao, S., Wang, Y. P., and Gao, J. H.: Sediment retention at the
Changjiang sub-aqueous delta over a 57 year period in response
to catchment changes, Estuar. Coast. Shelf Sci., 95, 29–38, 2011.
Hamed, K. H. and Rao, A. R.: A modified Mann–Kendall trend test
for autocorrelated data, J. Hydrol., 204, 182–196, 1998.
Houben, P.: Sediment budget for five millennia of tillage in the
Rockenberg catchment (Wetterau loess basin, Germany), Quaternary Sci. Rev., 52, 12–23, 2012.
Hu, B. Q., Wang, H. J., Yang, Z. S., and Sun, X. X.: Temporal and
spatial variations of sediment rating curves in the Changjiang
(Yangtze River) basin and their implications, Quatern. Int., 230,
34–43, 2011.
Kendall, M. G.: Rank Correlation Methods, Griffin, London, 1955.
Lei, X. Z. and Huang, L. L.: Discussion of soil erosion mechanism
in some areas of the upper Yangtze River, J. Sichuan Forest. Sci.
Technol., 12, 9–16, 1991.
Lei, X. Z., Cao, S. Y., and Jiang, X. H.: Impacts of soil-water conservation in Jiangling River on sedimentation of the Three Gorges
Reservoir. Journal of Wuhan University, Nat. Sci. Edit., 11, 922–
928, 2006.
Li, L. Y.: The characteristics of water and sediment discharge
and river channel evolution of Datong-Xuliujing section of the
Changjiang, PhD Thesis, Hohai Univ. Nanjing, Nanjing, China,
2007.
Liu, J. P., Xu, K. H., Li, A. C., Milliman, J. D., Velozzi, D. M., Xiao,
S. B., and Yang, Z. S.: Flux and fate of Yangtze River sediment
delivered to the East China Sea, Geomorphology, 85, 208–224,
2007.
www.hydrol-earth-syst-sci.net/19/645/2015/
J. H. Gao et al.: Variations in quantity, composition and grain size of Changjiang sediment discharging
Lu, X. X. and Higgitt, D. L.: Estimating erosion rates on sloping agricultural land in the Yangtze Three Gorges, China, from
caesium-137 measurements, Catena, 39, 33–51, 2000.
Lu, X. X., Ashmore, P., and Wang, J.: Sediment yield mapping in
a large river basin: the Upper Yangtze, China, Environ. Modell.
Softw., 18, 339–353, 2003.
Mann, H. B.: Nonparametric tests against trend, Econometrica, 13,
245–259, 1945.
Milliman, J. D.: Blessed dams or damned dams?, Nature, 388, 325–
326, 1997.
Milliman, J. D. and Farnsworth, K. L.: River Discharge to the
Coastal Ocean: A Global Synthesis, Cambridge Univ. Press,
Cambridge, 2011.
Milliman, J. D., Shen, H. T., Yang, Z. S., and Meade, R. H.: Transport and deposition of river sediment in the Changjiang Estuary
and adjacent continental-shelf, Cont. Shelf Res., 4, 37–45, 1985.
Ministry of Water Conservancy and Electric Power, P. R. C.: National Standards for Hydrological Survey (Vol. 1-3), China Industry Press, Beijing, 1962.
Ministry of Water Conservancy and Electric Power, P. R. C.: Handbook for Hydrological Survey (Vol. 1–3), Water Conservancy
and Electric Power Press, Beijing, 1975.
MWRC – Ministry of Water Resources, China: The code for China
Reservoir name, Chinese Water Conservancy and Hydroelectric
Press, Beijing, 2001.
Serrano, V. L., Mateos, V. L., and García, J. A.: Trend analysis of
monthly precipitation over the Iberian Peninsula for the period
1921–1995, Phys. Chem. Earth B, 24, 85–90, 1999.
Shankman, D., Heim, B. D., and Song, J.: Flood frequency in
China’s Poyang Lake region: trends and teleconnections, Int. J.
Climatol., 26, 1255–1266, 2006.
Shi, C. X.: Scaling effects on sediment yield in the upper Yangtze
River, Geogr. Res., 27, 800–811, 2008.
Syvitski, J. P. M.: Supply and flux of sediment along hydrological
pathways: research for the 21st century, Global Planet. Change,
39, 1–11, 2003.
www.hydrol-earth-syst-sci.net/19/645/2015/
655
Syvitski, J. P. M. and Saito, Y.: Morphodynamics of deltas under the
influence of humans, Global Planet. Change, 57, 261–282, 2007.
Syvitski, J. P. M., Vörömarty, C., Kettner, A. J., and Green, P.: Impact of humans on the flux of terrestrial sediment to the global
coastal ocean, Science, 308, 376–380, 2005.
Vörösmarty, C. J., Meybeck, M., Fekete, B., Sharma, K., Green, P.,
and Syvitski, J. P. M.: Anthropogenic sediment retention: Major global impact from registered river impoundments, Global
Planet. Change, 39, 169–190, 2003.
Walling, D. E.: Human impact on land–ocean sediment transfer by
the world’s rivers, Geomorphology, 79, 192–216, 2006.
Wang, Z. Y., Li, Y. T., and He, Y. P.: Sediment budget
of the Yangtze River, Water Resour. Res., 43, W04401,
doi:10.1029/2006WR005012, 2007.
Xu, J. X.: Variation in grain size of suspended load in upper
Changjiang River and its tributaries by human activities, J. Sediment Res., 3, 8–16, 2005.
Yang, S. L., Zhao, Q. Y., and Belkin, I. M.: Temporal variation in the
sediment load of the Yangtze River and the influences of human
activities, J. Hydrol., 263, 56–71, 2002.
Yang, S. L., Milliman, J. D., Li, P., and Xu, K.: 50,000 dams
later: Erosion of the Yangtze River and its delta, Global Planet.
Change, 75, 14–20, 2011.
Yang, Z. S.: Soil erosion under different landuse types and zones of
Jinsha River Basin in Yunnan Province, China, J. Mount. Sci., 1,
46–56, 2004.
Yin, H. F., Liu, G. R., Pi, J. G., Chen, G. J., and Li, C. G.: On the
river-lake relationship of the middle Yangtze reaches, Geomorphology, 85, 197–207, 2007.
Zhang, X. and Wen, A.: Current changes of sediment yields in
the upper Yangtze River and its two biggest tributaries, China,
Global Planet. Change, 41, 221–227, 2004.
Hydrol. Earth Syst. Sci., 19, 645–655, 2015


© Copyright 2026