
PDF (3.03 MB)
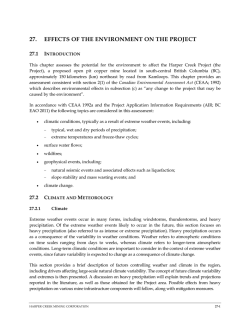
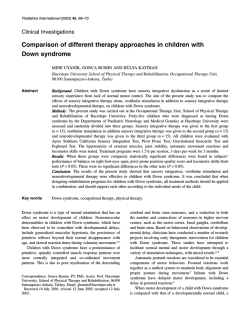
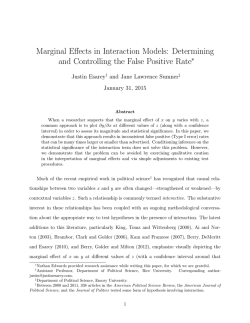
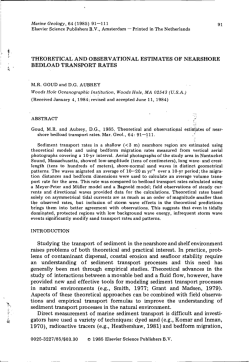
Home
Search
Collections
Journals
About
Contact us
My IOPscience
Changes in observed climate extremes in global urban areas
This content has been downloaded from IOPscience. Please scroll down to see the full text.
2015 Environ. Res. Lett. 10 024005
(http://iopscience.iop.org/1748-9326/10/2/024005)
View the table of contents for this issue, or go to the journal homepage for more
Download details:
IP Address: 136.243.24.42
This content was downloaded on 06/02/2015 at 14:58
Please note that terms and conditions apply.
Environ. Res. Lett. 10 (2015) 024005
doi:10.1088/1748-9326/10/2/024005
LETTER
Changes in observed climate extremes in global urban areas
OPEN ACCESS
Vimal Mishra1,2,3, Auroop R Ganguly3, Bart Nijssen2 and Dennis P Lettenmaier2,4
RECEIVED
31 July 2014
1
2
ACCEPTED FOR PUBLICATION
3
23 December 2014
4
PUBLISHED
29 January 2015
Civil Engineering, Indian Institute of Technology(IIT), Gandhinagar, India
Civil and Environmental Engineering, University of Washington, Seattle, USA
Civil and Environmental Engineering, Northeastern University, Boston, USA
Department of Geography, University of California, Los Angeles, USA
E-mail: [email protected]
Keywords: urban areas, climate extremes, heat wave, precipitation extremes
Content from this work
may be used under the
terms of the Creative
Commons Attribution 3.0
licence.
Any further distribution of
this work must maintain
attribution to the author
(s) and the title of the
work, journal citation and
DOI.
Supplementary material for this article is available online
Abstract
Climate extremes have profound implications for urban infrastructure and human society, but studies
of observed changes in climate extremes over the global urban areas are few, even though more than
half of the global population now resides in urban areas. Here, using observed station data for 217
urban areas across the globe, we show that these urban areas have experienced significant increases (pvalue <0.05) in the number of heat waves during the period 1973–2012, while the frequency of cold
waves has declined. Almost half of the urban areas experienced significant increases in the number of
extreme hot days, while almost 2/3 showed significant increases in the frequency of extreme hot
nights. Extreme windy days declined substantially during the last four decades with statistically significant declines in about 60% in the urban areas. Significant increases (p-value <0.05) in the frequency of daily precipitation extremes and in annual maximum precipitation occurred at smaller
fractions (17 and 10% respectively) of the total urban areas, with about half as many urban areas
showing statistically significant downtrends as uptrends. Changes in temperature and wind extremes,
estimated as the result of a 40 year linear trend, differed for urban and non-urban pairs, while changes
in indices of extreme precipitation showed no clear differentiation for urban and selected non-urban
stations.
1. Introduction
For the first time, more than half of the global
population resides in urban areas (Grimm et al 2008),
a number that is expected to increase to 60% by 2030,
and 70% by 2050 (World Health Organization 2014).
Between 1900 and 2000, the number of urban areas
with more than one million population increased from
17 to 388 (Millennium Ecosystem Assessment 2003).
Urban areas are centers of wealth, human population,
and built infrastructure and are considered by some to
be ‘first responders’ to climate change (Rosenzweig
et al 2010). Moreover, cities are the fundamental units
for climate change mitigation and adaptation (Georgescu et al 2014).
Climate variability and change can exert profound
stresses on urban environments, which are sensitive to
heat waves, droughts, and changes in the frequency
and magnitude of flash floods (Rosenzweig et al 2011).
© 2015 IOP Publishing Ltd
Temperature-related climate extremes have been
shown to be strongly related to human health (Patz
et al 2005, Hayhoe et al 2010, Hondula et al 2014).
Extreme precipitation events, which are projected to
increase in a warming climate (Allen and Ingram 2002,
O’Gorman and Schneider 2009, Min et al 2011a),
cause disproportionate damage to urban transportation systems, and pose challenges to urban stormwater
drainage systems (Schreider et al 2000, Rosenberg
et al 2010, Mishra et al 2012a). In the recent past, flood
disasters have affected many large urban areas including Bangkok (2011), Brisbane (2011), Guangdong
(2007), Mumbai (2005), and Dresden (2002)
(Liao 2012). In addition to temperature and precipitation extremes, extreme wind storms can cause enormous damage to urban areas (Munich Re 1999, Swiss
Re 2001).
Despite the potentially large and costly damages
from climate extremes in urban areas, most
Environ. Res. Lett. 10 (2015) 024005
V Mishra et al
observation-based studies have focused on large spatial extents (i.e. national, regional, or continental)
(Easterling et al 2000, Zhang et al 2005, Alexander et al
2006, Min et al 2011, Donat et al 2013). For instance,
Donat et al (2013) analyzed trends in climatic
extremes using a gridded dataset, but did not evaluate
changes in extreme events in urban areas specifically.
Studies that address climate extremes in global urban
areas and disparities in urban and non-urban areas
have been far fewer (Ashley et al 2005, Hallegatte
et al 2007). This may be in part because of complications in obtaining high quality observations from station data or developing gridded datasets using stations
within the vicinity of urban areas (Mishra and Lettenmaier 2011). Many studies have shown the influence
of urbanization on meteorological forcing (Zhang
et al 2009, Kishtawal et al 2010, Shepherd
et al 2010a, 2010b, Chen et al 2011), which is not the
focus of this work. Here we analyze observed changes
in climate extremes in global urban areas during the
last four decades (1973–2012) using daily data from
selected Global Summary of the Day (GSOD) stations.
We hypothesize that globally, observed climate changes in urban areas, notwithstanding major land use/
cover change over the last 40 years, are dominantly due
to large scale changes, rather than local land cover. We
report changes in daily temperature and precipitation
extremes as well as changes in the frequency of
extreme windy days in 217 urban areas across the
globe. Moreover, we discuss disparities in changes in
climate extremes in 142 paired urban and non-urban
stations.
2. Analysis approach
We obtained daily observations for precipitation, air
temperature (mean, maximum, and minimum), and
mean wind speed from the GSOD data produced by
the National Climatic Data Center (NCDC). GSOD
data are quality controlled by NCDC through automated quality checks. Most random errors are
removed and further corrections are applied to control
for changes in instrumentation, station moves, and
changes in time of observation (ftp://ftp.ncdc.noaa.
gov/pub/data/gsod/readme.txt, accessed on 1 December 2013). The GSOD data are updated on a near realtime basis with a lag of 1–2 days. Historical data are
available from 1929; however, we selected the period
1973–2012 for analysis as this period has the largest
number of relatively complete and consistent records.
Further details on the GSOD data can be obtained
from the website http://www.climate.gov/globalsummary-day-gsod.
We identified all urban areas globally (about 650)
with population greater than 250 000 using the ESRI
Arc-GIS shapefile (ESRI 2008, http://www.baruch.
cuny.edu/geoportal/data/esri/esri_intl.htm, assessed
on 20 November 2013) and selected GSOD station(s)
2
located within 25 km of these urban areas. GSOD
records for these stations were checked for record
length and missing values. Our selection of urban
areas based on population was further verified with
urban extent derived using the MODIS data (Schneider et al 2009). Schneider et al (2009) identified urban
areas as built environments including non-vegetative
and human constructed elements. They were identified using supervised classification of MODIS 1 km
land cover data (see Schneider et al (2009) for details).
This comparison shows that urban areas selected
based on population fall within the urban extents
derived using the satellite based dataset (figures S9–
S14). We removed all stations that had one or more
years of missing data or more than 10% missing values
in any year during the period of 1973–2012. After
identifying candidate stations based on the proximity
criteria, and applying the quality checks, we were left
with 217 stations (table S2) with relatively complete
records for the period 1973–2012, most of which were
located at airports close to urban areas (see supplemental table S1, available at stacks.iop.org/ERL/10/
024005/mmedia). Furthermore, about 90% of the stations are within 15 km of the center of the urban area
they represent.
We analyzed daily extremes for temperature, precipitation (24 h totals), and wind. For temperature
extremes, we analyzed heat and cold waves as well as
extreme hot days and nights. Heat waves were defined
as periods during which the daily maximum temperature stayed above (below) the empirical 99th-percentile (estimated for the period 1973–2012)
consecutively for six or more days. Similarly cold
waves were identified using daily minimum temperatures. The frequency of extreme hot days was estimated using the 99th-percentile of daily maximum
temperatures, also for the period 1973–2012. The frequency of extreme hot nights was identified using the
99th percentile of daily minimum temperatures. For
precipitation extremes, annual maximum precipitation, frequency of precipitation extremes, and fraction
of total precipitation occurring due to extreme events
were estimated for each year during the period of
1973–2012. Annual maximum precipitation was
defined as the maximum daily precipitation in each
year. To estimate the frequency of extreme precipitation events, we used the 95th-percentile of daily precipitation for rain days (precipitation >1 mm d−1)
during the 1973–2012 reference period. We selected
the 95th percentile threshold for extreme precipitation
events because the 99th percentile threshold leads to
some years without extreme precipitation events,
which makes detection of trends difficult. We carefully
evaluated the influence of the selection of specific
thresholds on trends of extreme precipitation events
and found that the nature of the trends remains the
same with a higher or lower threshold. The number of
days with precipitation greater than or equal to the
95th-percentile was used as an index for extreme
Environ. Res. Lett. 10 (2015) 024005
V Mishra et al
precipitation in each year. The fractional contribution
from the extreme precipitation events to the total precipitation for each year was computed using the same
95th-percentile threshold. Extreme windy days were
defined as days with a daily mean wind speed that
exceeded the 99th-percentile threshold of daily mean
wind speed.
We estimated changes in each of the statistics
using the non-parametric Mann–Kendall (Mann
1945) trend test and Sen’s slope method (Sen 1968).
The Mann–Kendall method has been widely used for
trend detection in hydrologic and climate data (Mishra and Lettenmaier 2011, Yue and Wang 2002). We
also computed field significance (Livezey and Chen
1983) using the method described in Yue and Wang
(2002). The statistical significance of changes in the
mean and distribution was tested using the two sided
Ranksum and Kolmogorov and Smirnov (KS)(Massey
1951) tests, respectively at 5% significance level. We
divided the 217 locations into six regions based on the
number of stations in each region (figure 1(a)): Africa
(AF), East Asia (EA), Europe (EU), India (IN), North
America (NA), and South America (SA) and applied
the field significance test on a regional basis. Changes
in climatic extremes were estimated by multiplying the
linear trend obtained from the Mann–Kendall test
with the length of the analysis period (i.e. 40 years).
To understand differences in precipitation and
temperature extremes, we identified paired urban and
non-urban stations based on population density as
described in Mishra and Lettenmaier (2011). We
obtained the gridded population density (1 km spatial
resolution) from the Global Urban–Rural Mapping
Project (GURMP v3) for the year 2000 from the CIESIN’s web site (http://sedac.ciesin.columbia.edu/gpw/
global.jsp, accessed on 8 December 2013). Stations
with population density less (more) than 200 (500)
person/km2 were identified as non-urban (urban) stations. We successfully verified urban and non-urban
pairs based on urban extents derived from MODIS
(figure S15). Zhou et al (2013) reported the influence
of spatial clustering of stations on urban-heat island
effect; however, our aim was to find out disparities in
trends between stations located in urban and paired
non-urban areas. We identified 142 urban and nonurban station pairs with median population densities
2540 and 99 persons/km2, respectively. For each urban
station (out of 142), a non-urban station (based on the
quality and completeness of the dataset) was selected
using distance thresholds of 50, 75, 100, 125, 150, and
200 km from the urban station location. We excluded
non-urban pairs that exceeded the 200 km threshold
to avoid large changes in climate and topography. As
much as possible, we selected pairs that are not affected by geographical disparities associated with elevation, location, and climate. However, to avoid these
differences entirely, the station density in urban and
non-urban areas needs to be greatly improved.
3
3. Results
3.1. Changes in temperature extremes
Figure 1 shows changes in heat and cold waves globally
during the reference period (1973–2012). Because heat
and cold waves do not occur every year, we evaluated
changes using the pooled data, where mean heat waves
for each year were estimated for all the urban areas in a
given region. Pooled time series of global urban areas
showed statistically significant increases in the number
of heat waves per urban area during the last four
decades (change = 0.32 heat waves per urban area
during the reference period, p < 0.05 on normalized
data; figure 1(b)). During the last 40 years, the five
years with the largest number of heat waves (aggregated over all regions) were 1998, 2009, 2010, 2011,
and 2012. Taken over all 217 stations, the average
number of heat waves by decade exhibited a consistent
increase with the highest number of heat waves
occurring during the most recent decade (2003–2012;
figure 1(c)). Figure 1(d) shows that the frequency of
cold waves generally declined. For instance, the pooled
cold waves showed a statistically significant (p-value
<0.05) decline of 0.16 cold waves per urban area
during the reference period. The five years with the
largest number of cold waves were 1973, 1974, 1976,
1981, and 1983. The average number of cold waves by
decade declined until 1993–2002, followed by a slight
increase in the number of cold waves during the most
recent decade (2003–2012). Median changes over all
sites showed increases in heat waves and declines in
cold waves (figures 1(f) and (g)). Increases in heat
waves were field significant for AF, EA, EU, and NA.
Increases in IN and SA were not field significant
(figure 1(f)). Field significant decreases in cold waves
were found in NA (figure 1(g)), however, decreases in
cold waves in EU were not field significant. No
statistically significant trends in the number of cold
waves were detected in the remaining regions.
Changes in the frequency of extreme hot days
(above 99th-percentile) are shown in figure 2. During
the reference period, the number of extreme hot days
increased significantly at many sites (figure 2(a)).
However, a few urban areas located in EA showed significant declining trends. About 48% of the sites
showed statistically significant increases (figure 2(b)).
On the other hand, fewer than 2% of the total urban
areas experienced significant declines in the frequency
of extreme hot days. Median increases of eight days in
the frequency of extreme hot days were found for
urban areas with statistically significant uptrends
(figure 2(c)). Moreover, all regions showed field significance for increases in the frequency of extreme hot
days (figure 2(d)) with median change (estimated
using average linear trend multiplied by 40 years) ranging from three to nine days between 1973 and 2012.
Similar to increases in the number of extreme hot
days, the number of extreme hot nights (estimated
from daily minimum temperature data) increased
Environ. Res. Lett. 10 (2015) 024005
V Mishra et al
Figure 1. (a) Location of the selected urban areas (sites) and their population range, (b) pooled (over all stations) estimates of average
number of heat waves per station per year over the reference period 1973–2012, (c) decadal variation in pooled estimates (over all
sites) of average number of heat waves per year, (d) pooled estimates of average number of cold waves per year, (e) decadal variation in
pooled estimates of average number of cold waves per year, (f) median change in pooled number of heat waves per year by region and
globally (GL). In panels f and g solid bars represent field significant changes (at 5% significance level); open bars indicate lack of field
significance.
significantly in a majority of urban areas across the
globe (supplemental figure S1(a)). About 63% of the
urban areas experienced statistically significant
increase in the frequency of hot nights (figure S1(b)).
Between 1973 and 2012, a median increase of ten hot
4
nights was found in urban areas that showed significant increases (figure S1(c)). Increases in the number of hot nights were field significant in all the regions
except for IN (figure S1(d)). Along with temperature
extremes, a significant warming in mean temperature
Environ. Res. Lett. 10 (2015) 024005
V Mishra et al
Figure 2. (a) Changes in frequency (number) of extreme hot days per year (exceeding 99th percentile for the reference period
1973–2002), (b) percentage of sites showing positive (hollow red), significantly positive (solid red), negative (hollow blue), and
significantly negative (solid blue) changes in extreme hot days per year, (c) median changes in frequency of extreme hot days per year
(increasing non-significant open red; significantly increasing solid red; decreasing non-significant open blue; significantly decreasing
solid blue), (d) median changes in extreme hot days by region; solid bars in (d) represent field significant trends; open bars are not field
significant. In (a) positive (negative) and significantly positive (negative) changes are shown with red (blue) and filled red (blue)
circles, respectively. Changes and their statistical significance (at 5% level) were estimated using the Mann–Kendall trend test.
was found at a majority of urban areas across all seasons (figure S6). Moreover, a majority of the selected
urban areas experienced significant changes in both
mean and distribution of mean annual temperature
estimated using the two-sided Ranksum and KS tests,
respectively (figure S7). The majority of urban areas
showed changes in both the mean and distribution of
mean annual air temperature rather than just the distribution (figure S7).
3.2. Changes in extreme windy days
Figure 3 shows changes (linear trend multiplied by the
duration (40 years)) in the frequency of extreme windy
days. The majority of sites experienced a significant
(p < 0.05) decline in the number of extreme windy
days during the last four decades (figure 3(a)). However, in each region a few sites showed increases. About
75% of the total urban areas showed significant
declines in number of extreme windy days
(figure 3(b)). On the other hand, statistically significant increases in extreme windy days occurred for less
5
than 10% of the sites. Between 1973 and 2012, median
declines in the number of extreme windy days were
about 20 days for urban areas with statistically
significant changes (figure 3(c)). In all the regions
except SA, results were field significant for declines in
extreme windy days with the median ranging between
5 and 25 days during the period of 1973–2012. Our
results also showed statistically significant declines in
mean wind speed at many sites, which is consistent
with trends in mean wind speed at the 925 mb level
from the NCEP-NCAR reanalysis (figure S5). Moreover, these results are consistent with the findings of
Vautard et al (2010) who reported declines in wind
speed in continental areas with higher reductions in
strong winds than in weaker winds.
3.3. Changes in extreme precipitation
We evaluated changes in the frequency of precipitation
extremes for the period of 1973–2012 (figure S22). In
contrast to temperature related extremes, changes in
precipitation extremes exhibited greater spatial
Environ. Res. Lett. 10 (2015) 024005
V Mishra et al
Figure 3. (a) Changes in frequency (number) of extreme windy days per year (exceeding 99th percentile of the reference period
(1973–2012). (b) Percentage of sites with positive (hollow red), significantly positive (solid red), negative (hollow blue), and
significantly negative (solid blue) changes, (c) median changes in frequency (number) of extreme hot days per year for sites with
positive, significantly positive, negative, and significantly negative changes. (d) Median changes in extreme hot days by region. Solid
bars in (d) represent field significant trends; hollow bars indicate lack of field significance. In (a) positive (negative) and significantly
positive (negative) changes are shown with red (blue) and filled red (blue) circles, respectively. Changes and their statistical
significance (at 5% level) were estimated using the Mann–Kendall trend test.
variability (figures S22(a), S2(a), S3(a)). A number of
sites in IN and SA showed statistically significant
increases in the frequency of precipitation extremes,
but most sites elsewhere did not experience statistically
significant changes in the number of extreme precipitation events. Taken over all sites, 17% showed a
statistically significant increase and less than 5%
showed a statistically significant decrease (figure S22
(b)). Median changes in the number of extremes for
sites with significant increases and declines were about
the same (5% in both cases, figure S22(c)). Increases in
the frequency of extreme precipitation events were
field significant for only two regions (IN and SA; figure
S22(d)).
Many urban areas in EU experienced significant
declines (estimated using linear trend multiplied by
40) in annual maximum precipitation over the reference period (figure S2(a)). On the other hand, a few
urban areas in IN showed increases in annual maximum precipitation, which is associated with large
scale climate variability (Ali et al 2014). More sites had
6
declines in annual maximum precipitation than
increases (figure S2(b)), while about the same number
(10%) showed statistically significant increases and
decreases. The median over sites in AF, IN, NA, and
SA showed positive median changes, whereas EA and
EU showed negative median changes in annual maximum precipitation (figure S2(d)). EU showed a field
significant decline in annual maximum precipitation,
whereas changes were not field significant for any
other region. These results showing declines or increases in annual maximum precipitation are based on a
relatively small number of stations primarily located in
the urban areas. Therefore, results based on gridded
datasets over large areas of EU or IN for instance (e.g.
Alaxender et al (2006) and Goswami et al (2006)) may
be different from those reported here. Moreover, disparities in trends in different regions can be due to
large scale climate variability. For instance, IN receives
most of its annual precipitation during the monsoon
(JJAS) season, which is strongly associated with sea
surface temperature in the Pacific and Indian Ocean
Environ. Res. Lett. 10 (2015) 024005
V Mishra et al
Figure 4. (a), (b) Change in frequency (number) of hot days (above 95th percentile) for urban and paired non-urban areas for the
period of 1973–2012, (c), (d) same as (a), (b) but for frequency of extreme windy days (above 95th percentile), (e) box plots showing
changes in frequency of hot days in all urban and non-urban areas, and (f) same as (e) but for changes in extreme windy days. In (e), (f)
numbers in red (blue) show urban/non-urban areas with positive (negative) changes while numbers in parenthesis show number of
urban/non-urban areas with significant changes.
regions (Goswami et al 2006, Mishra et al 2012b). On
the other hand, European climate is strongly associated with western circulation which transports moist
air from Atlantic to the European Land mass (van
Ulden and van Oldenborgh 2006).
Changes in the fraction of total precipitation contributed by extreme precipitation events were largely
similar to those for annual maximum precipitation
(figure S3). Field significant declines occurred for EU,
while none of the other regions showed field significance. Precipitation extremes are more variable in
space and time than are temperature extremes. For
instance, Coumou and Rahmstorf (2012) reported
that statistical detection of precipitation extremes
remains a challenge due to their non-Gaussian behavior and localized spatial scales. Longer precipitation
records in urban areas may provide more insights on
changes in extreme precipitation events and their links
with climate variability.
3.4. Changes in urban and non-urban pairs
Figure 4 shows changes in the number of hot days and
extreme windy days estimated using linear trend
multiplied by the duration of 40 years for urban and
non-urban pairs. Both urban and non-urban pairs
experienced significant increases in the number of hot
7
days during the last four decades (figures 4(a) and
(b)). However, stations located in non-urban areas
showed somewhat lower increases in the number of
hot days than those located in urban areas. Differences
in changes in the number of hot days in urban and
non-urban areas due to the urban heat island effect
have been reported in many previous studies
(Stone 2007, Stewart and Oke 2012). Out of the 142
pairs, 72 (62) urban (non-urban) areas showed
statistically significant increases in number of hot days
(figure 4(e)). A majority of urban and non-urban pairs
showed declines in extreme windy days; however,
stations located in eastern Asia, EU, and eastern
United States showed differences in direction and
magnitude of changes (figures 4(c) and (d)). Out of
the 142 pairs, statistically significant declines occurred
at 88 (64) urban (non-urban) stations, respectively
(figure 4(f)). Fortuniak et al (2006) studied urban–
rural contrasts in meteorological variables in Poland
and found that wind speed at urban stations was lower
by 39 and 34% during day and night-time, respectively. Differences in wind speed in urban and nonurban pairs can be associated with land surface
conditions as well as localized meteorological conditions as reported in Fortuniak et al (2006) and Vautard
et al (2010).
Environ. Res. Lett. 10 (2015) 024005
V Mishra et al
Changes in annual maximum precipitation and
frequency of precipitation extremes for urban and
non-urban pairs are compared in supplemental figure
S8. Changes in extreme precipitation for urban and
non-urban stations show no statistically significant
difference. For instance, mixed changes were observed
in annual maximum precipitation and frequency of
extreme precipitation events for both urban and nonurban stations located in NA, EU, and EA (supplemental figures S8 (a) and (b)). Moreover, the number
of urban/non-urban areas with significant increases/
declines in annual maximum precipitation and frequency of precipitation extremes were similar (supplemental figures S8 (e) and (f)).
4. Conclusions
Many urban areas across the globe experienced
statistically significant increases in the number of heat
waves during the reference period 1973–2012. Taken
over all sites, the largest number of heat waves has
occurred during the most recent decade (2003–2012).
Moreover, four of the five years with the largest
number of heat waves are the last four years of the
record (2009, 2010, 2011, and 2012). Many sites also
experienced statistically significant declines in the
number of cold waves. Statistically significant
increases in the frequency of hot days and nights were
detected at many sites, with almost half (48%) having
statistically significant increases in the number of hot
days, and almost 66% having statistically significant
increases in the number of hot nights. Trends related
to temperature related extremes are consistent with
the findings of Donat et al (2013) who reported
significant increases in heat waves and hot nights
across the globe. Changes in temperatures extremes
are largely driven by changes in both mean and
distribution of air temperature (figure S7). Increasing
and declining trends in temperature extremes may be
associated with natural climate variability, anthropogenic climate warming, and land use/land cover
(Kiktev et al 2003, Alexander et al 2009, Min et al
2011b, Avila et al 2012, Coumou and Rahmstorf 2012).
Here we simply report the aggregate effect on urban
extremes and have not attempted to quantify their
separate contributions.
The frequency of extreme windy days declined significantly in a majority of the urban areas, with almost
60% of the sites having statistically significant declines.
All regions except SA were field significant for declines
in the frequency of extreme windy days. Results from
station data for extreme windy days are consistent with
the NCEP-NCAR reanalysis data (figure S5). Declining trends in wind speed have been noticed in many
studies (Vautard et al 2010, Guo et al 2011, McVicar
et al 2012, Troccoli et al 2012) and have been largely
attributed to changes in atmospheric circulation and
8
changes in land surface roughness driven by land
cover changes.
As compared with the prevalence of changes in
indices related to extreme temperature and wind, precipitation extremes had statistically significant changes at far fewer sites, with only 17 and 10% of the sites
experiencing statistically significant increases in the
frequency of extreme precipitation events and annual
maximum precipitation, respectively. Many previous
studies demonstrated that climate warming will lead
to more precipitation extremes (Christensen and
Christensen 2003, Gutowski et al 2010, Min et al
2011c), however, consistent with the findings of Donat
et al (2013), we found heterogeneous trends associated
with extreme precipitation events. There were many
urban areas with no trend in extreme precipitation
events which highlights challenges in detection of
trends related to extremes as described in Coumou
and Rahmstorf (2012).
Urban and non-urban pairs showed disparate
changes for temperature and wind related extremes
(generally more increases in temperature-related
extremes, and more decreases in wind-related
extremes in urban as compared to non-urban stations), and hence appear to be counter to our overall
hypothesis that large scale climate drivers dominate
changes in climate extremes. However, precipitationrelated extremes were similar at urban and non-urban
pairs, suggesting a prominent role of large scale climate variability, consistent with our overarching
hypothesis. However, for a few regions (i.e. EU and
EA), differences in land cover and local factors appear
to be important contributors to observed changes in
wind and temperature related extremes. As compared
with results of a similar analysis for the conterminous
US (Mishra and Lettenmaier 2011), larger disparities
in temperature extremes in urban and non-urban
areas can be attributed to record length of the data as
well as lesser number of stations available in nonurban regions.
Our results have important implications for policy
makers. For instance, increasing numbers of heat
waves may lead to enhanced heat wave related mortality in urban areas (Coumou and Robinson 2013, Li
et al 2013). Increased warming in urban areas will also
have implications on residential heating and cooling
demands (Frank 2005). Increases in precipitation
extremes in urban areas will pose challenges for urban
stormwater infrastructure. These implications argue
for the importance of enhancing the density of climate
stations in urban and surrounding non-urban areas to
provide the baseline data that will be essential for climate change adaptation and decision making.
Acknowledgments
The data used in this manuscript can be obtained from
Global Summary of the Day (GSOD) version 8,
Environ. Res. Lett. 10 (2015) 024005
V Mishra et al
National Climatic Data Center (ftp://ftp.ncdc.noaa.
gov/pub/data/gsod/). The first author acknowledges
partial funding from the Varahamihir Earth Science
Fellowship and Expedition program funded by NSF
(grant number 1029166)
References
Alexander L V, Uotila P and Nicholls N 2009 Influence of sea surface
temperature variability on global temperature and precipitation extremes J. Geophys. Res. Atmos. 114 D18116
Alexander L V et al 2006 Global observed changes in daily climate
extremes of temperature and precipitation J. Geophys. Res.
Atmospheres 1984−2012 111(D5)
Ali H, Mishra V and Pai D S 2014 Observed and projected urban
extreme rainfall events in India J. Geophys. Res. Atmos. 119
12621–41
Allen M R and Ingram W J 2002 Constraints on future changes in
climate and the hydrologic cycle Nature 419 224–32
Ashley R M, Balmforth D J, Saul A J and Blanskby J D 2005 Flooding
in the future predicting climate change, risks and responses in
urban areas Water Sci. Technol. Assoc. Water Pollut. Res. 52
265–73
Avila F B, Pitman A J, Donat M G, Alexander L V and Abramowitz G
2012 Climate model simulated changes in temperature
extremes due to land cover change J. Geophys. Res. Atmos. 117
D04108
Chen F, Kusaka H, Bornstein R, Ching J, Grimmond C S B,
Grossman-Clarke S, Loridan T, Manning K W, Martilli A and
Miao S 2011 The integrated WRF/urban modelling system:
development, evaluation, and applications to urban environmental problems Int. J. Climatol. 31 273–88
Christensen J H and Christensen O B 2003 Climate modelling:
severe summertime flooding in Europe Nature 421 805–6
Coumou D and Rahmstorf S 2012 A decade of weather extremes
Nat. Clim. Change 2 491–6
Coumou D and Robinson A 2013 Historic and future increase in the
global land area affected by monthly heat extremes Environ.
Res. Lett. 8 034018
Donat M G, Alexander L V, Yang H, Durre I, Vose R, Dunn R J H,
Willett K M, Aguilar E, Brunet M and Caesar J 2013 Updated
analyses of temperature and precipitation extreme indices
since the beginning of the twentieth century: the HadEX2
dataset J. Geophys. Res. Atmos. 118 2098–118
Easterling D R, Meehl G A, Parmesan C, Changnon S A,
Karl T R and Mearns L O 2000 Climate extremes: observations, modeling, and impacts Science 289 2068–2074
Fortuniak K, Kłysik K and Wibig J 2006 Urban–rural contrasts of
meteorological parameters in Łódź Theor. Appl. Climatol. 84
91–101
Frank T 2005 Climate change impacts on building heating and
cooling energy demand in Switzerland Energy Build. 37
1175–85
Georgescu M, Morefield P E, Bierwagen B G and Weaver C P 2014
Urban adaptation can roll back warming of emerging
megapolitan regions Proc. Natl Acad. Sci. USA 111 2909–14
Goswami B N, Venugopal V, Sengupta D, Madhusoodanan M S and
Xavier P K 2006 Increasing trend of extreme rain events over
India in a warming environment Science 314 1442–5
Grimm N B, Faeth S H, Golubiewski N E, Redman C L, Wu J,
Bai X and Briggs J M 2008 Global change and the ecology of
cities Science 319 756–60
Guo H, Xu M and Hu Q 2011 Changes in near-surface wind speed in
China: 1969–2005 Int. J. Climatol. 31 349–58
Gutowski W J Jr, Arritt R W, Kawazoe S, Flory D M, Takle E S,
Biner S, Caya D, Jones R G, Laprise R and Leung L R 2010
Regional extreme monthly precipitation simulated by NARCCAP RCMs J. Hydrometeorol. 11 1373–9
Hallegatte S, Hourcade J-C and Ambrosi P 2007 Using climate
analogues for assessing climate change economic impacts in
urban areas Clim. Change 82 47–60
9
Hayhoe K, VanDorn J, Croley T II, Schlegal N and Wuebbles D 2010
Regional climate change projections for Chicago and the US
Great Lakes J. Gt. Lakes Res. 36 7–21
Hondula D M, Vanos J K and Gosling S N 2014 The SSC: a decade of
climate–health research and future directions Int. J. Biometeorol. 58 109–20
Kiktev D, Sexton D M, Alexander L and Folland C K 2003
Comparison of modeled and observed trends in indices of
daily climate extremes J. Clim. 16 3560–71
Kishtawal C M, Niyogi D, Tewari M, Pielke R A and Shepherd J M
2010 Urbanization signature in the observed heavy rainfall
climatology over India Int. J. Climatol. 30 1908–16
Liao K-H 2012 A theory on urban resilience to floods–a basis for
alternative planning practices Ecol. Soc. 17 48
Li T, Horton R M and Kinney P L 2013 Projections of seasonal
patterns in temperature-related deaths for Manhattan, New
York Nat. Clim. Change 3 717–21
Livezey R E and Chen W Y 1983 Statistical field significance and its
determination by Monte Carlo techniques Mon. Weather Rev.
111 46–59
Mann H B 1945 Nonparametric tests against trend Econom. J.
Econom. Soc. 245–259
Massey F J Jr 1951 The Kolmogorov–Smirnov test for goodness of fit
J. Am. Stat. Assoc. 46 68–78
McVicar T R, Roderick M L, Donohue R J, Li L T, Van Niel T G,
Thomas A, Grieser J, Jhajharia D, Himri Y and
Mahowald N M 2012 Global review and synthesis of trends in
observed terrestrial near-surface wind speeds: implications
for evaporation J. Hydrol. 416 182–205
Millennium ecosystem assessment 2003 Living Beyond Our Means:
Natural Assets and Human Well-Being (Washington DC:
Island Press)
Min S-K, Zhang X, Zwiers F W and Hegerl G C 2011 Human
contribution to more-intense precipitation extremes Nature
470 378–81
Mishra V and Lettenmaier D P 2011 Climatic trends in major U.S.
urban areas, 1950–2009 Geophys. Res. Lett. 38 L16401
Mishra V, Dominguez F and Lettenmaier D P 2012a Urban
precipitation extremes: how reliable are regional climate
models? Geophys. Res. Lett. 39 L03407
Mishra V, Smoliak B V, Lettenmaier D P and Wallace J M 2012b A
prominent pattern of year-to-year variability in Indian
summer monsoon rainfall Proc. Natl Acad. Sci. USA 109
7213–7
Munich Re 1999 Topics 2000: natural catastrophes—the current
position Munich Re Group Munich
O’Gorman P A and Schneider T 2009 The physical basis for
increases in precipitation extremes in simulations of 21stcentury climate change Proc. Natl Acad. Sci. USA 106 14773–7
Patz J A, Campbell-Lendrum D, Holloway T and Foley J A 2005
Impact of regional climate change on human health Nature
438 310–7
Rosenberg E A, Keys P W, Booth D B, Hartley D, Burkey J,
Steinemann A C and Lettenmaier D P 2010 Precipitation
extremes and the impacts of climate change on stormwater
infrastructure in Washington State Clim. Change 102
319–49
Rosenzweig C, Solecki W, Hammer S A and Mehrotra S 2010 Cities
lead the way in climate-change action Nature 467 909–11
Rosenzweig C, Solecki W D, Hammer S A and Mehrotra S 2011
Climate change and cities First Assessesment Report of the
Urban Climate Change Research Network
Schneider A, Friedl M A and Potere D 2009 A new map of global
urban extent from MODIS satellite data Environ. Res. Lett. 4
044003
Schreider S Y, Smith D I and Jakeman A J 2000 Climate change
impacts on urban flooding Clim. Change 47 91–115
Sen P K 1968 Estimates of the regression coefficient based on
Kendall’s tau J. Am. Stat. Assoc. 63 1379–89
Shepherd J M, Carter M, Manyin M, Messen D and Burian S 2010a
The impact of urbanization on current and future coastal
precipitation: a case study for Houston Environ. Plan. B Plan.
Des. 37 284–304
Environ. Res. Lett. 10 (2015) 024005
V Mishra et al
Shepherd J M, Stallins J A, Jin M L and Mote T L 2010b
Urbanization: impacts on clouds, precipitation, and lightning
Urban Ecosyst. Ecol., (urbanecosysteme) 1–27
Stewart I D and Oke T R 2012 Local climate zones for urban
temperature studies Bull. Am. Meteorol. Soc. 93 1879–1900
Stone B 2007 Urban and rural temperature trends in proximity to
large US cities: 1951–2000 Int. J. Climatol. 27 1801–7
Swiss Re 2001 World insurance in 2000: another boom year for life
insurance; return to normal growth for non-life insurance
Sigma
Troccoli A, Muller K, Coppin P, Davy R, Russell C and Hirsch A L
2012 Long-term wind speed trends over Australia J. Clim. 25
170–83
Van Ulden A P and van Oldenborgh G J 2006 Large-scale atmospheric circulation biases and changes in global climate model
simulations and their importance for climate change in
central Europe Atmos. Chem. Phys. 6 863–81
10
Vautard R, Cattiaux J, Yiou P, Thépaut J-N and Ciais P 2010
Northern hemisphere atmospheric stilling partly attributed
to an increase in surface roughness Nat. Geosci. 3 756–61
World Health Organization W H 2012 Global Status Report on
Alcohol and Health www.who.int/substance_abuse/
publications/global_alcohol_report/en/
Yue S and Wang C Y 2002 Regional streamflow trend detection with
consideration of both temporal and spatial correlation Int. J.
Climatol. 22 933–46
Zhang D-L, Shou Y-X and Dickerson R R 2009 Upstream urbanization exacerbates urban heat island effects Geophys. Res. Lett.
36 L24401
Zhang X et al 2005 Trends in Middle East climate extreme indices
from 1950 to 2003 J. Geophys. Res. Atmos. 1984−2012
110(D22)
Zhou B, Rybski D and Kropp J P 2013 On the statistics of urban heat
island intensity Geophys. Res. Lett. 40 5486–91


© Copyright 2026