FOR IMMEDIATE RELEASE January 29, 2015 Toshiba Announces
FOR IMMEDIATE RELEASE
January 29, 2015
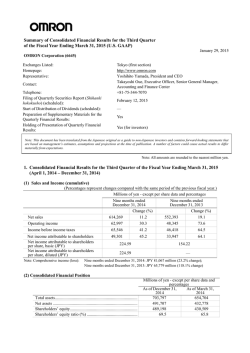
Toshiba Announces Consolidated Results for the First Nine Months
and Third Quarter of Fiscal Year Ending March 2015
TOKYO – Toshiba Corporation (TOKYO: 6502) today announced its consolidated results
for the first nine months (April-December) and the third quarter (October-December) of
fiscal year (FY) 2014, ending March 31, 2015. All comparisons in the following are based
on the same period a year earlier, unless otherwise stated.
Overview of Consolidated Results for the First Nine Months of FY2014
(April-December, 2014)
(Yen in billions)
First nine months
of FY2014
Net sales
Change from first
nine months of
FY2013
4,716.2
+184.2
Operating income (loss)
164.8
+9.6
Income (loss) from
continuing operations
before income taxes and
noncontrolling interests
134.9
+41.5
71.9
+33.2
Net income (loss)
attributable to
shareholders of the
Company [1]
[1]
“The Company” refers to Toshiba Corporation.
-1-
Over the first nine months of FY 2014, the US economy witnessed accelerating growth
while the EU economy as a whole slowed, reflecting decelerating trends in Germany
and France, though the UK economy performed well. China’s economy also continued
to slow on declining real estate prices and easing domestic demand. Southeast Asia as a
whole saw only gradual growth. In Japan, a loss of momentum in the economy started
to become apparent as a result of restrictive factors including weak consumer spending
due to the consumption tax increase, the absence of a substantial upturn in private
capital investment, and a lack of export growth despite yen depreciation.
Toshiba Group’s net sales increased by 184.2 billion yen to 4,716.2 billion yen
(US$38,977.0 million), reflecting a significant sales increase in the Energy &
Infrastructure segment and higher sales in the Community Solutions, Healthcare
Systems & Services and Electronic Devices & Component segments. Consolidated
operating income increased by 9.6 billion yen to 164.8 billion yen (US$1,362.1
million), the highest ever recorded for a nine-month period (April-December), despite a
restructuring expense of 46.0 billion yen recorded by the PC business. The Electronic
Devices & Components segment recorded the highest-ever operating income for a
nine-month period, the Energy & Infrastructure segment recorded significantly higher
operating income, and the Community Solutions segment also saw an increase in
operating income.
Income (loss) from continuing operations before income taxes and noncontrolling
interests increased by 41.5 billion yen to 134.9 billion yen (US$1,114.9 million),
reflecting non-operating income from settlement of a lawsuit and a lighter asset
management. Net income (loss) attributable to shareholders of the Company increased
solidly by 33.2 billion yen to 71.9 billion yen (US$594.3 million).
-2-
Consolidated Results for the First Nine Months of FY2014 by
Segment (April-December, 2014)
Net Sales
Energy & Infrastructure
Community Solutions
Healthcare Systems & Services
Electronic Devices & Components
Lifestyle Products & Services
Others
Corporate and Eliminations
1,370.3
973.3
276.3
1,294.0
886.4
373.6
-457.7
Change*
+191.7 +16%
+57.5
+6%
+7.4
+3%
+37.3
+3%
-81.8
-8%
+25.9
+7%
-53.8
-
Total
4,716.2
+184.2
+4%
(Yen in billions)
Operating Income
(Loss)
Change*
40.0
+32.0
24.5
+6.9
12.6
-2.8
177.7
+3.4
-63.5
-24.6
2.0
-2.7
-28.5
-2.6
164.8
+9.6
(* Change from the year-earlier period)
Energy & Infrastructure: Higher Sales and Higher Operating Income
The Energy & Infrastructure segment saw overall sales increase, reflecting higher sales
in the Nuclear Power Systems, Thermal & Hydro Power Systems and Railway Systems
businesses.
The segment as a whole saw higher operating income, reflecting a significant increase
in operating income in the Nuclear Power Systems business, the continued good
performance of the Thermal & Hydro Power Systems business, and higher operating
income in the Railway Systems business.
Community Solutions: Higher Sales and Higher Operating Income
The Community Solutions segment saw overall sales increase, reflecting higher sales in
the Elevator and Building Systems and the Commercial Air-Conditioners businesses.
The segment as a whole saw higher operating income, reflecting higher operating
income in the Elevator and Building Systems and the Commercial Air-Conditioners
businesses.
Healthcare Systems & Services: Higher Sales and Lower Operating Income
The Healthcare Systems & Services segment saw overall sales increase. Although the
-3-
segment was affected by a revision of the medical fee reimbursement system in Japan
and the impact of government policies in Europe, the U.S. and elsewhere to curb social
security expenses, the mainstay Computerized Tomography (CT) Systems business
saw firm sales, and sales in North America and emerging economies increased.
The segment as a whole saw lower operating income because of increased up-front
investments made to drive forward future growth, particularly in R&D of
next-generation diagnostic and other systems and in new businesses.
Electronic Devices & Components: Higher Sales and Higher Operating Income
The Electronic Devices & Components segment saw overall sales increase. The
Semiconductor business saw higher sales in Memories, and the Storage Product
business also saw higher sales, especially in 3.5-inch HDDs.
The segment as a whole recorded the highest-ever operating income for a nine-month
period. In the Semiconductor business, the Discretes recorded positive operating
income and the Memories saw higher operating income. The Storage Products business
recorded a significant increase in operating income.
Lifestyle Products & Services: Lower Sales and Deteriorated Operating Income
(Loss)
The Lifestyle Products & Services segment saw overall sales decrease. The PC
business and the Visual Products business, which includes LCD TVs, saw sales
decrease, due to a shift in focus to redefined sales territories.
The operating income (loss) of the segment as a whole would have improved if it had
not had to bear a restructuring cost recorded by the PC business. Although the Visual
Products business saw deteriorated operating income, the PC business would have
recorded positive operating income over three consecutive quarters if it had not had to
bear a restructuring cost of 46.0 billion yen.
Others: Higher Sales and Lower Operating Income
-4-
Overview of Consolidated Results for the Third Quarter (3Q) of FY2014
(October-December, 2014)
(Yen in billions)
3Q
of FY2014
Net sales
Change from 3Q
of FY2013
1,607.8
+76.5
Operating income (loss)
49.7
+1.4
Income (loss) from
continuing operations before
income taxes and
noncontrolling interests
67.6
+27.7
Net income (loss)
attributable to shareholders
of the Company [1]
41.1
+23.9
[1]
“The Company” refers to Toshiba Corporation.
Over the third quarter (October-December, 2014), consolidated net sales increased by 76.5
billion yen to 1,607.8 billion yen (US$13,287.9 million). Although the Lifestyle Products
& Services segment saw lower sales due to a shift in focus to redefined sales territories, the
Energy & Infrastructure and Electronic Devices & Components segments recorded a
significant increase in sales, and the Community Solutions and Healthcare Systems &
Services segments saw higher sales. Consolidated operating income increased by 1.4
billion yen to 49.7 billion yen (US$410.7 million), despite restructuring expenses of 26.0
billion yen recorded by the PC business of the Lifestyle Systems & Services segment. The
Energy & Infrastructure and Electronic Devices & Components segments recorded a
significant increase in operating income, and the Community Solutions and Healthcare
Systems & Services segments saw higher operating income. Most notably, the Electronic
Devices & Components segment recorded the highest-ever operating income for any
quarter in the history of Toshiba following the second quarter. Income (loss) from
continuing operations before income taxes and noncontrolling interests increased by 27.7
billion yen to 67.6 billion yen (US$559.1 million), reflecting non-operating income from
the settlement of a lawsuit. Net income (loss) attributable to shareholders of the Company
increased by 23.9 billion yen to 41.1 billion yen (US$339.4 million).
-5-
Consolidated Results for the Third Quarter of FY2014 by Segment
(October-December, 2014)
Net Sales
Energy & Infrastructure
Community Solutions
Healthcare Systems & Services
Electronic Devices & Components
Lifestyle Products & Services
Others
Corporate and Eliminations
Total
454.5
327.6
90.7
461.1
304.2
119.2
-149.5
1,607.8
Change*
+59.0 +15%
+11.6
+4%
+7.6
+9%
+57.0 +14%
-52.6 -15%
+8.5
+8%
-14.6
+76.5
+5%
(Yen in billions)
Operating Income
(Loss)
Change*
9.9
+17.5
8.7
+0.4
6.1
+1.3
71.0
+14.1
-34.2
-30.5
-0.3
+1.4
-11.5
-2.8
49.7
+1.4
(* Change from the year-earlier period)
Energy & Infrastructure: Higher Sales and Higher Operating Income
The Energy & Infrastructure segment saw significant sales increase, reflecting higher
sales in the Nuclear Power Systems, Thermal & Hydro Power Systems and Railway
Systems businesses.
The segment as a whole saw a considerable increase in operating income, reflecting a
significant increase in operating income in the Nuclear Power Systems business and
higher operating income in the Railway Systems business.
Community Solutions: Higher Sales and Higher Operating Income
The Community Solutions segment saw overall sales increase, reflecting higher sales in
the Elevator and Building Systems and Commercial Air-Conditioners businesses.
The segment as a whole saw higher operating income, reflecting higher operating
income in the Elevator and Building Systems, Lighting and Commercial
Air-Conditioners businesses.
Healthcare Systems & Services: Higher Sales and Higher Operating Income
The Healthcare Systems & Services segment saw overall sales increase. The mainstay
CT Systems business saw firm sales, despite a reluctance to invest in diagnostic
-6-
imaging systems due to a revision of the medical fee reimbursement system in Japan.
Sales in North America, emerging economies and elsewhere increased.
The segment as a whole saw higher operating income, reflecting higher operating
income from the mainstay CT Systems business and a solid performance in the Service
business.
Electronic Devices & Components: Higher Sales and Higher Operating Income
The Electronic Devices & Components segment recorded a significant increase in sales.
In the Semiconductor business, Memories saw a notable increase in sales on an
increase in the sales volume, and the Storage Products business recorded higher sales.
The segment as a whole recorded the highest-ever operating income for any quarter in
the history of Toshiba following the second quarter, reflecting positive operating
income in all businesses. In the Semiconductor business, Memories saw a significant
increase in operating income, and Discretes recorded positive operating income due to
higher operating income. The Storage Products business also saw higher operating
income.
Lifestyle Products & Services: Lower Sales and Deteriorated Operating Income
(Loss)
The Lifestyle Products & Services segment saw overall sales decrease. The PC
business and the Visual Products business, which includes LCD TVs, saw sales
decrease, due to a shift in focus to redefined sales territories.
The segment as a whole saw deteriorated operating income (loss). The PC business
would have recorded positive operating income if it had not had to bear a restructuring
cost of 2.6 billion yen. On the other hand, the Visual Products business deteriorated.
Others: Higher Sales and Improved Operating Income (Loss)
Notes:
Toshiba Group’s Quarterly Consolidated Financial Statements are based on U.S. generally accepted
accounting principles (“GAAP”).
Operating income (loss) is derived by deducting the cost of sales and selling, general and administrative
expenses from net sales. This result is regularly reviewed to support decision-making in allocations of
resources and to assess performance. Certain operating expenses such as part of restructuring charges
-7-
and legal settlement are not included in it.
The ODD business is classified as a discontinued operation in accordance with Accounting Standards
Codification 205-20 “Presentation of Financial Statements – Discontinued Operations”. The results of
the ODD business have been excluded from net sales, operating income (loss), and income (loss) from
continuing operations, before income taxes and noncontrolling interests. Net income of Toshiba Group
is calculated by reflecting the ODD business results to income (loss) from continuing operations, before
income taxes and noncontrolling interests. Results of the past fiscal year have been revised to reflect
this change.
Starting in FY2014, the method of computing operating income (loss) in each segment has been
changed. Results of the past fiscal year have been revised to reflect this change.
The HDD and SSD businesses are referred to as the Storage Products business.
Qualitative data herein are compared with the same period of the previous year, unless otherwise noted.
Financial Position and Cash Flows for the First Nine Months of FY2014
Total assets increased by 501.3 billion yen from the end of December 2013 to 6,976.0
billion yen (US$57,652.5 million).
Shareholders’ equity, or equity attributable to the shareholders of the Company, was
1,426.5 billion yen (US$11,789.0 million), an increase of 205.2 billion yen since the end of
December 2013. This reflects a rise in net income (loss) attributable to shareholders of the
Company and a significant improvement in the accumulated other comprehensive income,
due to the continued yen depreciation and the ensuing upturn in the stock market.
Total interest-bearing debt increased by 31.6 billion yen from the end of December 2013 to
1,595.0 billion yen (US$13,182.2 million).
As a result of the foregoing, the shareholders’ equity ratio at the end of December 2014
was 20.4%, a 1.5-point increase from the end of December 2013, and the debt-to-equity
ratio at the end of December 2014 was 112%, a significant 16-point improvement from the
end of December 2013.
Free cash flow was -105.5 billion yen (-US$871.6 million), increased by 15.8 billion yen
compared to the same period of the previous year.
-8-
Performance Forecast for FY2014
Toshiba Group’s business projections for its consolidated results for FY 2014 remain
unchanged from the projections announced on September 18, 2014 in the “Notice on Plan
for Dividend (Interim Dividend) and FY2014 Consolidated Forecast”.
Others
(1) Changes in significant subsidiaries during the period (changes in Specified
Subsidiaries (“Tokutei Kogaisha”) involving changes in the scope of
consolidation):
None
(2) Use of simplified accounting procedures, and particular accounting procedures in
preparation of quarterly consolidated financial statements:
Income taxes
Interim income tax expense (benefit) is computed by multiplying income (loss)
from continuing operations before income taxes and noncontrolling interests for
the nine months ending December 31, 2014 by a reasonably estimated annual
effective tax rate for FY 2014, ending March 31, 2015. The estimated annual
effective tax rate reflects a projected annual income (loss) from continuing
operations before income taxes and noncontrolling interests and the effect of
deferred taxes.
(3) Change in accounting policies:
None
Disclaimer
This report of business results contains forward-looking statements concerning future
plans, strategies and the performance of Toshiba Group. These statements are based on
management’s assumptions and beliefs in light of the economic, financial and other
data currently available. Since Toshiba Group is promoting business under various
market environments in many countries and regions, they are subject to a number of
their risks and uncertainties. Toshiba therefore wishes to caution readers that actual
results might differ materially from our expectations. Major risk factors that may have
a material influence on results are indicated below, though this list is not necessarily
-9-
exhaustive.
•
Major disasters, including earthquakes and typhoons;
•
Disputes, including lawsuits, in Japan and other countries;
•
Success or failure of alliances or joint ventures promoted in collaboration with
other companies;
•
Success or failure of new businesses or R&D investment;
•
Changes in political and economic conditions in Japan and abroad; unexpected
regulatory changes;
•
Rapid changes in the supply and demand situation in major markets and intensified
price competition;
•
Significant capital expenditure for production facilities and rapid changes in the
market;
•
Changes in financial markets, including fluctuations in interest rates and exchange
rates.
Note:
For convenience only, all dollar figures used in reporting fiscal year 2014 first nine months and third
quarter results are valued at 121 yen to the dollar.
###
- 10 -
© Copyright 2026
