Financial Results for 3rd Quarter of Fiscal Year 2014
Consolidated Financial Results for the First Three Quarters of FY2014
Yokogawa Electric Corporation (6841)
Consolidated Financial Results for the First Three Quarters of the Fiscal Year Ending March 31, 2015
(Japan GAAP)
January 30, 2015
Name of Listed Company: Yokogawa Electric Corporation (the “Company” herein)
Stock Exchanges Where the Company’s Shares Are Listed:
Tokyo Stock Exchange, Section 1
Stock Code: 6841
(URL: http://www.yokogawa.com/)
Name and Position of the Representative: Takashi Nishijima, President and Chief Operating Officer
Name and Position of Person in Charge:
Sadamu Kawanaka, General Manager of Corporate Communication Department
Telephone Number: +81-422-52-5530
February 12, 2015
Planned Quarterly Report Filing Date:
Planned Dividend Payment Starting Date: Quarterly Financial Results Supplemental Materials: Yes
Quarterly Financial Results Presentation Meeting:
Yes (for institutional investors)
(Any amount less than one million yen is disregarded.)
1. Consolidated business results for the first three quarters of the year ending March 31, 2015 (April 1-December 31, 2014)
(1) Results of operations on a consolidated basis (accumulated)
(Percentages show the change from the same period of the previous year.)
Net Sales
Million yen
For first three quarters of year ending March 31, 2015
For first three quarters of year ended March 31, 2014
(Note) Comprehensive income:
281,237
270,257
%
Operating Income
Ordinary Income
Million yen
Million yen
4.1
11.7
16,520
14,242
For first three quarters of year ending March 31, 2015
For first three quarters of year ended March 31, 2014
Net Income per
Share
For first three quarters of year ending March 31, 2015
For first three quarters of year ended March 31, 2014
%
16.0
40.7
18,265
14,024
%
30.2
56.9
Net Income
Million yen
12,858
6,969
%
84.5
-15.3
29,841 million yen (39.1%)
21,458 million yen (63.3%)
Diluted Net
Income per Share
Yen
Yen
49.93
27.06
―
―
(2) Financial conditions on a consolidated basis
Total Assets
Million yen
Million yen
%
426,319
398,920
219,242
192,106
49.7
46.9
As of December 31, 2014
As of March 31, 2014
(Note) Shareholders’ equity:
Shareholders’
Equity Ratio
Net Assets
As of December 31, 2014: 211,930 million yen
As of March 31, 2014: 187,255 million yen
2. Dividend status
Dividends per Share
June 30
September 30
December 31
End of Term
Total
Yen
Yen
Yen
Yen
Yen
For year ended March 31, 2014
―
6.00
―
6.00
12.00
For year ending March 31, 2015
―
6.00
―
Not finalized
Not finalized
For year ending March 31, 2015
(forecast)
(Note) Adjustment on dividend forecast in this quarter: No
The plan for a yearly dividend for the year ending March 31, 2015 will be announced as soon as it is finalized.
3. Business forecast for the year ending March 31, 2015 (April 1, 2014-March 31, 2015)
Net Sales
Million yen
Annual
400,000
Operating Income
(Percentages show the change from the previous year.)
Net Income
Ordinary Income
Net Income
per Share
%
Million yen
%
Million yen
%
3.0
28,000
8.1
26,000
1.2
Million yen
Not finalized
%
-
(Note) Adjustment on consolidated business forecast in this quarter: No
The net income forecast for the year ending March 31, 2015 will be announced as soon as it is finalized.
- 1 -
Yen
Not finalized
Consolidated Financial Results for the First Three Quarters of FY2014
Yokogawa Electric Corporation (6841)
<Notes>
(1) Changes to important subsidiaries during the period:
No
(changes to consolidated subsidiaries accompanying changes to specific subsidiaries)
(2) Application of special methods for quarterly consolidated financial statements: No
(3) Changes in accounting policies, changes in accounting estimates, restatements
a. Changes accompanying revision of accounting standards: No
b. Changes other than (a) above:
No
No
c. Changes in accounting estimates:
No
d. Restatements:
(4) Number of shares issued (common stock)
a. Number of shares outstanding at the end of the period (including treasury stock)
For the 3rd quarter of the year ending March 31, 2015
268,624,510 shares
For the year ended March 31, 2014
268,624,510 shares
b. Treasury stock at the end of the period
For the 3rd quarter of the year ending March 31, 2015
11,087,709 shares
For the year ended March 31, 2014
11,085,537 shares
c. Average number of shares in the period (quarterly consolidated accumulated period)
For the 3rd quarter of the year ending March 31, 2015
257,538,002 shares
257,542,727 shares
For the 3rd quarter of the year ended March 31, 2014
Note regarding the implementation of the quarterly review procedures
This quarterly consolidated financial results report is not subject to the quarterly review procedures specified in the
Financial Instruments and Exchange Act. A review of the quarterly financial statements based on the Act is not completed
before the release of the quarterly consolidated financial results.
Note concerning appropriate use of business forecasts, etc.
The above forecasts are based on the information that was available at the time this document was released and involve
assumptions regarding uncertain factors that may have an effect on future performance. Actual performance may vary greatly
due to a variety of factors.
Quarterly Financial Results Presentation Meeting
The Company plans to hold a quarterly financial results presentation meeting for institutional investors on Friday, January
30, 2015. The Company also plans to promptly post on its website the materials that are used at the meeting,
- 2 -
Consolidated Financial Results for the First Three Quarters of FY2014
Yokogawa Electric Corporation (6841)
Attachment
Contents
Page
1. Qualitative Information on Quarterly Consolidated Financial Results
.........................
4
(1) Explanation of business results
.........................
4
(2) Explanation of financial conditions
.........................
4
(3) Explanation of consolidated business forecast and other expectations
.........................
4
2. Notes on Summary Information
.........................
4
3. Quarterly Consolidated Financial Statements
.........................
5
(1) Quarterly consolidated balance sheets
.........................
5
(2) Quarterly consolidated statements of income and statements of
comprehensive income
.........................
7
Consolidated statements of income
for the first three quarters of FY2014
.........................
7
Consolidated statements of comprehensive income
for the first three quarters of FY2014
.........................
8
.........................
9
(1) Notes for going concern
.........................
9
(2) Notes if there is a remarkable change in the amount of shareholders’
equity
.........................
9
(3) Segment information
.........................
9
(4) Important post-balance sheet events
.........................
9
.........................
10
4. Notes on Quarterly Consolidated Financial Statements
<Reference>
Consolidated Financial Statements for the First Three Quarters of FY2014
- 3 -
Consolidated Financial Results for the First Three Quarters of FY2014
Yokogawa Electric Corporation (6841)
1. Qualitative Information on Quarterly Consolidated Financial Results
(1) Explanation of business results
This section reviews the performance of the Yokogawa Group for the first three quarters of the current fiscal year, from April 1,
2014 to December 31, 2014.
The global economy continued to recover slowly, but a plunge in oil prices, geopolitical events, and other factors was a cause
for rising concern. In Japan, although corporations have reported improved results thanks to bold government fiscal and
monetary policies that led to a weaker yen and rising stock prices, economic recovery is proceeding at only a gradual pace.
Under these circumstances, the Group continued to strive for growth based on its Evolution 2015 mid-term business plan by
targeting the industrial automation and control business, with a particular focus on the most active energy- and materials-related
market segments.
As a result, and mainly due to efforts to fill a backlog of orders for the industrial automation and control business, the Group’s
net sales in the first three quarters of the current fiscal year rose to 281.237 billion yen, up 10.979 billion yen year on year.
Operating income also rose to 16.520 billion yen, up 2.278 billion yen year on year.
Ordinary income came to 18.265 billion yen, up 4.240 billion yen year on year, mainly thanks to increased foreign exchange
gains and decreased interest payments, as well as the increased operating income. Net income totaled 12.858 billion yen, up
5.889 billion yen, chiefly due to the recording of gains on the sale of investment securities.
Results by individual segment are outlined below.
The Group’s sales tend to increase in the second and fourth quarters, and this is particularly the case with the industrial
automation and control business.
Industrial Automation and Control Business
Although the business is expected to remain robust in the mid- to long-term due to increases in energy-related investment,
global orders for the industrial automation and control business in the first three quarters of the current fiscal year were down
from the same period a year ago. However, thanks mainly to the continuing efforts to fill a backlog of orders, net sales were up
to 248.484 billion yen, a 13.520 billion yen year on year increase. Operating income came to 15.074 billion yen, up 1.408
billion yen, marking a turnaround from the year-on-year decrease that was recorded for the first two quarters. That decrease can
be mainly attributed to a deteriorating gross margin ratio for the industrial automation and control business in Japan and an
increase in selling, general and administrative expenses as the result of active investment for the future.
Test and Measurement Business
For the first three quarters of the current fiscal year, net sales for the test and measurement business fell 2.728 billion yen year
on year, to 17.180 billion yen. This decline was primarily due to the effects of the withdrawal from and sale of businesses up
until the end of the previous fiscal year. Operating income was 1.147 billion yen, up 734 million yen.
Other Businesses
In our other businesses segment, for the first three quarters of the current fiscal year, net sales were up 186 million yen from a
year earlier, to 15.571 billion yen, and operating income increased by 135 million yen, to 298 million yen.
(2) Explanation of financial conditions
In comparison with the end of the previous fiscal year, total assets at the end of the third quarter of the current fiscal year were
up 27.398 billion yen, to 426.319 billion yen, mainly due to an increase in cash and deposits. Total liabilities were up 262
million yen, to 207.076 billion yen, principally because of an increase in advances received and a decrease in the provision for
bonuses. Net assets were up 27.136 billion yen, to 219.242 billion yen, chiefly due to an increase in retained earnings. As a
result, the shareholders’ equity ratio at the end of the third quarter of the current fiscal year was 49.7%, up 2.8 percentage points
from the end of the previous fiscal year.
(3) Explanation of consolidated business forecast and other expectations
There is no change to the fiscal year 2014 consolidated business forecast that was announced on October 31, 2014.
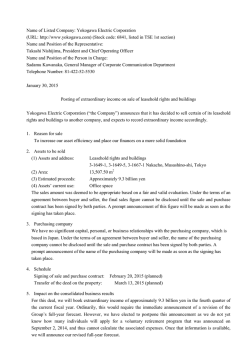
On this date, it is being announced that we have resolved to sell some of our leasehold rights and buildings in March 2015 and
will record the resultant extraordinary income of about 9.3 billion yen in the fourth quarter of the current fiscal year. However,
the full-year forecast for the Group’s net income has not yet been finalized; this is because we are soliciting applications from
employees for a voluntary retirement program that was announced on September 2, 2014, and the associated expenses that are
to be recorded as extraordinary losses are not yet known. As soon as the number of applicants is known and the expenses can be
assessed, we will announce the revised full-year forecast.
2. Notes on Summary Information
Not applicable
- 4 -
Consolidated Financial Results for the First Three Quarters of FY2014
Yokogawa Electric Corporation (6841)
3. Quarterly Consolidated Financial Statements
(1) Quarterly consolidated balance sheets
Millions of yen
(Reference)
End of FY2013
(March 31, 2014)
End of FY2014 3rd quarter
(December 31, 2014)
Assets
Current assets
Cash and deposits
57,296
72,217
135,053
131,240
15,686
18,053
8,497
10,761
Raw materials and supplies
10,260
11,344
Other
17,106
20,106
Allowance for doubtful accounts
(3,918)
(4,612)
Notes and accounts receivable-trade
Merchandise and finished goods
Work in process
Total current assets
239,983
259,112
Buildings and structures, net
47,987
51,311
Other, net
34,629
34,159
Total property, plant and equipment
82,616
85,471
19,315
17,845
6,929
7,876
26,245
25,721
Investment securities
40,260
47,376
Other
10,261
8,880
Noncurrent assets
Property, plant and equipment
Intangible assets
Software
Other
Total intangible assets
Investments and other assets
Allowance for doubtful accounts
(446)
Total investments and other assets
Total noncurrent assets
Total assets
- 5 -
(243)
50,075
56,013
158,937
167,207
398,920
426,319
Consolidated Financial Results for the First Three Quarters of FY2014
Yokogawa Electric Corporation (6841)
Millions of yen
(Reference)
End of FY2013
(March 31, 2014)
End of FY2014 3rd quarter
(December 31, 2014)
Liabilities
Current liabilities
Notes and accounts payable-trade
32,461
26,265
Short-term loans payable
19,286
19,619
Accounts payable-other
10,265
8,033
4,665
3,063
Advances received
28,581
38,762
Provision for bonuses
13,481
6,800
Other
27,090
31,099
135,833
133,645
Income taxes payable
Total current liabilities
Noncurrent liabilities
Long-term loans payable
62,120
60,997
Net defined benefit liability
2,895
3,877
Other
5,964
8,556
Total noncurrent liabilities
Total liabilities
70,980
73,431
206,814
207,076
43,401
43,401
Net assets
Shareholders’ equity
Capital stock
Capital surplus
Retained earnings
50,344
50,344
100,470
110,240
Treasury stock
(11,015)
(11,018)
Total shareholders’ equity
183,201
192,968
8,590
13,153
Accumulated other comprehensive income
Valuation difference on available-for-sale
securities
Deferred gains or losses on hedges
Foreign currency translation adjustment
Remeasurements of defined benefit plans
(80)
354
(3,945)
6,283
(511)
Total accumulated other comprehensive
income
Minority interests
Total net assets
Total liabilities, net assets
- 6 -
(828)
4,054
18,962
4,851
7,312
192,106
219,242
398,920
426,319
Consolidated Financial Results for the First Three Quarters of FY2014
Yokogawa Electric Corporation (6841)
(2) Quarterly consolidated statements of income and statements of comprehensive income
Consolidated statements of income for the first three quarters of FY2014
Millions of yen
(Reference)
First three quarters of FY2013
(April 1-December 31, 2013)
First three quarters of FY2014
(April 1-December 31, 2014)
Net sales
270,257
281,237
Cost of sales
158,889
163,309
Gross profit (loss)
111,368
117,927
Selling, general and administrative expenses
97,125
101,406
Operating income (loss)
14,242
16,520
309
365
Non-operating income
Interest income
Dividend income
527
579
1,037
1,890
Equity in earnings of affiliates
113
244
Other
847
841
2,835
3,922
1,623
1,382
Foreign exchange gains
Total non-operating income
Non-operating expenses
Interest expenses
Other
1,430
796
Total non-operating expenses
3,053
2,178
14,024
18,265
90
32
110
784
-
311
201
1,129
Ordinary income (loss)
Extraordinary income
Gain on sale of noncurrent assets
Gain on sale of investment securities
Gain on change in equity
Total extraordinary income
Extraordinary losses
Loss on sale of noncurrent assets
76
17
Loss on retirement of noncurrent assets
173
268
Impairment loss
122
-
7
-
669
-
Loss on valuation of investment securities
Business structure improvement expense
Total extraordinary losses
Income (loss) before income taxes and minority interests
Income taxes-current
Income taxes-deferred
1,048
285
13,176
19,108
5,268
5,486
(169)
(545)
Total income taxes
5,099
4,941
Income (loss) before minority interests
8,077
14,167
Minority interests in income (loss)
1,107
1,308
Net income (loss)
6,969
12,858
- 7 -
Consolidated Financial Results for the First Three Quarters of FY2014
Yokogawa Electric Corporation (6841)
Consolidated statements of comprehensive income for the first three quarters of FY2014
Millions of yen
(Reference)
First three quarters of FY2013
(April 1-December 31, 2013)
First three quarters of FY2014
(April 1-December 31, 2014)
8,077
14,167
5,302
4,595
Income (loss) before minority interests
Other comprehensive income
Valuation difference on available-for-sale securities
Deferred gains or losses on hedges
(251)
Foreign currency translation adjustment
8,473
Remeasurements of defined benefit plans
Share of other comprehensive income of associates
accounted for using equity method
Total other comprehensive income
Comprehensive income
434
10,917
(184)
(126)
40
(148)
13,381
15,674
21,458
29,841
19,817
27,767
1,641
2,074
(Comprehensive income attributable to)
Comprehensive income attributable to owners of
the parent
Comprehensive income attributable to minority interests
- 8 -
Consolidated Financial Results for the First Three Quarters of FY2014
Yokogawa Electric Corporation (6841)
4. Notes on Quarterly Consolidated Financial Statements
(1) Notes for going concern
Not applicable
(2) Notes if there is a remarkable change in the amount of shareholders’ equity
Not applicable
(3) Segment information
Segment sales and profits (losses)
Millions of yen
Term
Business
(Reference)
First three quarters of
FY2013
(Apr. 1-Dec. 31, 2013)
First three quarters of
FY2014
(Apr. 1-Dec. 31, 2014)
234,964
248,484
13,520
Change
Industrial automation
and control business
Net sales to unaffiliated customers
Operating income (loss)
13,665
15,074
1,408
Test and measurement
business
Net sales to unaffiliated customers
19,908
17,180
(2,728)
Other businesses
Consolidated
Operating income (loss)
Net sales to unaffiliated customers
Operating income (loss)
Net sales to unaffiliated customers
Operating income (loss)
413
1,147
734
15,385
15,571
186
163
298
135
270,257
281,237
10,979
14,242
16,520
2,278
[Reference]
Sales by geographical location
Term
Region
Millions of yen
(Reference)
First three quarters of FY2013
(Apr. 1-Dec. 31, 2013)
Composition
Amount
ratio (%)
Japan
First three quarters of FY2014
(Apr. 1-Dec. 31, 2014)
Composition
Amount
ratio (%)
Change
Amount
80,923
29.9
79,883
28.4
(1,040)
Outside Japan
189,333
70.1
201,353
71.6
12,019
Asia
75,402
27.9
76,439
27.2
1,036
Europe
27,111
10.0
26,929
9.6
North America
18,829
7.0
24,656
8.8
5,826
Middle East
24,054
8.9
25,962
9.2
1,907
Other
43,936
16.3
47,366
16.8
3,429
Consolidated net sales
270,257
100.0
281,237
100.0
(Note) Sales are based on a customer's geographical location (classified above as a country or region).
The breakdown of countries and regions belonging to groups is as follows.
(1) Asia
China, Singapore, South Korea, India, etc.
(2) Europe
The Netherlands, France, the United Kingdom, Germany, etc.
(3) North America The United States, Canada
(4) Middle East
Bahrain, Saudi Arabia, etc.
(5) Other
Russia, Brazil, Australia, etc.
10,979
(181)
(4) Important post-balance sheet events
At the board of directors’ meeting held on January 30, 2015, we resolved to sell some of our leasehold rights and buildings to
another company and will record the resultant extraordinary income of about 9.3 billion yen in the fourth quarter of the current
fiscal year. We have no significant capital, personal or business relationships with the company.
- 9 -
Consolidated Financial Results for the First Three Quarters of FY2014
Yokogawa Electric Corporation (6841)
[Reference]
January 30, 2015
Yokogawa Electric Corporation
Consolidated Financial Statements for the First Three Quarters of FY2014
Millions of yen
First three quarters of
FY2013
Amount
Net sales
Operating income
Ordinary income
Net income
Total assets
Shareholders’ equity
Net income to shareholders’ equity ratio
Net income per share
Capital investment
Depreciation
Research and development expenses
Average exchange rate during the term
USD
EUR
270,257
14,242
14,024
6,969
Ratio to net
sales
―
5.3%
5.2%
2.6%
393,242
190,892
3.9%
27.06 yen
9,150
10,118
18,632
100.03 yen
133.56 yen
First three quarters of
FY2014
Amount
281,237
16,520
18,265
12,858
Ratio to
net sales
―
5.9%
6.5%
4.6%
426,319
219,242
6.4%
49.93 yen
9,662
10,436
19,186
107.70 yen
140.34 yen
Consolidated orders by segment
Industrial automation and control business
Measurement business
Other businesses
Total
10,979
2,278
4,240
5,889
Ratio to
net sales
―
0.6%
1.3%
2.0%
33,076
28,349
2.5%
22.87 yen
511
317
554
7.67 yen
6.78 yen
First three quarters of
FY2014
268,433
Millions of yen
FY2014 full year
(forecast)
370,000
20,549
13,647
310,588
17,265
17,464
303,163
25,000
22,000
417,000
First three quarters of
FY2013
234,964
First three quarters of
FY2014
248,484
Millions of yen
FY2014 full year
(forecast)
353,000
19,908
15,385
270,257
17,180
15,571
281,237
25,000
22,000
400,000
First three quarters of
FY2013
13,665
First three quarters of
FY2014
15,074
Millions of yen
FY2014 full year
(forecast)
26,000
413
163
14,242
1,147
298
16,520
1,500
500
28,000
Consolidated operating income by segment
Industrial automation and control business
Measurement business
Other businesses
Total
Amount
First three quarters of
FY2013
276,391
Consolidated sales by segment
Industrial automation and control business
Measurement business
Other businesses
Total
Change
- 10 -
© Copyright 2026
