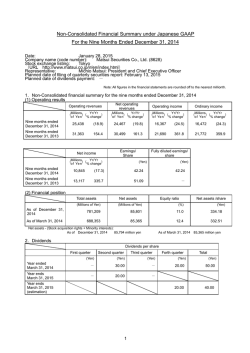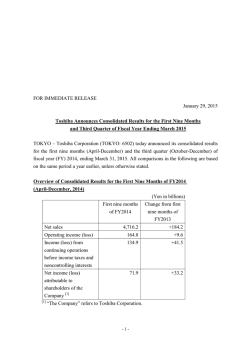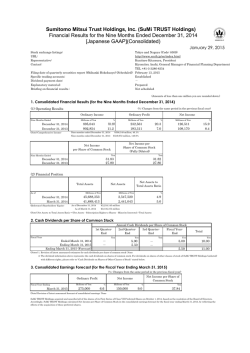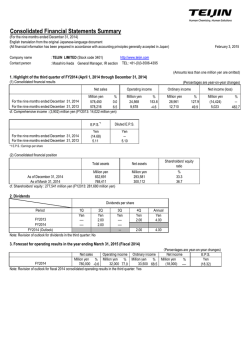
Third Quarter Ended December 31, 2014
Nintendo Co., Ltd.
CONSOLIDATED FINANCIAL HIGHLIGHTS
January 28, 2015
Nintendo Co., Ltd.
11-1 Hokotate-cho, Kamitoba,
Minami-ku, Kyoto 601-8501
Japan
Consolidated Results for the Nine Months Ended December 2013 and 2014
(1) Consolidated operating results
(Amounts below one million yen are rounded down)
Net sales
Operating income
million yen
%
442,920 (11.3)
499,120
(8.1)
Nine months ended December 31, 2014
Nine months ended December 31, 2013
million yen
31,604
(1,578)
Ordinary income
Net income
million yen
%
92,356 66.2
55,566 144.2
%
-
million yen
%
59,515 483.7
10,195 (29.9)
[Note] Percentages for net sales, operating income etc. show increase (decrease) from the same period of the previous fiscal year.
Net income per share
yen
502.78
79.73
Nine months ended December 31, 2014
Nine months ended December 31, 2013
(2) Consolidated financial positions
As of December 31, 2014
As of March 31, 2014
Total assets
Net assets
million yen
1,480,986
1,306,410
million yen
1,202,287
1,118,438
Capital adequacy
ratio
%
81.2
85.6
Dividends
Year ended March 31, 2014
Year ending March 31, 2015
End of 1st quarter
yen
-
End of 2nd quarter
yen
0.00
0.00
Dividend per share
End of 3rd quarter
yen
-
Year-end
Annual
yen
Year ending March 31, 2015
(forecast)
yen
100.00
100.00
130.00
130.00
[Note] The forecast herein is modified from the forecast in the report of "Consolidated Financial Statements" released on May 7, 2014.
Consolidated Financial Forecast for the Fiscal Year Ending March 31, 2015
Net sales
Year ending March 31, 2015
million yen
%
550,000
(3.8)
Operating income
million yen
20,000
%
-
Ordinary income
million yen
%
50,000
721.5
million yen
30,000
[Notes]
1. This forecast is modified from the forecast in the report of "Consolidated Financial Statements" released on May 7, 2014.
2. Percentages for net sales, operating income etc. show increase (decrease) from the previous each period.
- 1-
Net income
per share
Net income
%
-
yen
253.44
Nintendo Co., Ltd.
Others
(1) Changes for important subsidiaries during the nine-month period ended December 31, 2014
: Not applicable
(2) Application of peculiar methods for accounting procedures
: Applicable
(3) Changes in accounting procedures:
1) Related to accounting standard revisions etc.
2) Other changes
3) Changes in accounting estimates
4) Modified restatements
: Applicable
: Not applicable
: Not applicable
: Not applicable
(4) Outstanding shares (common shares)
① Number of shares outstanding (including treasury stock)
As of Dec. 31, 2014 :
141,669,000 shares
② Number of treasury stock
As of Dec. 31, 2014 :
23,296,615 shares
③ Average number of shares
Nine months ended
118,373,372 shares
Dec. 31, 2014 :
As of March 31, 2014 :
141,669,000 shares
As of March 31, 2014 :
23,294,719 shares
Nine months ended
Dec. 31, 2013 :
127,875,817 shares
[Notes]
1. This earnings release report is not subject to audit procedures based on the Financial Instruments and Exchange Act. At the time of disclosure of this
report, the audit procedures for the financial statements are in progress.
2. Forecasts announced by the Company (Nintendo Co., Ltd.) referred to above were prepared based on management's assumptions with information
available at this time and therefore involve known and unknown risks and uncertainties. Please note such risks and uncertainties may cause the actual
results to be materially different from the forecasts (earnings forecast, dividend forecast, and other forecasts).
- 2-
Nintendo Co., Ltd.
1. Consolidated Operating Results
During the nine months ended December 31, 2014, for “Nintendo 3DS,” “New Nintendo 3DS/New Nintendo 3DS XL,” launched
as the newest members of the “Nintendo 3DS” family in Japan in October, got off to a good start and continued to sell well. However,
as sales of the “Nintendo 3DS” hardware in the United States and in Europe, where “New Nintendo 3DS/New Nintendo 3DS XL”
were yet to be launched, did not grow sufficiently, the global sales of the “Nintendo 3DS” family hardware were 7.08 million units.
As for the “Nintendo 3DS” software, “Pokémon Omega Ruby/Pokémon Alpha Sapphire” and “Super Smash Bros. for Nintendo
3DS” enjoyed robust sales with 9.35 million units and 6.19 million units sold respectively, while titles such as “Tomodachi Life,”
“Mario Kart 7” and “Pokémon X/Pokémon Y” showed steady sales. There were also a number of hit titles from third-party
publishers in the Japanese market. As a result, the global sales of the “Nintendo 3DS” software were 53.04 million units.
With respect to “Wii U,” Nintendo released two big titles, “Mario Kart 8”and “Super Smash Bros. for Wii U,” which enable family
members and friends to have fun together in their living rooms. These titles sold 4.77 million units and 3.39 million units globally,
and the global sales of the “Wii U” hardware and software reached 3.03 million and 20.59 million units respectively.
As a result, net sales were 442.9 billion yen (of which overseas sales were 323.2 billion yen or 73.0% of the total sales) and
operating income was 31.6 billion yen. As a result of exchange gains totaling 51.0 billion yen due to depreciation of the yen at the
end of this period compared with the one at the end of the last fiscal year, ordinary income was 92.3 billion yen and net income was
59.5 billion yen.
2. Consolidated Financial Forecast
The consolidated earnings forecast for the fiscal year ending March 31, 2015 has been modified from the previous forecast
released on May 7, 2014.
Please refer to “Notice of Full-Year Financial Forecast Modifications” released today.
3. Other Information
Application of peculiar methods for accounting procedures
With respect to certain consolidated subsidiaries, corporate income tax amount is calculated by taking the amount of income before
income taxes through the nine-month period ended December 31, 2014 multiplied by reasonably estimated annual effective tax rate
with the effects of deferred taxes reflected.
Changes in accounting procedures related to accounting standard revisions etc.
Effective beginning the three-month period ended June 30, 2014, Nintendo has adopted Article 35 of the “Accounting Standard for
Retirement Benefits” (ASBJ Statement No.26 of May 17, 2012; hereafter the “Accounting Standard”) and Article 67 of the
“Guidance on the Accounting Standard for Retirement Benefits,” (ASBJ Guidance No.25 of May 17, 2012) and has changed the
calculation methods for retirement benefit obligations and service costs. The method of attributing estimated retirement benefits to
periods has been changed from the straight line basis to the benefit formula basis, and the method of determining the discount rate
has been revised from a method based on an approximation of the employees’ average remaining service period to a method of using
a single weighted average discount rate reflecting the estimated payment period and the amount for each estimated payment period of
the retirement benefit.
With respect to application of the Accounting Standard, in accordance with transitional accounting treatments as stated in Article
37 of the Accounting Standard, the effect of the changes in calculation methods for retirement benefit obligations and service costs
has been reflected in retained earnings at the beginning of the nine-month period ended December 31, 2014.
As a result, net defined benefit liability and net defined asset (included in investments and other assets) have increased by 484
million yen and 3,078 million yen respectively at the beginning of the nine-month period ended December 31, 2014, while retained
earnings and deferred tax liabilities regarding them have increased by 1,673 million yen and 920 million yen respectively at the same
point in time.
There is minimal impact on operating income, ordinary income or income before income taxes and minority interests in the ninemonth period ended December 31, 2014.
- 3-
Nintendo Co., Ltd.
4. Consolidated Balance Sheets
million yen
Description
As of March 31, 2014
As of December 31, 2014
(Assets)
Current assets
474,297
563,917
28,754
148,803
Short-term investment securities
320,918
356,614
Inventories
160,801
95,511
39,479
36,166
Cash and deposits
Notes and accounts receivable-trade
Other
(114)
Allowance for doubtful accounts
(197)
1,024,136
1,200,814
Property, plant and equipment
94,190
94,011
Intangible assets
12,467
13,508
175,616
172,651
282,274
280,171
1,306,410
1,480,986
Notes and accounts payable-trade
47,665
123,179
Income taxes payable
14,803
23,874
Total current assets
Noncurrent assets
Investments and other assets
Total noncurrent assets
Total assets
(Liabilities)
Current liabilities
2,183
595
90,999
91,477
155,652
239,127
Net defined benefit liability
18,558
23,454
Other
13,760
16,117
32,318
39,571
187,971
278,698
Capital stock
10,065
10,065
Capital surplus
11,734
11,734
1,378,085
1,427,437
Provision
Other
Total current liabilities
Noncurrent liabilities
Total noncurrent liabilities
Total liabilities
(Net assets)
Shareholders' equity
Retained earnings
(270,958)
Treasury stock
Total shareholders' equity
(270,980)
1,128,927
1,178,256
13,628
17,003
Accumulated other comprehensive income
Valuation difference on available-for-sale securities
Foreign currency translation adjustment
Total accumulated other comprehensive income
(24,274)
6,945
(10,645)
23,949
157
82
Total net assets
1,118,438
1,202,287
Total liabilities and net assets
1,306,410
1,480,986
Minority interests
- 4-
Nintendo Co., Ltd.
5. Consolidated Statements of Income
million yen
Description
Nine months ended December 31, 2013 Nine months ended December 31, 2014
Net sales
499,120
442,920
Cost of sales
349,825
269,976
Gross profit
149,294
172,944
Selling, general and administrative expenses
150,873
141,339
(1,578)
31,604
Interest income
Foreign exchange gains
Other
4,254
48,122
5,193
2,970
51,089
6,889
Total non-operating income
57,570
60,949
351
161
Operating income (loss)
Non-operating income
Non-operating expenses
Sales discounts
Other
Total non-operating expenses
Ordinary income
Extraordinary income
Gain on sales of noncurrent assets
Gain on sales of shares of subsidiaries
74
36
425
197
55,566
92,356
2
-
20
3,587
Reversal of loss on litigation
1,420
-
Total extraordinary income
1,422
3,608
Extraordinary loss
Loss on disposal of noncurrent assets
53
27
-
2,266
53
2,294
56,936
93,669
Total income taxes
46,743
34,164
Income before minority interests
10,192
59,505
Restructuring loss
Total extraordinary loss
Income before income taxes and minority interests
Minority interests in income
(3)
Net income
10,195
(10)
59,515
6. Consolidated Statements of Comprehensive Income
million yen
Description
Nine months ended December 31, 2013 Nine months ended December 31, 2014
Income before minority interests
10,192
59,505
Other comprehensive income
6,501
3,337
43,049
31,218
2
37
Total other comprehensive income
49,553
34,593
Comprehensive income
59,746
94,099
59,747
94,110
Valuation difference on available-for-sale securities
Foreign currency translation adjustment
Share of other comprehensive income of associates
accounted for using equity method
(Comprehensive income attributable to)
Comprehensive income attributable to owners of the parent
(0)
Comprehensive income attributable to minority interests
- 5-
(11)
Nintendo Co., Ltd.
7. Others
(1) Consolidated sales information
million yen
Category
Electronic
entertainment
products
Other
Nine months ended Dec. 31, 2013
Hardware
Software
Total electronic entertainment products
Playing cards, Karuta, etc.
Total
[Note] Download sales
Nine months ended December 31, 2013: 18.0 billion yen
Nine months ended Dec. 31, 2014
286,971
210,694
497,666
1,453
234,835
207,128
441,963
957
499,120
442,920
Nine months ended December 31, 2014: 21.1 billion yen
million yen
(2) Geographical sales breakdown
Nine months ended
December 31, 2014
Nine months ended
December 31, 2013
Japan
The Americas
Europe
Other
Total
Net sales
119,715
183,408
124,906
14,889
442,920
Component
ratio
27.0%
41.4%
28.2%
3.4%
100.0%
Net sales
159,062
188,354
137,635
14,067
499,120
Component
ratio
31.9%
37.7%
27.6%
2.8%
100.0%
million yen
(3) Other consolidated information
Nine months ended
December 31, 2013
Year ending March 31, 2015
(Forecast)
1 USD =
6,155
43,162
57,586
99.39 yen
4,595
44,799
44,070
106.87 yen
7,000
60,000
60,000
108.91 yen
1 Euro =
132.23 yen
140.30 yen
137.73 yen
1.7 billion
1.0 billion
1.6 billion
1.5 billion
0.8 billion
0.7 billion
-
Depreciation of property, plant and equipment
Research and development expenses
Advertising expenses
Average exchange rates
Nine months ended
December 31, 2014
Consolidated net sales in U.S. dollars
Consolidated net sales in Euros
Non-consolidated purchases in U.S. dollars
(4) Balance of major assets and liabilities in foreign currencies (non-consolidated)
million U.S. dollars/euros
USD
Euro
Cash and deposits
Accounts receivable-trade
Accounts payable-trade
Cash and deposits
Accounts receivable-trade
As of March 31, 2014
Balance
Exchange rate
2,341
1 USD =
82
102.92 yen
105
532
1 Euro =
141.65 yen
99
- 6-
As of Dec. 31, 2014
Balance
Exchange rate
2,064
1 USD =
598
120.55 yen
484
588
1 Euro =
331
146.54 yen
As of March 31, 2015
Estimated exchange rate
1 USD =
115.00 yen
1 Euro =
130.00 yen
Nintendo Co., Ltd.
(5) Consolidated sales units, number of new titles, and sales units forecast
Nintendo 3DS
Hardware
of which Nintendo 3DS XL
of which Nintendo 2DS
of which New Nintendo 3DS
of which New Nintendo 3DS XL
Software
New titles
Wii
Hardware
Software
New titles
Wii U
Hardware
Software
New titles
Japan
The Americas
Other
Total
Japan
The Americas
Other
Total
Japan
The Americas
Other
Total
Japan
The Americas
Other
Total
Japan
The Americas
Other
Total
Japan
The Americas
Other
Total
Japan
The Americas
Other
Japan
The Americas
Other
Total
Japan
The Americas
Other
Total
Japan
The Americas
Other
Japan
The Americas
Other
Total
Japan
The Americas
Other
Total
Japan
The Americas
Other
Actual
Apr. - Dec. '13
422
410
333
1,165
303
239
202
743
111
100
211
2,208
1,970
1,547
5,725
108
76
85
4
63
40
107
116
1,228
984
2,327
3
23
28
83
110
48
241
347
795
454
1,596
27
41
42
Actual
Apr. - Dec. '14
281
219
208
708
75
160
98
333
59
90
149
56
2
58
119
6
126
2,126
1,724
1,454
5,304
80
61
76
(0)
15
22
38
28
466
511
1,005
1
8
13
49
164
90
303
285
1,227
547
2,059
26
22
23
Sales Units in Ten Thousands
Number of New Titles Released
Life-to-date
Forecast
Apr. '14-Mar. '15
Dec. '14
1,870
1,677
1,493
5,041
900
700
633
566
1,898
173
196
369
56
2
58
119
6
126
8,250
7,272
6,074
6,100
21,596
419
333
378
1,275
4,862
4,007
10,144
50
7,539
49,563
33,425
90,527
1,100
462
1,254
1,255
230
445
246
920
360
848
2,925
1,515
5,287
2,500
76
116
107
[Notes]
1 Software sales units and the number of new titles for Nintendo 3DS are those of Nintendo 3DS card software (packaged and downloadable versions).
2 Software sales units and the number of new titles for Wii do not include those of Virtual Console and WiiWare.
3 Software sales units and the number of new titles for Wii U are those of Wii U disc software (packaged and downloadable versions).
4 Actual software sales units of each platform include the quantity bundled with hardware.
5 While forecasted software sales units include the quantity bundled with hardware for nine months ended December 31, 2014, they do not include
the quantity to be bundled with hardware on and after January 1, 2015.
- 7-
© Copyright 2026
