
2019
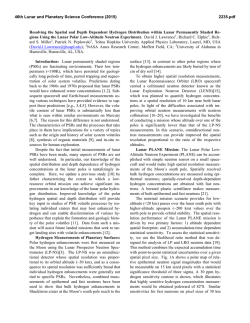
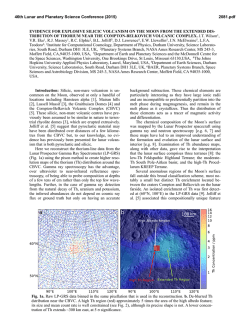
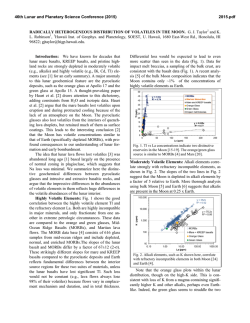
46th Lunar and Planetary Science Conference (2015)
2019.pdf
Epithermal neutron evidence for a diurnal surface hydration process in the Moon’s high latitudes. T.P.
McClanahan1, I.G. Mitrofanov2, W.V Boynton3, G. Chin1, A. Parsons1, R.D. Starr4,1, L.G. Evans5,1, A. Sanin2, M.
Litvak2, T. Livengood6,1, R. Sagdeev6, J.J Su6, J. Murray6, J. Bodnarik3, D. Hamara3, Astrochemistry Laboratory,
NASA Goddard Space Flight Center, Greenbelt, MD 20771, ([email protected]), 2Institute for Space
Research, RAS, Moscow 117997, Russia, 3Lunar and Planetary Laboratory, Univ. of Arizona, Tucson AZ,
4
Catholic Univ. of America, Washington DC, 5Computer Sciences Corporation, Lanham MD 20706, 6Univ. of
Maryland, College Park.
Introduction: We report evidence from epithermal neutron flux observations that show that the
Moon’s high latitude surfaces are being actively hydrated, dehydrated and rehydrated in a diurnal cycle.
The near-surface hydration is indicated by an enhanced suppression of the lunar epithermal neutron
leakage flux on the dayside of the dawn terminator on
poleward-facing slopes (PFS). At 0600 to 0800 localtime, hydrogen concentrations within the upper 1
meter of PFS are observed to be maximized relative
to equivalent equator-facing slopes (EFS). During the
lunar day surface hydrogen concentrations diminish
towards dusk and then rebuild overnight. Surface
hydration is determined by differential comparison of
the averaged EFS to PFS epithermal neutron count
rates above ±75° latitude. At dawn the contrast bias
towards PFS is consistent with at least 15 to 25 partsper-million (ppm) hydrogen that dissipates by dusk.
We review several lines of evidence derived from
temperature and epithermal neutron data by a correlated analysis of observations from the Lunar Reconnaissance Orbiter’s (LRO) Lunar Exploration Neutron Detector (LEND) that were mapped as a function of lunar local-time, Lunar Observing Laser Altimeter (LOLA) topography and Diviner (DLRE)
surface temperature [1-4].
Background: Evidence from several studies have
found surface hydration is enhanced near the Moon’s
dawn terminator. In 2009, observations of a diurnally active and global-scale hydration of the lunar surface was detected by independent observations from
three infrared (IR) detector systems including, Chandraayan-1’s Moon Mineralogy Mapper (M3), Deep
Impact and Cassini’s Visual Infrared Mapping Spectrometer [5-7]. Loosely bound hydrogen-bearing volatiles including water (H2O) and/or hydroxyl (OH-)
were observed to shift during the day to less illuminated surfaces [5]. In particular, the distribution of
absorbtion in the 3µm band, indicated H2O and OHwas found to be concentrated in early morning hours
after sunrise [6]. Subsequent M3 studies found hydrogen concentrations increasing with latitude and
diurnally persistent above ±60° [8,9]. However, the
IR hydrogen detections remain quantitatively inconclusive as IR observations may be degraded by photometric and temperature effects, do not explore the
depth of hydrated materials, are less reliable in polar
conditions and are not available at night.
Results from epithermal neutron observations by
the Lunar Prospector Neutron Spectrometer (LPNS)
and LEND are only partially consistent with IR results [10-12]. Both LPNS and LEND detected strong
evidence of increased accumulations of hydrogen
towards the poles. Recent evidence derived from
LEND equatorial observations have possibly detected
a diurnal surface hydration process, where hydrogen
is enhanced at the dawn terminator [13]. However,
regolith temperature, spacecraft and instrument induced effects are plausible explanations for the detection [14,15]. To constrain these possibilities we analyze the Moon’s northern and southern epithermal
leakage flux on PFS and EFS as a function of localtime. The objective is to identify and quantify diurnal hydration processes on these thermally contrasting surfaces and minimize the possibility of alternative explanations.
Methods: Epithermal neutron counting rates from
LEND’s Collimated Sensor for Epithermal Neutrons
(CSETN) were mapped using a low resolution technique as a function of lunar local-time. Maps included north polar observations from LRO’s circular mission (Sept 15, 2009 to December 2011) and south
polar full-mission observations from (Sept 15, 2009
to June 2014). For each pole a series of twenty-four
maps were produced, each centered on an hour of the
lunar day, each containing observations within ±3
hours of a given maps lunar local-time. For each
map, we averaged the epithermal neutron rates as a
function of several topography conditions including
five fixed masks derived from the LOLA terrain
models [12]. Each mask contains pixels corresponding to topographic conditions used to select and average epithermal map pixels. Figures 1, 2 show background subtracted epithermal rates for south and
north regions above ±75° latitude including: 1) All
topography (green-dashed) 2) All EFS (brown) 3)
Large–scale EFS (red) 4) All PFS (light-blue) 5)
Large-scale PFS (dark-blue).
Several key experimental concerns are addressed.
1) The possibility that spacecraft and instrument induced effects are accountable for diurnal trends is
reduced by averaging the north and south polar epithermal maps as a function of the spatially intersected
PFS and EFS masks. 2) the possibility is reduced that
the diurnal epithermal rate variation observed in [13]
is due solely to regolith temperature variation by constraining the analysis to high latitudes.
46th Lunar and Planetary Science Conference (2015)
Results: North (N) and south (S) polar evidence
support the hypothesis that enhanced concentrations
of hydrogen-bearing volatiles are found on PFS at
dawn. Flux suppression in both N and S results suggest hydrogenation of all surfaces during evening
hours from 1800 to 0600, as shown by decreasing
epithermal rates. Minimial PFS (N, S) rates occur at
0600 to 0800 indicating the local-time when maximum hydrogen concentrations are observed. Towards
dusk all epithermal rates increase and differences are
minimized, suggesting a combination of hydrogen
loss or regolith temperature effects on the epithermal
neutron flux. N and S PFS minima exhibit a ~3 hour
local-time lag vs. the respective EFS minima.
Importantly, the expected polar diurnal temperature variability is greater for EFS vs. PFS, therefore
defining an upper-bound constraint for any regolith
temperature contribution to the epithermal leakage
flux. However, for both N and S, the PFS profiles
show the greater diurnal variability indicating an additional diurnal process influences the epithermal
rates, possibly hydration, that is independent of regolith temperature. Statistical F-tests of the EFS vs.
PFS profile variations show the N and S results are
significantly different in Table 1. Further evidence of
enhanced hydration on dawn PFS is shown by the
increased suppression response of epithermal rates on
Large-scale PFS (blue vs light-blue) where no consistent difference is observed for EFS rates (red vs
brown), consistent with [12]. At 0600 to 0800 the N,
S difference in EFS and PFS rates is consistent with
15 to 25 ppm hydrogen respectively. Hydration estimates may also be larger due observational limitations.
Conclusions: LEND epithermal neutron evidence
2019.pdf
suggests that both N and S polar, EFS and PFS illustrate a diurnal process that hydrates polar surfaces
near the lunar dawn. Primary evidence of diurnal
surface hydration is shown by the greater variability
of N and S, PFS vs EFS profiles. EFS should have a
larger temperature variability and bound any temperature contribution, yet PFS have the larger profile
variances. Reviewed evidence also suggests a latitude
dependent regolith temperature effect exists, but is
too small to fully account for the observed latitude
dependent variation in epithermal rates [15]. Results
are consistent with IR results [5-7] and partially consistent with Livengoods equatorial observations [13].
References: [1] Vondrak et al. (2010) Sp. Sci. Rev., 150(722) [2] Mitrofanov et al.(2010) Sp. Sci. Rev., 150(183-207) [3]
Smith et al.(2010) Sp. Sci. Rev., 150(1-4) [4] Paige et al., (2010)
Sp. Sci. Rev., 150(1-4) [5] Pieters et al., (2009) Science, (326) 568572 [6] Sunshine et al., (2009) Science (326) 5925 565-568 [7]
Clark et al., (2009) Science (326) 5952, 562-564 [8] McCord et al.
(2011) JGR-Planets (116) E2 [9] Li et al. (2012) LPSC #1337 [10]
Feldman et al. (1998) Science 281(2352) [11] Mitrofanov et al.,
(2012) JGR-Planets [12] McClanahan et al. Icarus (In Press) [13]
Livengood et al. (2014) ESF [14] Teodoro et al. (2014) LEAG
#3023 [15] Little et al. (2003) JGR-Planets (108) E5
Profiles Compared
Test Stat Probability Same
SP: PFS All vs EFS All
2.74
0.019
SP: PFS Lrg vs EFS Lrg
4.77
4.0e-04
NP: PFS All vs EFS All
2.68
0.022
NP: PFS Lrg vs EFS Lrg
2.89
0.014
Table 1: F-test comparisons of EFS vs PFS profile
variation. Diurnal N and S, PFS profile
variations are significantly greater than
respective EFS profile variations suggesting
PFS are being hydrated.
Figure 1,2: - LEND Collimated Sensor for Epithermal Neutron (CSETN) count-rate profiles derived as a function of local-time for equatorfacing and pole-facing slopes. left: South polar profiles derived from local-time maps: -75° to -90° latitude. right: North polar profiles derived
from local-time maps: 75° to 90°. Five averages are derived from each of 24-maps. Maps span six-hours of local-time. Units are in background
subtracted counts per second. 1) All topography (green-dashed) 2) All EFS (brown) 3) Large–scale EFS (red) 4) All PFS (light-blue) 5) Largescale PFS (dark-blue). N and S results show maximum PFS hydration near 0600 to 0800. Regolith temperature cannot fully account for the
greater variability in PFS rates relative to EFS rates suggesting a large-scale surface hydration process is evidenced in polar latitudes. Uncertainties: 1-σ standard-error of the mean uncertainties are below 0.001 cps due to large amounts of area in each class and large latitude band > ±75°.

© Copyright 2026