
PDF - Journals
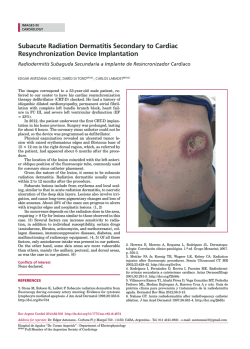
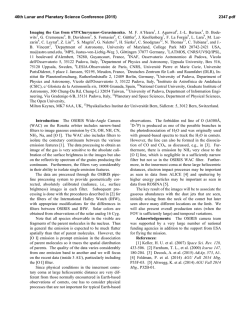
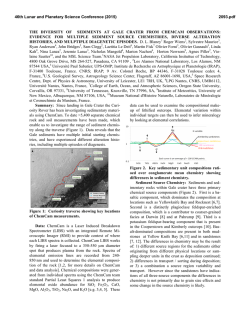
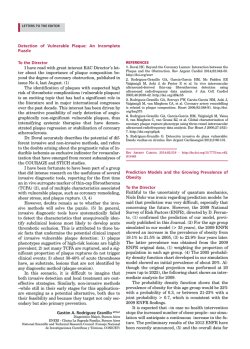
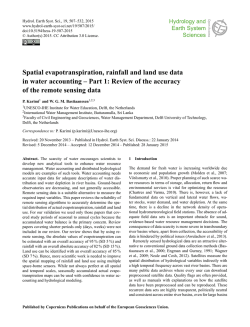
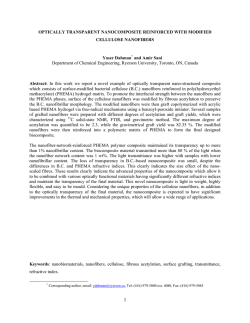
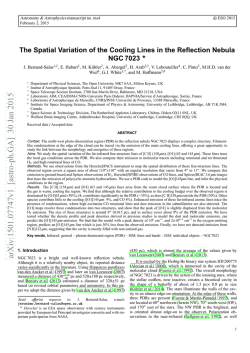
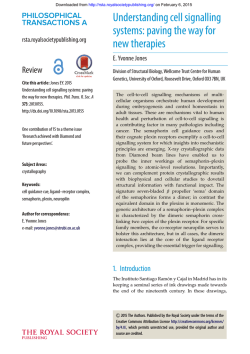
Tunable white light emission by variation of composition and
defects of electrospun Al2O3–SiO2 nanofibers
Jinyuan Zhou*1, Gengzhi Sun2, Hao Zhao1, Xiaojun Pan1, Zhenxing Zhang1, Yujun Fu1,
Yanzhe Mao1 and Erqing Xie1
Full Research Paper
Address:
1School of Physical Science and Technology, Lanzhou University,
Lanzhou, Gansu 730000, People’s Republic of China, and 2School of
Mechanical and Aerospace Engineering, Nanyang Technological
University, 50 Nanyang Avenue, 639798, Singapore
Email:
Jinyuan Zhou* - [email protected]
* Corresponding author
Open Access
Beilstein J. Nanotechnol. 2015, 6, 313–320.
doi:10.3762/bjnano.6.29
Received: 24 September 2014
Accepted: 22 December 2014
Published: 28 January 2015
Associate Editor: A. J. Meixner
© 2015 Zhou et al; licensee Beilstein-Institut.
License and terms: see end of document.
Keywords:
Al2O3–SiO2; defects; electrospinning; nanofibers; photoluminescence;
white light emission
Abstract
Composite nanofibers consisting of Al2O3–SiO2 were prepared by electrospinning in combination with post-calcination in air.
X-ray diffraction, scanning electron microscopy, and transmission electron microscopy were used to investigate the crystalline
phase and microstructure of the composite nanofibers. Photoluminescence experiments indicated that the resulting white light emission can be tuned by the relative intensity of the individual spectral components, which are related to the individual defects such as:
violet-blue emission from O defects, green emission from ≡Si(Al)–O–C∙=O, and red emission from intersystem radiative crossing.
White light emission was realized at a Al/(Al–Si) ratio of 40 and 60 mol %. This research may offer a deeper understanding of the
preparation of efficient and environmentally friendly, white luminescence materials.
Introduction
During the last decade, nanoscale SiO 2 has been intensely
investigated as a new silicon-based light-emitting material. Its
wide photoluminescence (PL) band ranges from the UV to red
wavelengths, allowing for potential application in white light
emission devices. It has been demonstrated that the luminescence emission and emission intensity of SiO2 nanostructures
are strongly dependent upon the intrinsic structural defects and
extrinsic environmental influences introduced during the
preparation processes, which can be effectively tuned and
controlled by doping [1-4]. Thus far, in order to achieve
enhanced and stable light emission, various materials have been
incorporated into a SiO2 matrix, such as Si nanocrystals, carbon
nanocomposites, ZnO, Al2O3, SnO2, and various rare-earth
elements [5-9].
Among those materials, Al2O3 is one of the most important materials in the history of ceramics, and has been extensively
applied in catalysts, coatings, microelectronics and various
313
Beilstein J. Nanotechnol. 2015, 6, 313–320.
devices, due to its excellent physical and chemical stability,
high dielectric constant, wide band gap energy, and relatively
high refractive index [10]. Similar to SiO2, Al2O3 is inexpensive and environmentally friendly, as well as highly compatible
with the current integrated circuit processes. It has been demonstrated that the PL properties of SiO2/Al2O3 composites are
more suitable than those of pure SiO2 or Al2O3 [11-15]. For
example, Hayakawa et al. reported on the PL properties of
10Al2O3–90SiO2 glasses annealed at 500 °C, and found two
emission peaks at 420 and 520 nm, which are assigned to the
point defects of oxygen deficiencies and the radical carbonyl
defect (≡Si(Al)–O–C∙=O) formed on the pore surface [16]. Mir
et al. incorporated 30 nm, Al2O3 nanocrystals into silica aerogels, followed by calcination at 1150 °C in air for 2 h. The
resulting 1Al2O3–3SiO2 composites exhibited strong, visible PL
bands ranging from 400 to 600 nm centered at ≈500 nm, which
were assigned to OH-related radiative emission centers formed
in the samples [11]. Additionally, Yoldas also showed that the
A12O3–SiO2 composites respond to UV light by emission of
strong, visible luminescence (400–700 nm), which is due to the
(≡Si–O¨O–Si≡) radiative centers [17]. Chen et al. reported a
peapod-like heterostructure composed of SiOx particles orderly
embedded in the highly crystalline α-Al2O3 nanoribbons. They
observed a strong and stable blue emission centered at 467 nm
under excitation at 320 nm, which was attributed to the neutral
oxygen vacancies (≡Si–Si≡) in the SiOx–Al2O3 heterostructure
[18]. More recently, Korsunska et al. have investigated the PL
behaviors of Si-rich Al 2 O 3 films annealed at 1150 °C and
observed intense emission in the visible spectral range from 575
to 600 nm, which is ascribed to defects in the matrix located
near the nanocrystal/matrix interface [13-15,19]. From the
above referenced work, it can be seen that the mechanism of
this defect-dominant PL still remains ambiguous, and it is also a
challenge to obtain the desired white luminescent material by
control the different defects. Moreover, to date, few studies
have reported on Al 2 O 3 –SiO 2 nanocomposites. Thus, it is
important and instructive to further explore the preparation and
PL properties of these environmentally friendly, Al2O3–SiO2
nanomaterials.
In this work, Al2O3–SiO2 composite nanofibers with different
Al/(Al–Si) ratios were prepared by electrospinning in combination with calcination in air. Strong light emission was observed
from the Al2O3–SiO2 hetero-nanofibers with tunable emission
from bluish-white to yellow-white. The possible origins of each
PL band in this composite nanofiber were also discussed.
Results and Discussion
Crystalline structures
Figure 1 shows the XRD patterns of the samples with different
Al/(Al–Si) ratios annealed at 1200 °C in air. The diffraction
peaks from pure SiO2 are located at 21.9°, 28.5°, and 36.2°,
which can be assigned to the <101>, <111>, and <200> crystalline plane of cristobalite (ICDD No. 39-1425), respectively
[20,21]. The diffraction peaks of pure Al2O3 are located at
25.4°, 34.92° , 43.16°, 52.36° , and 57.30°,which can be
assigned to the <012>, <104>, <110>, <113>, <024>, and
<110> crystalline plane of α-Al2O3 (ICDD No. 46-1212), respectively [22]. Once the Al2O3 components are mixed with
SiO2, the mullite formation reaction in diphasic gels takes place
between amorphous silica and transition alumina during
calcination. It can be seen from the typical mullite XRD line
from Si6Al4 samples that the diffraction peaks located at 16.51°,
26.25°, 31.05°, 33.23°, 35.27°, 37.05°, 39.25°, 40.86°, 42.65°,
49.55°, 54.09°, and 57.58° can be assigned to the <100>,
<210>, <001>, <220>, <111>, <130>, <201>, <121>, <230>,
<311>, <321>, and <041> crystalline planes of mullite (ICDD
No. 15-0776), respectively [23,24]. It is also noted that the
diffraction peaks from mullite located at 26.25° are clearly split
into two peaks, <120> and <210>, which is due to the fast
heating process during the calcination of Al2O3–SiO2 gels [25].
Figure 1: XRD patterns of the obtained composite nanofibers with
different Al/(Al–Si) ratios.
Furthermore, a diffraction peak is located at approximately 22°,
corresponding to the <101> of cristobalite, which indicates that
crystalline silica phases are present in the diphasic gels during
heating, while α-Al2O3 phases can barely be detected. Wei et al.
found that A12O3 or cristobalite residue is formed in a Al2O3rich or SO2-rich, mullite specimen if the A12O3 content of the
sample is not maintained between 60 and 66 mol % [26]. In our
case, the mole percent of Al2O3 in the diphasic gels ranges from
11 mol % to 66 mol %, that is, most of our diphasic gels are
silica-rich, except Al 8 Si 2 . The cristobalite residues in the
Al-rich Al8Si2 samples might be caused by Si contamination
from the silicon substrates used during high-temperature
calcination.
314
Beilstein J. Nanotechnol. 2015, 6, 313–320.
Morphology and microstructure
Figure 2a illustrates the morphology of the pure Al 2 O 3
nanofibers. The diameter of the rather brittle fibers is about
100–200 nm, exhibiting a smooth surface. When 20 mol %
SiO2 is incorporated into the Al2O3 matrix, the fibers become
ductile with length up to the centimeter scale and a diameter
similar to the pure Al2O3 material. Moreover, from the enlarged
SEM image shown in the inset of Figure 2b, some black spots
were formed on the surface of fibers. This may be due to the
precipitation of mullite nanocrystals from the inside to the
surface of the Al2O3 during the calcination [18]. When the
concentration of SiO 2 is further increase to 40 mol %
(Figure 2c), the composite fibers show an obvious change, exhibiting a fused, interconnect network with a diameter of
≈500 nm. This may be caused by the formation of mullite
components in the samples. The continued increase in the
concentration of SiO 2 (to 60 and 80 mol %, as shown in
Figure 2d and Figure 2e, respectively) results in the coarsening
of the surface of the fiber, further implying the precipitation of
mullite nanocrystals from the inside to the surface of the fibers
during the calcination. Comparably, the pure SiO2 nanofiber has
a diameter of ≈100 nm with smooth surface (Figure 2f).
coarse surface, which is consistent with the above SEM results.
Additionally, many nanocrystals can be observed in the
enlarged TEM image shown in Figure 3b with dimensions from
several nm to several tens of nm. The HRTEM image in
Figure 3c illustrates that the lattice fringes are well-defined,
suggesting that the composite nanowires have a high degree of
crystallinity. The interplanar spacing of 0.5495 nm measured
from the legible lattice fringes along the axis of the nanowire is
quite similar to that of the <110> planes of the mullite crystals
[27,28]. In addition, some nanocrystals of cristobalite with
dimensions of several tens of nm can also found on the surface
of the fibers, as shown in Figure 3d. Selected area electron
diffraction (SAED) patterns are collected from the thin edge of
one fiber, as shown in the inset of Figure 3c. The patterns not
only verify the high degree of crystallinity of the composite
nanofibers, but also indicate the disordered stacking of the
formed mullite nanocrystals.
Figure 3: (a) Low magnification TEM image of Al4Si6 nanofibers;
(b) locally enlarged TEM image; (c) HRTEM image of one area shown
in (b); and (d) enlarged TEM image of the fiber surface, the inset is the
SAED pattern collected from the fiber’s edge.
Chemical bonds
Figure 2: SEM images of the obtained composite nanofibers with
different Al/(Al–Si) ratios: (a) Al2O3, (b) Al8Si2, (c) Al6Si4, (d) Al4Si6,
(e) Al2Si8, and (f) SiO2. The insets are their corresponding enlarged
SEM images.
Further studies on the microstructure and morphology of the
calcined composite nanofibers were conducted by TEM.
Figure 3a shows the morphology of the Al4Si6 fibers. It can be
seen that the fibers have diameters of about 100–200 nm with a
Previous results indicate the PL from Al2O3–SiO2 composites is
mainly due to various types of defects formed during calcination in air. Thus, to investigate the chemical bonds in the
samples, FTIR measurements were also conducted. Selected IR
spectra of the samples with different Al/(Al–Si) ratios are
shown in Figure 4, and the corresponding assignments are listed
in Table 1. The IR spectra of our samples are similar to those
reported for natural and synthetic silica/alumina composites
[29-37]. In the wavenumber range of 400–1300 cm−1, nine,
315
Beilstein J. Nanotechnol. 2015, 6, 313–320.
vibration broadens with increasing Al content, which is due to
the formation of Al–O–Si bonds [35]. The absorption peak from
the samples with high Al content can be split into two peaks at
≈1120 cm−1 and 1160 cm−1, indicating a high content of mullite
[29], which is consistent with our XRD results. The new split
IR peak at 1160 cm−1 is due to Al–O stretching modes (AlO4)
[32]. In addition, from the FTIR spectrum of Si8Al2 samples,
the sharp, shallow absorption peak, appearing at 1065 cm−1,
corresponds to asymmetric stretching of Si–O–Si or Si–O–
defects [29].
Photoluminescence properties
Figure 4: FTIR spectra of the composite nanofibers with different Al–Si
ratios (400–1320 cm−1).
Table 1: FTIR absorbance band assignments in the region of
400–1320 cm−1 for Al2O3–SiO2 composite nanofibers.
band
notation
band position (cm−1)
band assignment
1
2
3
4
5
472, 1120
507, 530, 575, 618
730, 848, 878, 1160
790
1065
O–Si–O bending (SiO4)
Al–O stretching (AlO6)
Al–O stretching (AlO4)
Si–C–O bands
SiO–CO
obvious, characteristic, IR peaks from the composite samples
are observed and are located at 475, 530, 573, 618, 730, 790,
848, 878, and 1120 cm−1. The IR peak at ≈475 cm−1 is due to
the vibrations of O–Si–O bending modes (SiO4), whose intensity increases with an increase in the Si content. Typically, the
stretching modes of an AlO6 moiety are expected in the region
500–680 cm−1, whilst comparable modes for AlO4 appear in the
region of 680–880 cm−1 [29,30]. Thus, the characteristic, broad
adsorption peaks at 530, 575, and 618 cm−1 are assigned to
Al–O stretching modes (AlO6), and the peaks at 730, 848, and
878 cm−1 are due to the vibrations of Al–O stretching modes
(AlO4) [31,32]. It can be seen that the IR peak at 790 cm−1 increases with increasing the Si content, indicating that this peak
is related to the Si components. Referring to previous literature
[33,34], this IR peak at 790 cm−1 likely corresponds to the
vibration of Si–C–O bonds formed due to the residual carbon
elements from PVP or ethanol.
In the range of 950–1330 cm−1, the main peak intensity increases with increasing Si content, and this peak at ≈1120 cm−1
should be assigned to the vibrations of Si–O–Si stretching
modes (SiO4). Moreover, it is seen that the Si–O–Si stretching
We systematically studied the PL properties of the Al2O3–SiO2
composite nanofibers using a 325 nm He–Cd laser. Figure 5a
compares the PL spectra of the pure Al2O3, SiO2, and Al4Si6
samples. It is noted here that the fluorescence spectrum of the
Al4Si6 sample, which had the highest emission, can be separated into four components. One peak at 420 nm is due to
oxygen-related defects (O defects) resulting from calcination of
silica, alumina, or their composites [36], and another is a broad
emission peak around 520 nm with a shoulder peak at 550 nm,
which is the main contributor to the white emission. This
520 nm band can hardly be found in the pure SiO2 and Al2O3
samples, and this band is often assigned to radical carbonyl
defects, ≡Si(Al)–O–C∙=O [16,37]. In addition, anther weak
emission at approximately 610 nm is also an important contributor to the white emission.
To further investigate the absorption process of each PL band,
we measured the PL excitation (PLE) spectra of Al4Si6 samples
at various emission positions (420 nm, 2.95 eV; 520 nm,
2.38 eV; 550 nm, 2.25 eV; 610 nm, 2.03 eV), which are shown
in Figure 5b. The PLE spectrum monitored at 420 nm is a broad
absorbance band centered at around 346 nm, while the PLE
spectrum monitored at 520 nm shows a 275 nm absorption peak
(4.51 eV), together with a broad shoulder around 300–400 nm.
According to the previous results, the 275 nm absorption peak
might be attributed to the absorption of mullite components
formed in the samples [38], and the broad band around
300–400 nm to the absorption by the near-interface regions
between the SiO 2 and mullite crystals [39]. Moreover, the
550 nm emission has a similar PLE spectrum to that of the
610 nm, indicating a similar origin of the light absorbance.
From further comparison the energy of each band, it can be
suggested that the 550 nm and 610 nm emissions are associated
with the intersystem radiative crossing between mullites (or
SiO2) and radical carbonyl defects (≡Si(Al)–O–C∙=O).
In order to further investigate the true origin of each band and
how the Al- and Si-related components affect the PL behaviors
of the composite nanofibers, we have measured the PL spec-
316
Beilstein J. Nanotechnol. 2015, 6, 313–320.
Figure 5: (a) PL comparison between the pure SiO2, Al2O3, and Al4Si6 nanofibers; (b) PLE spectra of Al4Si6 samples monitored at 420 nm, 520 nm,
550 nm, and 610 nm; (c) PL spectra of the obtained nanofibers with different Al/(Al–Si) ratios. The inset optical photos in (a) and (c) are the corresponding light emission spot of Al6Si4 and Al4Si6 samples, respectively. (d) Energy transfer diagram indicating the mechanism for Al2O3–SiO2
nanocomposite emission. The dashed lines represent light absorption, the solid lines radiative transitions, and the dotted lines nonradiative
transitions.
trum of the samples with different Al–Si ratios, as shown in
Figure 5c. As for the PL behavior of Al 2 Si 8 nanofibers, it
exhibits a dark-yellow emission with a broad band centered at
about 550 nm. It can be seen that the intensities of the 550 and
610 nm emissions are greatly enhanced while the 420 nm emission intensity is reduced as compared to that of pure SiO2. And
the 550 and 610 nm emissions can be further enhanced with
further addition of Al up to 40 mol %.
When the Al content increases to 60 mol %, the Al 6 Si 4
nanofibers show a strong yellow-white emission, as demonstrated in the inset in Figure 5c. This result indicates that the
520 nm emission deceases with more Al content and less Si
content, again suggesting that the 520 nm emission is associated with Si–Al defects (i.e., as the previous assignment of
≡Si(Al)–O–C∙=O). From the XRD results, it can be observed
that the content of crystalline SiO2 decreases with the further
increase of Al. At an Al content of 60 mol %, the samples exhibit a very high level of crystallized mullite. At the same time,
less ≡Si(Al)–O–C∙=O defects can readily form during calcination in air.
Once excessive Al concentrations (80 and 100 mol %) are
reached in the samples, the obtained nanofibers exhibit a darkblue emission with the main emission peak at ≈420 nm. It can
be seen that the 520, 550 and 610 nm luminescence bands
almost disappear. From the XRD results, it can be seen that
only the highest degree of crystallization of mullite is obtained,
with very little SiO 2 and ≡Si(Al)–O–C∙=O remaining in
the samples. On the other hand, the 3A1 2 O 3 ·2SiO 2 (3:2)
mullite components first increase with more Al addition;
once excessive amounts of Al were added to the sample, the
2A12O3∙1SiO2 (2:1) mullite components formed. It is know
from previous work [38,40] that the 3:2 mullites possess
a wide band gap in the range of 3.95–5.5 eV, which can
be of benefit to the intersystem radiative crossing for
≡Si(Al)–O–C∙=O. However, the 2:1 mullites have a wide band
gap of 7.7 ± 0.2 eV, which is too wide for our case.
317
Beilstein J. Nanotechnol. 2015, 6, 313–320.
Therefore, based on the above analysis, we assign an energy
transfer mechanism to describe our PL results, as shown in
Figure 5d. First, most of the energy needed for the excitation of
radical carbonyl defects (≡Si(Al)–O–C∙=O) is absorbed by the
near-interface region between the SiO 2 and the mullites
(absorption centered at 346 nm), and only a small proportion of
the energy is by absorbed O defects. Next, a large part of
the absorbed energy can be transferred nonradiatively to
≡Si(Al)–O–C∙=O (520 nm), while some energy can be easily
transferred to an even higher energy band (SiO2 and mullite
crystals), and rest to O defects (420 nm). At the same time, the
energy transferred to mullite and SiO2 crystals can mainly intersystem radiatively cross to ≡Si(Al)–O–C∙=O, emitting weak
light at 550 nm and 610 nm.
To better understand the effect of changing the Al/(Al–Si) ratio
on the PL properties of the composite nanofibers, we analyzed
the raw statistics of the PL intensity for each colored luminescent center, as shown in Figure 6. The intensity of each luminescent center was integrated over the intensity area, fitted
using a Gaussian fit. The 420 nm-centered broad bands are
regarded as blue light centers, the 520 nm and 550 nm bands are
green light centers, and the 610 nm band as a red emission
center. Obviously, a suitable dopant of Si or Al into the
composite samples are required for light emission. It can be
seen that the blue light centers, such as O defects (420 nm), first
slightly decrease with the increasing Al/(Al–Si) ratio, and then
increase, and reach their minimum value at an Al content of
60 mol % with further increase in Al content. This result indicates that suitable dopants of Si or Al are benefitial for this type
of blue light emission. While both red and greeen centers first
increase with increasing Al content (reaching their maximum
value at Al contents of 0.6 and 0.4), they then decrease with
Figure 6: Integrated PL intensity of blue, green, and red luminescent
centers as a function of Al/(Al–Si) ratios.
further Al addition. Interestingly, at Al concentrations near
60 mol % and 40 mol %, the intensity ratio of the blue, green,
and red emission components mimic white light better than the
other samples’s emission, and output of blue-white and yellow
PL was observed as shown in the PL spots in Figure 5a and
Figure 5c.
Conclusion
In summary, Al2O3–SiO2 composite nanofibers with different
Al/(Al–Si) ratios were prepared by electrospinning in combination with post-calcination at 1200 °C in air. The obtained
composite nanofibers are comprised of mullite and cristobalite
nanocrystals, and the composite fibers with a Al/(Al–Si) ratio of
approximately 60–80 mol % exhibited a coarse surface, due to
the precipitation of mullite and cristobalite nanocrystals.
Furthermore, PL experiments indicate that the white light emission can be tuned by the Al/(Al–Si) ratio. This is accomplished
by tuning the intensity of each spectral component: violet-blue
light from O defects, green emission from ≡(Si)Al–O–C∙=O,
and red emission from the intersystem radiative crossing. This
research may provide a new strategy for the preparation of environmentally friendly, white light luminescence materials.
Experimental
Preparation of Al2O3–SiO2 composite
nanofibers
Poly(vinylpyrrolidone) (PVP, Mw ≈1,300,000) was purchased
from Sigma-Aldrich, aluminum nitrate nanohydrate
(Al(NO3)3·9H2O) and tetraethoxysilane (TEOS) were used for
the Al and Si sources, respectively, both purchased from
Shantou Chemical Corp., China. All other chemicals were
purchased from Tianjin Chemical Company (Tianjin, China).
All chemicals were analytically pure and used as received
without any further purification.
Al2O3–SiO2 hetero-nanofibers were prepared by electrospinning, the details of which can be reviewed from previously
published work [41-44]. Briefly, sol–gel aqueous solutions were
prepared by dissolving TEOS, Al(NO 3 ) 3 ·9H 2 O, and PVP
powder (10 wt %) in absolute ethanol. The mole ratios of
Al/(Al–Si) were set at 0 mol %, 20 mol %, 40 mol %,
60 mol %, 80 mol %, and 100 mol %, and their corresponding
samples are denoted as SiO2, Al2Si8, Al4Si6, Al6Si4, Al8Si2,
and Al2O3, respectively. After strong magnetic stirring for 2 h,
the mixture was transferred into a single-nozzle electrospinning
setup. The voltage and distance applied between the needle tip
and the collector was set as 10 kV and 15 cm, respectively. The
as-spun fibers were collected on silicon or quartz substrates.
After electrospinning, these as-spun Al2O3–SiO2 fibers were
calcined in a tube furnace in air at 1200 °C for 2 h to obtain
pure crystalline Al2O3–SiO2 nanofibers.
318
Beilstein J. Nanotechnol. 2015, 6, 313–320.
Characterization
The crystalline structure, morphology and PL properties of the
final products were investigated by X-ray diffraction (XRD,
Philips X’pert Pro), field-emission scanning electron
microscopy (FE-SEM, Hitachi S4800), transmission electron
microscopy (TEM, JEM 3000F, JOEL), Fourier transform
infrared spectroscopy (FTIR, IFS66v/S, 400–4000 cm−1), and
fluorescence spectroscopy (RF-540, Shi-Madzu) using a
15 mW, 325 nm, He–Cd laser (spot size of about 1 mm) in addition to a spectroscopy with a FLS-920T spectroflorormeter
(Edinburgh) with a 45 W, Xe lamp.
15. Khomenkova, L.; Kolomys, O.; Strelchuk, V.; Kuchuk, A.; Kladko, V.;
Baran, M.; Jedrzejewski, J.; Balberg, I.; Marie, P.; Gourbilleau, F.;
Korsunska, N. Mater. Res. Soc. Symp. Proc. 2013, 1617, 75–80.
doi:10.1557/opl.2013.1167
16. Hayakawa, T.; Hiramitsu, A.; Nogami, M. Appl. Phys. Lett. 2003, 82,
2975–2977. doi:10.1063/1.1569038
17. Yoldas, B. E. J. Mater. Res. 1990, 5, 1157–1158.
doi:10.1557/JMR.1990.1157
18. Chen, D.-Y.; Shao, M.-W.; Cheng, L.; Wang, X.-H.; Ma, D. D.-D.
Appl. Phys. Lett. 2009, 94, 043101. doi:10.1063/1.3070319
19. Khomenkova, L.; Kolomys, O.; Baran, M.; Kuchuk, A.; Strelchuk, V.;
Venger, Y.; Kladko, V.; Jedrzejewski, J.; Balberg, I.; Korsunska, N.
Microelectron. Eng. 2014, 125, 62–67. doi:10.1016/j.mee.2013.12.001
20. Elzea, J. M.; Odom, I. E.; Miles, W. J. Anal. Chim. Acta 1994, 286,
Acknowledgements
This work is supported by the National Natural Science
Foundation of China (No. 51202100), and partially by the
Fundamental Research Funds for the Central Universities
(NO.lzujbky-2013-30).
107–116. doi:10.1016/0003-2670(94)80182-7
21. Tong, Q.; Wang, J.; Li, Z.; Zhou, Y. J. Eur. Ceram. Soc. 2008, 28,
1227–1234. doi:10.1016/j.jeurceramsoc.2007.09.051
22. Yang, W.; Wang, H.; Cheng, X.; Xie, Z.; An, L. J. Am. Ceram. Soc.
2008, 91, 2732–2735. doi:10.1111/j.1551-2916.2008.02483.x
23. Sundaresan, S.; Aksay, I. A. J. Am. Ceram. Soc. 1991, 74, 2388–2392.
doi:10.1111/j.1151-2916.1991.tb06773.x
References
1. Song, H. Z.; Bao, X. M. Phys. Rev. B 1997, 55, 6988–6993.
doi:10.1103/PhysRevB.55.6988
2. Sokolov, I.; Volkov, D. O. J. Mater. Chem. 2010, 20, 4247–4250.
doi:10.1039/B923135H
3. Kong, D.; Zhang, C.; Xu, Z.; Li, G.; Hou, Z.; Lin, J.
J. Colloid Interface Sci. 2010, 352, 278–284.
doi:10.1016/j.jcis.2010.08.054
4. Liao, L.-S.; Bao, X.-M.; Li, N.-S.; Zheng, X.-Q.; Min, N.-B. J. Lumin.
1996, 68, 199–204. doi:10.1016/0022-2313(96)00023-3
5. Schmidt, M.; Heitmann, J.; Scholz, R.; Zacharias, M.
J. Non-Cryst. Solids 2002, 299–302, 678–682.
doi:10.1016/S0022-3093(01)01031-6
6. Liu, Z. C.; Chen, H. R.; Huang, W. M.; Gu, J. L.; Bu, W. B.; Hua, Z. L.;
Shi, J. L. Microporous Mesoporous Mater. 2006, 89, 270–275.
doi:10.1016/j.micromeso.2005.10.037
7. Wei, T.-Y.; Lu, S.-Y.; Chang, Y.-C. J. Chin. Inst. Chem. Eng. 2007, 38,
477–481. doi:10.1016/j.jcice.2007.05.002
8. Ishii, Y.; Matsumura, A.; Ishikawa, Y.; Kawasaki, S. Jpn. J. Appl. Phys.
2011, 50, 01AF06. doi:10.7567/JJAP.50.01AF06
9. Zhang, C.; Lin, J. Chem. Soc. Rev. 2012, 41, 7938–7961.
doi:10.1039/C2CS35215J
10. Ighodaro, O. L.; Okoli, O. I. Int. J. Appl. Ceram. Technol. 2008, 5,
313–323. doi:10.1111/j.1744-7402.2008.02224.x
11. El Mir, L.; Amlouk, A.; Barthou, C. J. Phys. Chem. Solids 2006, 67,
2395–2399. doi:10.1016/j.jpcs.2006.05.059
12. Trukhin, A. N.; Sharakovski, A.; Grube, J.; Griscom, D. L.
J. Non-Cryst. Solids 2010, 356, 982–986.
doi:10.1016/j.jnoncrysol.2010.01.027
13. Korsunska, N.; Khomenkova, L.; Kolomys, O.; Strelchuk, V.;
Kuchuk, A.; Kladko, V.; Stara, T.; Oberemok, O.; Romanyuk, B.;
Marie, P.; Jedrzejewski, J.; Balberg, I. Nanoscale Res. Lett. 2013, 8,
No. 273. doi:10.1186/1556-276X-8-273
14. Korsunska, N.; Stara, T.; Strelchuk, V.; Kolomys, O.; Kladko, V.;
Kuchuk, A.; Khomenkova, L.; Jedrzejewski, J.; Balberg, I. Physica E
2013, 51, 115–119. doi:10.1016/j.physe.2012.12.002
24. Osendi, M. I.; Baudin, C.; de Aza, S.; Moya, J. S. Ceram. Int. 1992, 18,
365–372. doi:10.1016/0272-8842(92)90067-N
25. de Sola, E. R.; Torres, F. J.; Alarcón, J. J. Eur. Ceram. Soc. 2006, 26,
2279–2284. doi:10.1016/j.jeurceramsoc.2005.04.015
26. Wei, W.-C.; Halloran, J. W. J. Am. Ceram. Soc. 1988, 71, 166–172.
doi:10.1111/j.1151-2916.1988.tb05023.x
27. Zhang, P.; Liu, J.; Du, H.; Li, S.; Xu, R. Chem. Commun. 2010, 46,
3988–3990. doi:10.1039/B927556H
28. Huo, K.; Zhu, B.; Fu, J.; Li, X.; Chu, P. K. J. Nanosci. Nanotechnol.
2010, 10, 4792–4796. doi:10.1166/jnn.2010.1700
29. Nampi, P. P.; Moothetty, P.; Berry, F. J.; Mortimer, M.; Warrier, K. G.
Dalton Trans. 2010, 39, 5101–5107. doi:10.1039/c001219j
30. Leivo, J.; Lindén, M.; Rosenholm, J. M.; Ritola, M.; Teixeira, C. V.;
Levänen, E.; Mäntylä, T. A. J. Eur. Ceram. Soc. 2008, 28, 1749–1762.
doi:10.1016/j.jeurceramsoc.2007.12.033
31. Voll, D.; Lengauer, C.; Beran, A.; Schneider, H. Eur. J. Mineral. 2001,
13, 591–604. doi:10.1127/0935-1221/2001/0013-0591
32. Voll, D.; Angerer, P.; Beran, A.; Schneider, H. Vib. Spectrosc. 2002,
30, 237–243. doi:10.1016/S0924-2031(02)00030-9
33. Innocenzi, P. J. Non-Cryst. Solids 2003, 316, 309–319.
doi:10.1016/S0022-3093(02)01637-X
34. Simon, S.; Tămăşan, M.; Radu, T.; Simon, V. Eur. Phys. J.: Appl. Phys.
2011, 55, 30401. doi:10.1051/epjap/2011100524
35. Wu, L.; Huang, Y.; Wang, Z.; Liu, L.; Xu, H. Appl. Surf. Sci. 2010, 256,
5973–5977. doi:10.1016/j.apsusc.2010.03.104
36. Hou, Z.; Zhang, C.; Li, C.; Xu, Z.; Cheng, Z.; Li, G.; Wang, W.;
Peng, C.; Lin, J. Chem. – Eur. J. 2010, 16, 14513–14519.
doi:10.1002/chem.201000900
37. Skuja, L. J. Non-Cryst. Solids 1994, 179, 51–69.
doi:10.1016/0022-3093(94)90684-X
38. Aryal, S.; Rulis, P.; Ching, W.-Y. J. Am. Ceram. Soc. 2012, 95,
2075–2088. doi:10.1111/j.1551-2916.2012.05172.x
39. Zhou, J.; Xu, X.; Song, X.; Chen, Z.; Zhou, M.; Chen, C.; Liu, Y.;
Song, J.; Xie, E. J. Mater. Res. 2010, 25, 1041–1048.
doi:10.1557/JMR.2010.0144
40. Khatim, O.; Nguyen, T. H. N.; Amamra, M.; Museur, L.; Khodan, A.;
Kanaev, A. Acta Mater. 2014, 71, 108–116.
doi:10.1016/j.actamat.2014.03.006
319
Beilstein J. Nanotechnol. 2015, 6, 313–320.
41. Zhou, J.-Y.; Chen, Z.-Y.; Zhou, M.; Gao, X.-P.; Xie, E.-Q.
Nanoscale Res. Lett. 2009, 4, 814–819.
doi:10.1007/s11671-009-9320-z
42. Wang, W.; Zhou, J.; Zhang, S.; Song, J.; Duan, H.; Zhou, M.; Gong, C.;
Bao, Z.; Lu, B.; Li, X.; Lan, W.; Xie, E. J. Mater. Chem. 2010, 20,
9068–9072. doi:10.1039/C0JM02120B
43. Song, J.; Zhou, J.; Wang, W.; Liu, Y.; Li, X.; Xu, X.; An, X.; Xie, E.
J. Phys. Chem. C 2010, 114, 10761–10767. doi:10.1021/jp103029z
44. Liu, Y.; Zhang, H.; An, X.; Gao, C.; Zhang, Z.; Zhou, J.; Zhou, M.;
Xie, E. J. Alloys Compd. 2010, 506, 772–776.
doi:10.1016/j.jallcom.2010.07.067
License and Terms
This is an Open Access article under the terms of the
Creative Commons Attribution License
(http://creativecommons.org/licenses/by/2.0), which
permits unrestricted use, distribution, and reproduction in
any medium, provided the original work is properly cited.
The license is subject to the Beilstein Journal of
Nanotechnology terms and conditions:
(http://www.beilstein-journals.org/bjnano)
The definitive version of this article is the electronic one
which can be found at:
doi:10.3762/bjnano.6.29
320
© Copyright 2026