
ADT Q1 FY15 Earnings Call Slides - Finalx
Q1 2015 Review
EARNINGS CONFERENCE CALL
JANUARY 28, 2015
© 2014 ADT LLC dba ADT Security Services. All rights reserved.
Forward Looking Statements/Safe Harbor
Our reports, filings, and other public announcements may include “forward-looking statements” within the meaning of Section 27A of the Securities Act of 1933, as amended, and Section 21E of the
Securities Exchange Act of 1934, as amended. These forward-looking statements relate to anticipated financial performance, management’s plans and objectives for future operations, business prospects,
outcome of regulatory proceedings, market conditions and other matters. We make these forward-looking statements in reliance on the safe harbor protections provided under the Private Securities
Litigation Reform Act of 1995. All statements, other than statements of historical facts, included in this presentation that address activities, events or developments that we expect, believe or anticipate will
exist or may occur in the future, are forward-looking statements. Forward-looking statements can be identified by various words such as “expects,” “intends,” “will,” “anticipates,” “believes,” “confident,”
“continue,” “propose,” “seeks,” “could,” “may,” “should,” “estimates,” “forecasts,” “might,” “goals,” “objectives,” “targets,” “planned,” “projects,” and similar expressions. These forward-looking statements
are based on management’s current beliefs and assumptions and on information currently available to management that are subject to risks and uncertainties, many of which are outside of our control,
and could cause future events or results to be materially different from those stated or implied in this presentation. Specific factors that could cause actual results to differ from results contemplated by
forward-looking statements include, among others, the following:
•competition in the markets we serve, including new entrants in these markets, and our ability to continue to execute a competitive, profitable pricing structure;
•our ability to compete with new and existing competitors by developing or acquiring new technologies that achieve market acceptance and acceptable margins;
•entry of potential competitors upon the expiration of non-competition agreements;
•an increase in the rate of customer attrition;
•changes in the housing market and consumer discretionary income;
•shifts in consumers' choice of, or telecommunication providers' support for, telecommunication services and equipment;
•failure to maintain the security of our information and technology networks, including personally identifiable information;
•interruption to our monitoring facilities;
•volatility in the market price of our stock;
•current and potential securities litigation;
•failure to realize expected benefits from acquisitions and investments;
•risks associated with pursuing business opportunities that diverge from our current business model;
•potential loss of authorized dealers and affinity marketing relationships;
•risks associated with acquiring and integrating customer accounts;
•failure of our authorized dealers to mitigate certain risks;
•increase in government regulation of telemarketing, e-mail marketing and other marketing upon cost and growth of our business;
•unauthorized use of our brand name;
•risks associated with ownership of the ADT® brand name outside of the United States and Canada by Tyco International Ltd., our former parent company ("Tyco") and other third parties;
•failure to enforce our intellectual property rights;
•allegations that we have infringed the intellectual property rights of third parties;
•changes in U.S. and non-U.S. governmental laws and regulations;
•our dependence on certain software technology that we license from third parties, and failure or interruption in products or services of third-party providers;
•our greater exposure to liability for employee acts or omissions or system failures;
•interference with our customers' access to some of our products and services through the Internet by broadband service providers;
•potential impairment of our deferred tax assets;
•inability to hire and retain key personnel, including an effective sales force;
•adverse developments in our relationship with our employees;
•capital market conditions, including availability of funding sources;
•changes in our credit ratings;
•risks related to our increased indebtedness;
•exposure to counterparty risk in our hedging agreements;
•potential liabilities for legacy obligations relating to the separation from Tyco; and
•failure to fully realize expected benefits from the separation from Tyco.
Given the risk factors and uncertainties that could cause our actual results to differ materially from those contained in any forward-looking statement, we caution investors not to unduly rely on our forwardlooking statements. These risk factors should not be construed as exhaustive. We disclaim any obligations to and do not intend to update the above list or to announce publicly the result of any revisions
to any of the forward-looking statements to reflect future events or developments. If one or more of these risks or uncertainties materialize or if our underlying assumptions prove to be incorrect, actual
results may vary materially from what we projected. Consequently, actual events and results may vary significantly from those included in or contemplated or implied by our forward-looking
statements. More detailed information about these and other factors is set forth in ADT's most recent annual report on Form 10-K, our quarterly reports on Form 10-Q and in other subsequent filings with
the U.S. Securities and Exchange Commission.
2
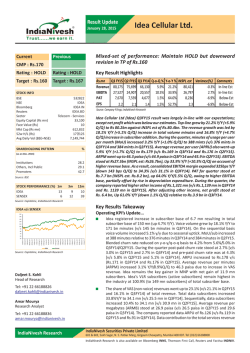
Leveraging our market leading position while
continuing to invest in our future
Gross Additions
Net Revenue Attrition
262
14.2%
231
13.0%
Q1 FY14
Q1 FY15
New & Resale RPU
$47.28
Q1 FY14
Direct SAC Creation Multiple1
34.0x
31.9x
$44.91
Q1 FY14
Notes: 1. Excludes impact of upgrades.
Q1 FY15
Q1 FY15
Q1 FY14
Q1 FY15
3
Q1 FY 2015 Overview1
Delivering improvement in operational metrics
Increased gross additions in both channels to 262,000, a 13.4% increase
Lowered revenue attrition by 120 basis points to 13.0%; unit attrition down 70 basis points to 12.9%
Net customer losses reduced to 8k units from 48k units in Q1’14, a reduction of 83.3%
Grew new subscriber RPU to $47.28, up 5.3%
Reduced both Total Company Net SAC creation multiple3 by 0.7x to 31.7x and Direct channel Net SAC
creation multiple3 by 2.1x to 31.9x
Strong financial performance
Grew recurring revenue to $825 million, an increase of 6.5% or 7.1% in constant currency2
Increased EBITDA before special items by 6.3% to $453 million2
Improved EBITDA margins before special items to 51.1%2, a 30 basis point improvement
Diluted earnings per share before special items of $0.512, an 18.6% increase
Steady-State Free Cash Flow before special items grows 13.5% to $8932 million
Repurchased 2.9 million shares at an average price of $32.35
Announced a 5% increase in the quarterly dividend subsequent to the close of the quarter
Notes: 1. All variances are year-over-year unless otherwise noted.
2. Reconciliations from GAAP to non-GAAP financial measures can be found in the appendix.
3. Excludes impact of upgrade units.
4
Investing in ADT’s Future
Enhancing Customer Experience
Total Security Panel and E-Contract roll out
Expanding Commercial Business
Sales force & service capabilities
Building Health Platform
Launching new products and distribution channels
Growing Customer Base & Driving Pulse and higher ARPU
Adds up over 13%; Pulse customers exceed 1.1M
New subscriber RPU up 5.3%
Strengthening Senior Team
Appointed new Canada leader and Board member
5
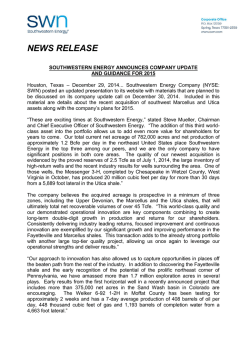
ADT Pulse Penetration Rates
New/Resale Pulse Installs as % of Total Gross Additions1
60%
60%
50%
50%
53.4%
40%
40%
30%
30%
36.5%
20%
20%
18.8%
10%
10%
7.2%
0%
0%
Q1'12
Q1'13
Total ADT
Q1'14
Residential Direct
PULSE - NEW/RESALE UNIT%
Residential Direct
Small Business
Dealer
Total ADT
Protectron
Q1'15
Small Business
Q1'12
14.4%
5.7%
0.7%
7.2%
Q1'13
29.8%
20.9%
4.5%
18.8%
Q1'14
42.0%
35.9%
28.9%
36.5%
Dealer
Q1'15
56.8%
49.5%
49.9%
53.4%
45.9%
Approximately 71% of new ADT residential customers taking Pulse, with take rates at its highest levels
Total ADT Pulse customers exceeded 1.1M, increasing our Pulse customer base to 18%2 of existing ADT customer base
Upgraded 31K existing customers to Pulse
Notes: 1. Home Health units and bulk account purchases excluded from gross additions in this calculation.
2. Percentage of ADT Pulse customer base excludes Protectron customers.
6
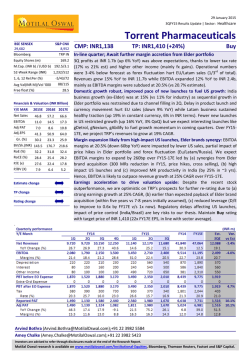
ADT at 2015 International CES
ADT Booth at CES
Named one of Time Magazine’s “6 Coolest Smart
Home Innovations at CES”
ADT Pulse technology featured during key note speech
demonstrating the future of home security
ADT showcased its products in the Sands Expo and
Convention center
ADT Pulse ensures consumers that their “smart
homes” can also be “safe homes”
ADT Business Security Services
ADT Total Security (TS)
Next generation ADT Pulse keypad and panel
No drilling or wiring required
Faster installation time
Services upgraded remotely
Panel sends signal even if keypad by door is broken or
tampered with during break-in
Premier automation capabilities and fully expandable
to support up to 250 sensors or devices through a
single system
Health Security Services
7
Q1 FY 2015 Key Income Statement Item Comparison
F or the
Quarte rs Ended
Recurring revenue
Decem be r 26 ,
De ce m be r 2 7 ,
2014
2013
$
Installation revenue recognition
Net outright sales
T&M and other revenue
Non-recurring revenue
Revenue
$
825
$
C hange
775
6.5%
40
37
8.1%
7
15
-53.3%
15
12
25.0%
62
64
-3.1%
8 39
5.7 %
6.1%
887
$
Cost to serve expenses before special items
277
261
Gross SAC expenses
112
113
-0.9%
D&A
Other
309
281
10.0%
F or the
5
5
0.0%
Quarters Ende d
6 60
6.5 %
De ce m ber 2 6 , De ce m be r 2 7 ,
To tal o pe rating e x pense s (befo re spe cial ite m s)
$
703
$
2 0 14
* EBITDA be fo re spe cial item s
$
* EBITDA margin % before special items
* EBITDA be fo re spe cial item s (pre-SAC )
453
51.1%
$
* EBITDA margin % before special items (pre-SAC)
558
4 26
6.3 %
50.8%
30 bps
$
5 24
6.5 %
66.6%
-20 bps
$
66.4%
Restructuring and other, net (1)
$
17
$
9
Net interest expense
$
50
$
47
Effective tax rate
N e t inco m e
33.3%
$
72
35.8%
$
77
1
23
3
Non-recurring separation costs
Separation related other income (2)
-
5
(1)
Within cost to serve when presented after special items.
(2)
Within other income when presented after special items.
-
1
(9)
17
(6)
$
9
-6 .5 %
$
0 .4 1
$
0 .39
5.1 %
$
0 .5 1
$
0 .43
1 8.6 %
* Dilute d EPS using cash tax rate (be fo re spe cial item s)
$
0 .7 3
$
0 .66
1 0.6 %
* Reconciliations from GAAP to non-GAAP financial measures can be found in the appendix.
5
1
-250 bps
* Dilute d EPS (be fore special item s)
Dilute d EPS (GAAP)
$
Radio conversion costs (1)
Im pact o f special ite m s on ne t inco m e $
6.4%
2
Acquisition and integration costs (1)
Tax effect of taxable special items
Impact of special items on net income
2013
$
8
Key Levers Performance Trends
Customer Additions
Average Revenue per Customer1
(Gross Adds in 000’s)
$47.28
262
$44.91
231
100
84
$41.76
$40.98
147
162
Q1 FY14
Q1 FY15
Direct
Q1 FY14
Dealer
Q1 FY15
New
Direct YOY % = 10.2%, 7.9% excl. Protectron
Dealer YOY % = 19.0%, 12.4% excl. Protectron
Total YOY % = 13.4%, 9.6% excl. Protectron
Average
New/Resale YOY % = 5.3% , 6.4% excl. Protectron
Average YOY % = 1.9%, 4.0% excl. Protectron
Direct channel:
ARPU:
Direct gross adds grew 10% year-over-year despite credit
screening
New/Resale ARPU grew 5.3% YOY and Average ARPU increased
by 1.9% YOY
Growth in Residential and Business channels
RPU growth in all channels driven by increased Pulse adoption
and sales of add-on services such as hosted video in the
Business channel
Strong lead generation, increased self-generated business and
improved close rates
Dealer Channel:
Pulse RPU continues to be approximately 25% higher than nonPulse accounts
Dealer adds grew 16k units, or 19%, to 100k units
Dealer channel nearly doubled Pulse penetration versus Q1’14
Continued to strengthen the quality of the dealer program
Notes: 1. “New” represents ARPU for both new and resale gross additions during the period; “Average” represents ARPU for existing customers, excluding contract monitoring, at the end of the period.
9
Key Levers Performance Trends (continued)
Tenure
Tenure
(T12M Net $ Attrition)
(T12M Net Unit Attrition)
14.2%
13.6%
13.0%
Q1 FY14
Q1 FY15
12.9%
Q1 FY14
Total Company
Q1 FY15
Residential & Small Business
Net revenue attrition improved by 120 basis points to 13.0%
Gross revenue attrition1 improved 80 basis points year-over-year
Strong year-over-year increase in resale units
Lowered net customer losses to 8k units, down from 48k units in Q1’14
Completed rollout of fully-automated credit screening process for the direct channel
Increased staffing, restructured collections, and improved loyalty & retention activities
Attrition remains a priority:
Focus on resales
Tenure screening
Pulse penetration
Notes: 1. Net of Dealer charge backs.
10
Key Levers Performance Trends (continued)
Recurring Revenue Margin%
Subscriber Acquisition Cost (SAC)
(Recurring revenue – Cost to Serve1)
creation multiple
66.3%
66.4%
Q1 FY14
Q1 FY15
Total Company (Existing Customer Base)
Total Company Recurring Revenue Margin YOY % = 10bps
Total Company excluding Protectron2 Recurring Revenue Margin YOY % = 70bps
34.0x
32.4x
Q1 FY14
Direct Channel (excl. upgrades)
31.9x
31.7x
Q1 FY15
Total Company (excl. upgrades)
Direct Net SAC Creation Multiple (excl. upgrades) YOY % = -6.1%
Total Company Net SAC Creation Multiple (excl. upgrades) YOY % = -2.2%
Increased Pulse take rates and sales of add-on services
driving RMR and margin expansion
Direct channel Net SAC creation multiple (excl. upgrades) of
31.9x, an improvement of 2.1x versus Q1’14
Excluding Protectron2, recurring revenue gross margin was
67% and cost to serve expenses1 flat to last year
Total Company Net SAC creation multiple (excl. upgrades)
improved 0.7x over prior year to 31.7x
Executing on business process improvement programs,
including the restructuring of various functions
New Pulse RPU growth combined with cost reduction initiatives
lowering SAC creation multiples
Continuing to invest in customer experience and expanding
into Commercial market
Broad roll-out of electronic contracts and planned hardware
efficiencies expected in FY2015
Notes: 1. Before special items of $26 million in Q1 2015 and $9 million in Q1 2014.
2. Effect of Protectron in Q1 2015 on recurring revenue is $32 million and on cost to serve before special items is $15 million. There was no effect in Q1 2014.
11
Q1 FY 2015 Free Cash Flow
($ in millions, except per share amounts)
Results & YOY Comparison
FCF Drivers and Outlook
Q1
2015
Q1
2014
Change
$453
$426
$27
Cash Interest
($41)
($16)
($25)
Working Capital, Cash
Tax & Other
($22)
($68)
$46
$390
$342
$48
Direct capex
($177)
($157)
($20)
Dealer capex
($146)
($110)
($36)
Other capex2
($21)
($7)
($14)
($344)
($274)
($70)
EBITDA
(before special items)1
Operating cash flow
(before special items)1
Total capex
(before special items)2
Free cash flow
(before special items)1
SteadySteady-state free cash flow
(before special items)1
EBITDA before special items1 growth of 6.3% driven by
strong financial and operational performance
Increased long-term debt to finance share
buybacks, and to a lesser extent acquisitions,
resulting in increased YOY interest expense
Operational efficiencies and working capital
management drove significant YOY reduction
Operating cash flow before special items1 up 14.0%
versus the same period last year
Investing in ADT Pulse and building stronger revenue
profile and customer base
Subscriber capex increase due to 13.4% YOY
growth in gross additions
ADT Pulse take rates exceeded 53%, fueling
Q1’15 new RPU to $47.28, a 5.3% improvement
from Q1’14
Completed 31k Pulse upgrades in the quarter
$46
$893
$68
$787
($22)
Pulse Automation customers continue to
generate strong returns and demonstrate better
attrition characteristics than non-pulse accounts
13.5%
Investments in real estate, improvements in IT
platforms, and for development of new services
led to increase in other capex spend
Notes: 1. Reconciliations from GAAP to non-GAAP financial measures can be found in the appendix.
2. Before special items of $11 million in Q1 2015 and $5 million in Q1 2014 spend in other capex.
12
Capital Structure
($ in millions, except share amounts)
FY 2013
Actual
FY 2014
Actual
Q1 2015
Actual
Total Debt
$3,376
$5,100
$5,258
EBITDA
$1,690
$1,767
$1,8292
Debt / EBITDA1
2.0x
2.8x2
2.9x2
Diluted Average Shares
Diluted Ending Shares3
224
212
183
175
175
173
(% reduction from inception)
(9.8%)
(25.5%)
(26.5%)
before special items1
(trailing 12 month)
Balanced use of capital structure focused on growth and shareholder return
Raised $300 million of fixed debt swapped to variable rate
The Company's average cost of borrowing was below 4% for Q1’15
Dividend growth
Paid quarterly dividend of 20 cents in Q1’15, a 60% increase, compared to 12.5 cents in Q1’14
Announced a 5% increase in the quarterly dividend payable in Q2’15
Opportunistic share repurchases
Repurchases of 2.9 million shares at an average price of $32.35
$286 million remaining on the share buyback authorization
As of the end of Q1’15, reduced diluted ending share count by 26.5%
Notes: 1. Reconciliations from GAAP to non-GAAP financial measures can be found in the appendix.
2. On a pro forma basis, including an estimate of Protectron’s trailing 12 month EBITDA before special items.
3. Ending shares plus the effect of dilutive securities.
13
Progress Towards Achieving FY 2015 Outlook
Recurring revenue growth %2
EBITDA growth
before special items3
T12M Net Unit Attrition
Steady-state free cash flow
before special items3
Additional Q1 Operating Levers
•Gross adds
•SAC Creation Multiples5
•New & Resale RPU
FY 2015E
Outlook
Q1’15
Results1
5% - 6%
7.1%
$70M – $100M
+$27M
< 13%
12.9%
> $1 billion
+14%4
+13.4%
-0.7x
+5.3%
1. In exception of the attrition results, all other comparisons of Q1’15 are on a year-over-year basis.
2. In constant currency. For a reconciliation to the most comparable GAAP measures please see the Appendix.
3. Unless otherwise noted, all figures are before special items and are non-GAAP measures. For a reconciliation to the most comparable GAAP measures please see the Appendix.
4. Compared to Q1’14 SSFCF.
5. Excluding the impact of upgrades.
14
Appendix
15
Q1 FY 2015 SteadySteady -State Free Cash Flow
($ in millions, except per share amounts)
Results & YOY Comparison
SSFCF Drivers and Outlook
Q1
2015
Q1
2014
Change
LQ Annualized EBITDA preSAC (before special items)1
$2,232
$2,096
6.5%
SAC required to maintain
recurring revenue
(1,329)
(1,299)
2.3%
(10)
(10)
0.0%
SteadySteady-state free cash flow
(before special items)1
$893
$787
13.5%
Improvements in customer experience, nonpay initiatives and focus on resale efforts
driving attrition lower
LQ average RMR
$275
$258
6.6%
LTM disconnects, net of
price escalation
Ability to generate strong cash flow allows for
continued investment into creating more
customers
14.6%
14.9%
-30bps
LQ gross recurring revenue
creation multiple
33.1x
33.8x
-2.1%
$1,329
$1,299
2.3%
SSFCF
Maintenance capex
SAC required to maintain
recurring revenue
Notes: 1. Reconciliations from GAAP to non-GAAP financial measures can be found in the appendix.
Steady-State Free Cash Flow up 13.5% YOY
Growth in RPU and gross additions, combined
with lower attrition and cost reductions drove
improvement in Pre-SAC EBITDA
2% YOY reduction in creation multiples
despite increase in Pulse penetration, as
Pulse customers generate higher RPU to
offset higher SAC expense
Launch of new Total Security (TS) panel for
Pulse in Q1’15 and deployment of electronic
contract system throughout 2015 will
continue to drive efficiencies and reduce
creation multiples
16
NonNon-GAAP Financial Measures
Revenue in constant currency, recurring revenue in constant currency, leverage ratio, earnings before interest, taxes, depreciation and amortization
(EBITDA), EBITDA margin, EBITDA (pre-SAC), EBITDA margin (pre-SAC), free cash flow (FCF), steady-state free cash flow (SSFCF), diluted earnings per share
(EPS) and diluted EPS at cash tax rates, in each case "before special items," are non-GAAP measures that may be used from time to time and should not be
considered replacements for GAAP results.
Revenue and recurring revenue, each in constant currency, are useful measures because they provide transparency to the underlying performance in
markets outside the United States by excluding the effect that foreign currency exchange rate fluctuations have on comparability. Revenue and recurring
revenue in constant currency as presented herein may not be comparable to similarly titled measures reported by other companies. The difference between
revenue (the most comparable GAAP measure), revenue in constant currency (non-GAAP measure) and recurring revenue in constant currency (the nonGAAP measure) is the exclusion of the impact of foreign currency exchange fluctuations. This is also the primary limitation of this measure, which is best
addressed by using revenue and recurring revenue in constant currency in combination with GAAP revenue.
The leverage ratio is defined as the ratio of EBITDA before special items to total debt. The leverage ratio is a useful measure of the Company's credit position
and progress towards leverage targets. Refer to the discussion on EBITDA before special items for a description of the differences between the most
comparable GAAP measure. The calculation is limited in that the Company may not always be able to use cash to repay debt on a dollar-for-dollar basis.
EBITDA is a useful measure of the Company's success in acquiring, retaining and servicing our customer base and ability to generate and grow recurring
revenue while providing a high level of customer service in a cost-effective manner. The difference between Net Income (the most comparable GAAP
measure) and EBITDA (the non-GAAP measure) is the exclusion of interest expense, the provision for income taxes, depreciation and amortization expense.
Excluding these items eliminates the impact of expenses associated with our capitalization and tax structure as well as the impact of non-cash charges
related to capital investments.
EBITDA (pre-SAC) is a useful measure of the Company’s success in retaining and servicing our customer base while providing a high level of customer service
in a cost-effective manner. The difference between Net Income (the most comparable GAAP measure) and EBITDA (pre-SAC) (the non-GAAP measure) is the
exclusion of interest expense, the provision for income taxes, depreciation expense, amortization expense, and subscriber acquisition related revenue and
expenses. Excluding these items eliminates the impact of expenses associated with our capitalization and tax structure, the impact of non-cash charges
related to capital investments and the impact of growing our subscriber base.
In addition, from time to time, the Company may present EBITDA and EBITDA (pre-SAC) before special items, which are the respective measures, adjusted to
exclude the impact of the special items highlighted below. These numbers provide information to investors regarding the impact of certain items
management believes are useful to identify, as described below.
17
NonNon-GAAP Financial Measures (continued)
There are material limitations to using EBITDA and EBITDA (pre-SAC). EBITDA and EBITDA (pre-SAC) may not be comparable to similarly titled measures
reported by other companies. Furthermore, EBITDA and EBITDA (pre-SAC) do not take into account certain significant items, including depreciation and
amortization, interest expense and tax expense, which directly affect our net income. Additionally, EBITDA (pre-SAC) does not take into account
expenses related to acquiring new customers. These limitations are best addressed by considering the economic effects of the excluded items
independently, and by considering EBITDA and EBITDA (pre-SAC) in conjunction with net income as calculated in accordance with GAAP. The EBITDA and
EBITDA (pre-SAC) discussion above is also applicable to the respective margin measures.
FCF is a useful measure of our ability to repay debt, make other investments and return capital to shareholders through dividends and share
repurchases. The difference between Cash Flows from Operating Activities (the most comparable GAAP measure) and FCF (the non-GAAP measure)
consists of the impact of capital expenditures, subscriber system assets, dealer generated customer accounts and bulk account purchases. Dealer
generated accounts are accounts that are generated through the network of authorized dealers. Bulk account purchases represent accounts acquired
from third parties outside of the authorized dealer network, such as other security service providers, on a selective basis. These items are subtracted
from cash flows from operating activities because they represent long-term investments that are required for normal business activities.
SSFCF is a useful measure of pre-levered cash that is generated by the Company after the cost of replacing recurring revenue lost to attrition, but before
the cost of new subscribers that drive recurring revenue growth. The difference between Net Income (the most comparable GAAP measure) and SSFCF
(the non-GAAP measure) consists of the factors discussed above regarding EBITDA (pre-SAC), on a quarter-to-date basis. EBITDA (pre-SAC) is then
annualized and adjusted for additional factors, described in the reconciliation below, required to maintain the steady-state. Certain components of these
inputs are determined using trailing twelve month information or information from the most recent quarter.
In addition, from time to time the Company may present FCF and SSFCF before special items, which is FCF or SSFCF, adjusted to exclude the impact of
the special items highlighted below. These numbers provide information to investors regarding the impact of certain items management believes are
useful to identify, as described below.
The limitation associated with using FCF and SSFCF is that they adjust for certain items that are ultimately within management's and the Board of
Directors' discretion to direct and therefore may imply that there is less or more cash that is available than the most comparable GAAP measure. FCF is
not intended to represent residual cash flow for discretionary expenditures since debt repayment requirements and other non-discretionary expenditures
are not reduced. This limitation is best addressed by using FCF and SSFCF in combination with other GAAP financial measures.
FCF and SSFCF as presented herein may not be comparable to similarly titled measures reported by other companies. These measures should be used
in conjunction with other GAAP financial measures. Investors are urged to read the Company's financial statements as filed with the Securities and
Exchange Commission, as well as the accompanying tables to this press release that show all the elements of the GAAP measure.
18
NonNon-GAAP Financial Measures (continued)
Diluted EPS at cash tax rates is a useful measure of the Company's diluted earnings per share after considering the difference between the effective tax
rate and cash tax rate. The difference between diluted EPS (the most comparable GAAP measure) and diluted EPS at cash tax rates (the non-GAAP
measure) is the exclusion of the impact of income tax expense and the inclusion of the impact of income taxes paid, net of refunds. Adjusting for these
items provides information on the impact of our net operating loss carryforwards on our diluted EPS.
The Company has presented its diluted EPS, diluted EPS at cash tax rates, EBITDA, EBITDA margin, EBITDA (pre-SAC), EBITDA margin (pre-SAC), FCF,
SSFCF and other measures before special items. Special items include charges and gains related to acquisitions, restructurings, impairments, and other
income or charges that may mask the underlying operating results and/or business trends of the Company. The Company utilizes these measures to
assess overall operating performance, as well as to provide insight to management in evaluating overall operating plan execution and underlying market
conditions. The Company may also present its effective tax rate as adjusted for special items for consistency. One or more of these measures may be
used as components in the Company's incentive compensation plans. These measures are useful for investors because they may permit more
meaningful comparisons of the Company's underlying operating results and business trends between periods. The difference between net income and
diluted EPS before special items and net income and diluted EPS (the most comparable GAAP measures) consists of the impact of the special items
noted above on the applicable GAAP measure. EBITDA, EBITDA margin, EBITDA (pre-SAC) and EBITDA margin (pre-SAC) before special items do not
reflect any additional adjustments, other than taxes, that are not reflected in net income before special items. The limitation of these measures is that
they exclude the impact (which may be material) of items that increase or decrease the Company's reported operating income, operating margin, net
income and EPS. This limitation is best addressed by using the non-GAAP measures in combination with the most comparable GAAP measures in order
to better understand the amounts, character and impact of any increase or decrease on reported results.
19
THE ADT CORPORATION
GAAP to Non-GAAP Reconciliations
(Unaudited)
Net Income Before Special Items
December 26,
2014
($ in millions)
Net Income (GAAP)
$
Restructuring and other, net
$
82
2
Acquisition and integration costs
Conversion costs
72
(1)
For the
Quarters Ended
September 26,
2014
(1)
Non-recurring separation costs
Separation related other expense (income)
(2)
Pre-separation and other discrete tax items
Net Income before special items
$
77
3
2
15
(1)
$
1
-
(1)
December 27,
2013
-
12
2
-
4
3
-
3
1
89
(7)
97
86
$
$
(1)
Items have been presented net of tax of $9M for the quarter ended December 26, 2014, $11M for the quarter
ended September 26, 2014 and $6M
. for the quarter ended December 27, 2013.
(2)
Relates to the 2012 Tax Sharing Agreement between Tyco, ADT and Pentair.
Diluted EPS Before Special Items
December 26,
2014
Diluted EPS (GAAP)
$
0.41
$
0.10
0.51
(1)
Impact of special items
Diluted EPS before special items
(1)
For the
Quarters Ended
September 26,
2014
December 27,
2013
$
0.47
$
0.39
$
0.08
0.55
$
0.04
0.43
Items have been presented net of tax where applicable.
Diluted EPS Before Special Items at Cash Tax Rates
For the
Quarters Ended
Diluted EPS (GAAP)
December 26,
September 26,
December 27,
2014
2014
2013
$
0.41
$
0.47
$
0.39
Plus: Impact of income tax expense on diluted EPS
0.21
0.15
0.22
Less: Impact of income taxes paid, net of refunds
(0.03)
(0.01)
(0.02)
Diluted EPS at cash tax rates
$
0.59
$
0.14
0.73
(1)
Impact of special items
Diluted EPS before special items at cash tax rates
(1)
Items presented at cash tax rates where applicable.
$
0.61
$
0.59
$
0.18
0.79
$
0.07
0.66
20
THE ADT CORPORATION
GAAP to Non-GAAP Reconciliations (continued)
(Unaudited)
For the Twelve Months Ended
December 26,
September 26,
September 27,
2014
2014
2013
Leverage Ratio
($ in millions)
$
Net Income (GAAP)
Interest expense, net
Depreciation and intangible asset amortization
Amortization of deferred subscriber acquisition costs
Amortization of deferred subscriber acquisition revenue
EBITDA
$
Restructuring and other, net
Radio conversion costs
Non-recurring separation costs
(1)
Separation related other income
EBITDA before special items
EBITDA Margin before special items
$
$
$
421
117
121
128
221
1,066
1,040
942
133
131
123
(154)
(151)
(135)
1,660
$
1,644
$
1,689
17
(1)
7
7
64
44
12
17
23
37
1,794
38
1,767
(23)
1,690
$
51.9%
Protectron adjustment to EBITDA before special items
Pro-forma EBITDA before special items
304
192
14
Acquisition and integration costs
35
1,829
51.8%
$
2
-
$
51.1%
54
1,821
Relates to the 2012 Tax Sharing Agreement between Tyco, ADT and Pentair.
December 26,
2014
$
4
5,254
$
5,258
Current maturities of long-term debt
Long-term debt
Total Debt
Leverage Ratio
(2)
Leverage Ratio including pro-forma Protectron
(2)
$
195
Income tax expense
(1)
299
(2)
September 26,
2014
$
4
5,096
$
5,100
2.9
2.9
2.9
2.8
September 27,
2013
$
3
3,373
$
3,376
2.0
Leverage ratio is defined as the ratio of debt to trailing twelve month EBTIDA before special items or trailing twelve
month EBITDA before special items including pro-forma Protectron.
21
THE ADT CORPORATION
GAAP to Non-GAAP Reconciliations (continued)
(Unaudited)
Operating Cash Flow and FCF Before Special Items
For the
Quarters Ended
December 26,
December 27,
2014
2013
($ in millions)
Operating cash flow (GAAP)
$
369
Restructuring and other, net
Acquisition and integration costs
$
2
-
2
-
Radio conversion costs
17
1
Non-recurring separation costs
-
6
Operating cash flow before special items
$
390
$
342
Dealer generated customer accounts and bulk account
purchases
(146)
(110)
Subscriber system assets
(177)
(157)
(32)
(12)
Capital expenditures
Non-recurring separation costs for capital expenditures
FCF before special items
11
46
$
Revenue at Constant Currency
December 26,
December 27,
2014
Recurring revenue as reported
Recurring revenue at constant currency
Total revenue as reported
Total revenue at constant currency
5
68
$
For the
Quarters Ended
($ in millions)
(1)
335
(1)
(1)
2013
$
825
$
775
$
830
$
775
$
887
$
839
$
893
$
839
Constant currency revenue results are calculated by translating current period revenue in local
currency using the prior comparable period's currency conversion rate.
22
THE ADT CORPORATION
GAAP to Non-GAAP Reconciliations (continued)
(Unaudited)
SSFCF Before Special Items
For the
Quarters Ended
($ in millions)
Last quarter, annualized EBITDA before
special items (pre-SAC)
SAC required to maintain recurring revenue
September 26,
December 27,
2014
2014
2013
$
(1)
Maintenance capital expenditures
SSFCF before special items
(1)
December 26,
2,232
$
(1,329)
(10)
893
$
2,264
$
(1,288)
(10)
966
$
2,096
(1,299)
(10)
787
$
SAC required to maintain recurring revenue is calculated as follows:
For the
Quarters Ended
($ in millions)
Last quarter average recurring revenue under
contract for the period
Trailing twelve month disconnects net of price
December 26,
September 26,
December 27,
2014
2014
2013
$
(2)
escalation
Last quarter gross recurring revenue creation
$
14.6%
(3)
multiple
SAC required to maintain recurring revenue
275
$
33.1
1,329
273
$
14.7%
$
32.1
1,288
258
14.9%
$
33.8
1,299
(2)
Average trailing twelve month recurring revenue disconnected net of price escalations. Disconnects account for
dealer chargebacks.
(3)
Gross creation cost includes amount held back from dealers for chargebacks.
23
THE ADT CORPORATION
GAAP to Non-GAAP Reconciliations (continued)
(Unaudited)
EBITDA Before Special Items
For the
Quarters Ended
December 26,
September 26,
December 27,
2014
2014
2013
($ in millions)
$
Net Income (GAAP)
72
$
82
$
77
Interest expense, net
50
50
Income tax expense
36
27
43
275
273
249
Depreciation and intangible asset amortization
Amortization of deferred subscriber acquisition costs
Amortization of deferred subscriber acquisition revenue
$
EBITDA
47
34
33
32
(40)
(40)
(37)
427
$
425
$
411
48.1%
48.1%
49.0%
Restructuring and other, net
2
2
5
Acquisition and integration costs
1
4
1
23
17
3
7
5
EBITDA Margin
Radio conversion costs
-
Non-recurring separation costs
Separation related other expense
EBITDA before special items
(1)
$
EBITDA Margin before special items
Subscriber acquisition cost expenses, net of related revenue
EBITDA before special items (pre-SAC)
$
EBITDA Margin before special items (pre-SAC)
Revenue (GAAP)
453
$
3
458
$
1
426
51.1%
51.9%
50.8%
105
558
108
566
98
524
66.4%
67.8%
66.6%
$
887
$
883
$
839
Subscriber acquisition cost related revenue
Revenue (pre-SAC)
$
(47)
840
$
(48)
835
$
(52)
787
EBITDA before special items
$
453
$
458
$
426
Effect of Protectron on EBITDA before special items
EBITDA before special items excluding Protectron
$
(13)
440
$
(11)
447
$
426
Revenue (GAAP)
$
887
$
883
$
839
$
(36)
851
$
(33)
850
$
839
Effect of Protectron on revenue
Revenue excluding Protectron
EBITDA Margin before special items excluding Protectron
(1)
Relates to the 2012 Tax Sharing Agreement between Tyco, ADT and Pentair.
51.7%
52.6%
50.8%
24


© Copyright 2026