
Construction of very high resolution DTMs based on NAC images
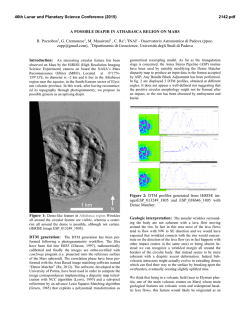
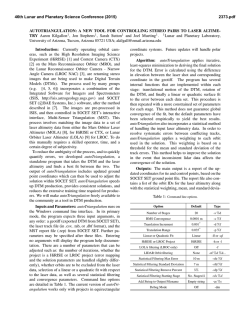
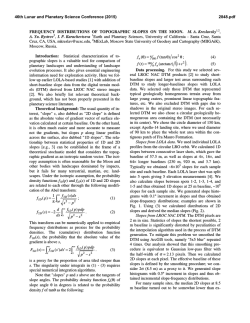
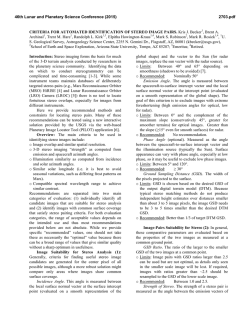
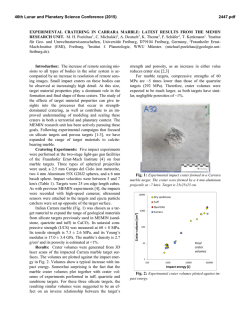
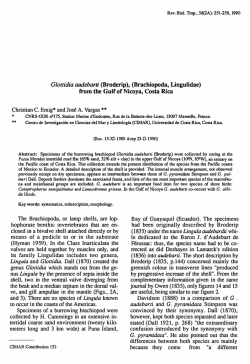
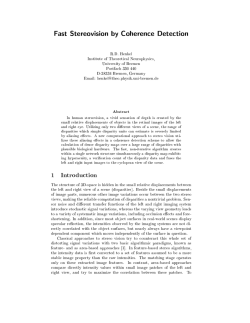
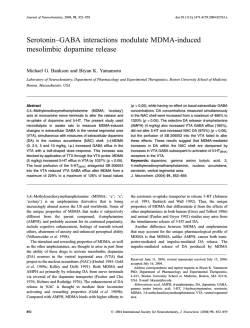
46th Lunar and Planetary Science Conference (2015)
1787.pdf
Construction of very high resolution DTMs based on NAC images using stereo analysis and shape from shading: A first glance. A. Grumpe1, C. Wöhler1, M. Liu2 and B. Wu2, 1Image Analysis Group, TU Dortmund, 44227
Dortmund, Germany ([email protected]), 2Department of Land Surveying & Geo-Informatics, The Hong
Kong Polytechnic University, Hung Hom, Kowloon, Hong Kong ([email protected]).
Figure 1: NAC image
M173246166L.
The
yellow lines show the
positions of the vertical
(Fig. 2) and the horizontal (Fig. 3) profiles,
respectively. The yellow rectangle shows
the location of the
crater displayed in
Fig. 4.
Introduction: The construction of high-resolution and highprecision lunar digital terrain
maps (DTM) is essential to scientific research, e.g. morphologic
analysis and planning of future
landing scenarios. Here we present a method that combines stereo analysis [1] and shape from
shading (SfS) [2]. The overall
algorithm is applied to Lunar
Reconnaissance Orbiter (LRO)
Narrow Angle Camera (NAC)
images to derive DTMs of an
effective lateral resolution of
approximately 0.5 m.
Construction of DTMs:
The full-resolution DTM is constructed by subsequently applying a block-matching based stereo analysis and a SfS algorithm
that recovers the topography
from shading information while
being restricted to a DTM of
lower lateral resolution.
Stereo analysis. To construct
the initial DTM, we apply the
self-adaptive triangle-constrained
image matching agorithm [3, 4].
At first, robust points are
matched using the SIFT algorithm [5] and a RANSAC approach [1], and triangulations
covering the overlapping area of
the stereo images are created. A
Harris-Laplace detector [6] is
then applied to find interest
points that are matched using a
cross-correlation algorithm. Finally, the triangulations are dynamically updated using the newly matched points. The interest
point matching is followed by a
dense matching constrained by
the triangulations to generate
reliable and dense matching results. 3D coordinates of the
matched points are obtained
through the photogrammetric intersection based on the
orientation parameters of the NAC images, as retrieved
from the SPICE ("Spacecraft, Planet, Instrument, Cmatrix, Events") kernels [7]. A DTM with a resolution
of 1.5 m is interpolated from the 3D points.
Shape-from-shading (SfS). The applied SfS algorithm is a combination of a previously published SfS
algorithm [8] and the retrieval of a DTM from a gradient field with respect to a DTM of lower lateral resolution that is known a-priori [9]. The algorithms are
combined by replacing the gradient field integration
step given in [8] with the equation presented in [9].
First, the surface gradient field is estimated based on
the reflectance information of the image and DTM information of lower lateral resolution. Second, the initial DTM is updated using the gradient field of the first
step and the update equation [9]. Both steps are repeated until the updated DTM does no longer change or the
value of the error function does not decrease any more.
Evaluation: Applying the stereo analysis, a DTM
of 1.5 m lateral resolution has been derived from NAC
image M173246166L. The image is shown in Fig. 1.
To estimate the improvements of the DTM after application of the SfS algorithm, we compared the stereobased DTM and the SfS-based DTM for overall consistency and small-scale details. Prior to the analysis,
the NAC image and the SfS-based DTM are resized to
match the size of the stereo-based DTM.
Figure 2: The vertical profile of the DTMs along the
vertical line marked in Fig. 1. The SfS-based DTM
(black line) and the stereo-based DTM (red dashed
line) are in very good agreement. The three rille
troughs are clearly shown in both DTMs.
46th Lunar and Planetary Science Conference (2015)
Figure 3: The horizontal profile of the DTMs along the
horizontal line marked in Fig. 1. The SfS-based DTM
(black line) and the stereo-based DTM (red dashed
line) are in very good agreement. The SfS-based DTM,
however, shows jumps and drops at the image edges..
Overall consistency. The vertical and the horizontal profile marked in Fig. 1 are shown in Fig. 2 and
Fig. 3, respectively. Both figures show a very good
agreement between the DTMs. The horizontal profile
shows two large jumps and drops in the SfS-based
DTM that originate from the image edges. This is a
well-known behavior of SfS algorithms and is limited
to the local area next to the image boundary.
Small-scale analysis. The region around the crater
marked in Fig. 1 is shown in Fig. 4. The profile
(Fig. 4b) and the color coded DTMs (Fig. 4c-d) show
that the SfS-based DTM recovers the triangulation artifacts at the crater floor. However, it introduces rippleshaped artifacts in regions where the original NAC
image shows small shadows that are cast by rocks
along the crater rim.
Conclusion: In this study we have shown that SfS
may be applied to improve the small-scale details of
stereo analysis based DTMs while the overall consistency is kept. The SfS algorithm shows smaller features and removes artifacts of the blockmatching procedure. However, it also reflects the image noise within
the DTM and may produce undesirable artifacts in
shadowed areas. Future work will include the replacement of the stereo-based DTM by laser altimetry and a
further assessment of the vertical accuracy.
References: [1] Hartley, R. and Zisserman, A.
(2003) Multiple View Geometry in Computer Vision,
Cambridge University Press. [2] Horn, B. K. P. (1990)
International Journal of Computer Vision 5(1), 37-75.
[3] Wu, B., Zhang, Y. and Zhu, Q. (2011) IEEE Trans.
on Geoscience and Remote Sensing, 77(7), 695–708.
[4] Wu, B., Zhang, Y. and Zhu, Q. (2012) ISPRS Journal of Photogrammetry and Remote Sensing, 68, 40–
55. [5] Lowe, D. G. (2004) International Journal of
1787.pdf
Figure 4: The region of interest around the crater marked
in Fig. 1. (a) NAC image of the crater. (b) Profile of the
SfS-based and the stereo-based DTM, respectively. The
profile follows the yellow line in (a). (c)-(d) SfS-based and
stereo-based DTM, respectively. The height is color-coded
and a Lambertian shading is overlaid. It is clearly visible
that the SfS-based DTM recovers the data where the stereo-based DTM shows artifacts. There are, however, minor artifacts in the SfS-based DTM where the original
image shows cast shadows.
Computer Vision, 60(2), 91-110. [6] Zhu, Q., Wu, B.
and Wan, N. (2007) Photogrammetric Engineering &
Remote Sensing, 62(4), 295-308. [7] Acton, C. (1998)
http://pirlwww.lpl.arizona.edu/resources/guide/
software/SPICE/old_tutorials/SPICE_Overview.pdf
[8] Grumpe, A., Belkhir, F. and Wöhler, C. (2014),
Advances in Space Research, 53(12), 1735-1767.
[9] Grumpe, A. and Wöhler, C. (2014) ISPRS Journal
of Photogrammetry and Remote Sensing, 94, 37-54.


© Copyright 2026