
TABLASICM201412 ParaPDF.xlsx
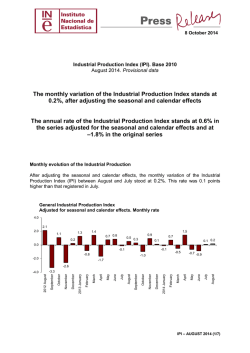
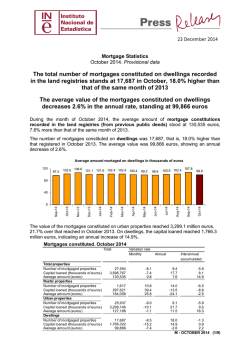
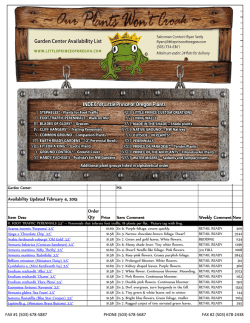
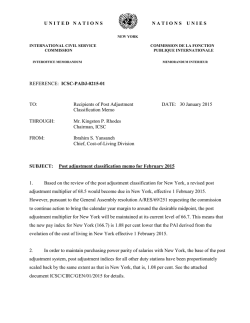
29 January 2015
Retail Trade Indices (RTI). Base 2010
December 2014 and year 2014. Provisional data
The monthly change of the Retail Trade Index at constant prices
stands at 1.2% after adjusting for seasonal and calendar effects
The annual rate of the General Retail Trade Index at constant prices
stands at 6.5% in the series adjusted for seasonal and calendar
effects and at 5.4% in the original series
In the year 2014 as whole, retail sales increase by 1.0% in the
adjusted series, and by 0.9% in the original series
Monthly evolution of sales in Retail Trade
The monthly evolution of the General Retail Trade Index at constant prices between the
months of December and November stood at 1.2% after adjusting for seasonal and calendar
effects. This rate was eight tenths lower than that registered in the previous month.
General Index of Retail Trade at constant prices
Adjusted for seasonally and calendar effects. Monthly Rate
6.0
4.0
0.7
1.2
1.0
0.9
2.6
2.1
2.0
2.0
1.2
0.5
0.1
2.0
1.2
0.8
0.1
0.1
0.0
-2.0
-0.3
-0.6
-0.4
-0.3
-0.8
-0.6
-0.8
-1.9
-2.5
-4.0
-3.2
-6.0
-8.0
-10.0
December
November
October
September
August
July
June
May
April
March
February
2014 January
December
November
October
September
August
July
June
May
April
March
February
2013 January
2012 December
-12.0
RTI – DECEMBER 2014 (1/8)
The general index, not including service stations, registered a monthly rate of 0.8%. By
products, Food increased by 0.9% and Non-food products did so by 0.7%. By type of
product, Other goods registered the greatest increase (1.0%).
Sales Indices at constant prices: General and by type of products.
Adjusted for seasonal and calendar effects. Monthly rate
GENERAL INDEX
1.2
1. Service Stations
3.8
2. GENERAL INDEX WITHOUT SERVICE STATIONS
0.8
2.1. Food
0.9
2.2. Non-food products
0.7
2.2.1 Personal equipment
0.8
2.2.2 Household equipment -0.2
2.2.3 Other goods
1.0
Three out of the distribution classes analised presented positive rates as compared to the
previous month.
Single retail stores registered the greatest monthly increase (1.7%), while Department stores
was the only one to decrease (–0.2%).
Sales indices at constant prices by distribution class
Adjusted for seasonal and calendar effects. Monthly rate
1.7
Single retail stores
0.5
Small chain stores
0.2
Large chain stores
Department stores
-0.2
RTI – DECEMBER 2014 (2/8)
Annual evolution of sales in retail trade
In December, the General Retail Trade Index registered a variation of 6.5% as compared to
the same month of 2013, after adjusting the seasonal and calendar effects. This annual rate
was 4.6 points over that registered in November.
The original series of the RTI at constant prices registered a 5.4% variation as compared to
December 2013, standing 5.1 points over the rate of November.
In 2014 as a whole, retail sales increased by 1.0% in the series adjusted for seasonal and
calendar effects, and by 0.9% in the original series.
Retail Trade General Index at constant prices
Annual rate
8.0
6.5
6.0
5.4
4.0
2.0
2.1
0.0
0.5
0.0
-0.5
-2.0
2.7
2.0
1.8
-0.1
-0.9 -0.3
-0.4
1.1
0.8
0.6
0.4
0.3 0.0
-0.2
-0.2
-0.9
0.8
0.5
0.1
-0.3
-0.3
1.9
1.1
1.9
0.3
-1.7
-2.5
-3.3
-4.0
-4.6
-6.0
-8.7
-9.6
-10.0
-8.5
December
November
October
September
August
July
June
May
April
March
February
December
November
October
2014 January
Original
September
August
July
June
May
April
February
2013 January
March
-10.3
-10.8
-10.9
-10.8
2012 December
-4.5
-5.1
-6.9
-7.6
-8.0
-12.0
-4.5
-4.9 -5.1
Adjusted for seasonal and calendar effects
The General Index, not including service stations, and after adjusting the seasonal and
calendar effects, registered an annual change of 4.7% in December.
The variation for the whole 2014 year was 0.9%.
Annual rates of national index at constant prices, by products and by distribution
class
Original index
Seasonally adjusted index
Annual rate (%)
GENERAL INDEX
1. Service stations
2. GENERAL INDEX WITHOUT SERVICE STATIONS
2.1. Food
2.2. Non-food products
2.2.1 Personal equipment
2.2.2 Household equipment
2.2.3 Other goods
Annual rate (%)
Average year 2014
5.4
5.4
6.5
6.0
1.0
1.2
4.7
3.9
5.4
4.6
6.5
4.2
4.7
4.9
6.4
5.0
8.2
5.1
0.9
0.8
1.5
2.4
2.9
-0.1
4.7
2.7
5.5
5.1
5.7
4.5
6.9
4.2
0.2
1.6
0.7
1.2
DISTRIBUTION CLASS
3. Single retail stores
4. Small chain stores
5. Large chain stores
6. Department stores
RTI – DECEMBER 2014 (3/8)
Results by Autonomous Community. Annual variation rates in sales. Original
series
In December, all Autonomous Communities increased their sales as compared to the same
month of 2013. The greatest increases were recorded in Illes Balears (9.4%) and Cantabria
(8.8%).
In 2014 as a whole, sales increased in 12 Autonomous Communities. Canarias (4.6%) and
Illes Balears (3.2%) recorded the highest rates.
General Index by Autonomous City and Community
Annual rate and sales average rate
9.4
Balears, Illes
3.2
8.8
Cantabria
2.4
7.4
Cataluña
1.4
7.1
Canarias
4.6
6.6
Comunitat Valenciana
2.1
6.4
Navarra, Comunidad Foral de
1.5
6.1
Murcia, Región de
1.4
5.4
NATIONAL
0.9
5.1
Melilla
1.1
4.7
Madrid, Comunidad de
-0.2
4.6
Andalucía
0.8
4.5
Rioja, La
0.7
4.1
País Vasco
1.5
3.8
Asturias, Principado de
-0.5
3.8
Castilla - La Mancha
0.5
3.7
Galicia
0.0
3.7
Ceuta
1.6
3.5
Extremadura
0.1
3.3
Aragón
-2.0
3.3
Castilla y León
-1.5
Annual
Average 2014
RTI – DECEMBER 2014 (4/8)
Evolution of employment
In December, the employment index in the retail trade sector registered a variation of 0.8%,
as compared to the same month of 2013. This rate was one tenth over that registered in
November. In 2014 as a whole, employment increased by 0.1%.
Employment Indices: General and by distribution class
Index
GENERAL INDEX
1. Service stations
Rate (%)
Monthy
Annual
96.7
91.9
96.9
98.7
86.3
102.6
97.0
2. GENERAL INDEX WITHOUT SERVICE STATIONS
2.1. Single retail stores
2.2. Small chain stores
2.3. Large chain stores
2.4. Department stores
Year-to-date
average
1.1
-0.4
1.2
0.5
1.1
1.6
4.3
0.8
-1.0
0.9
1.7
-1.0
0.2
1.8
0.1
-1.6
0.2
0.8
-1.8
0.0
0.6
Results by Autonomous Community. Annual variation rates in employment
In December, employment in retail trade increased its annual rate in 13 Autonomous
Communities. Cantabria (2.3%) was the one to register the greatest increase. In 2014 as a
whole, employment increased in 10 Autonomous Communities.
General Index by Autonomous City and Community
Annual rate and employment average rate
Cantabria
Extremadura
2.0
0.4
1.7
Cataluña
0.8
1.6
1.8
Balears, Illes
Murcia, Región de
1.5
-0.9
1.2
Ceuta
0.6
1.0
Andalucía
0.3
1.0
Castilla - La Mancha
0.4
Navarra, Comunidad Foral de
1.0
-0.1
0.9
Comunitat Valenciana
0.3
0.9
Melilla
0.3
NATIONAL
0.1
País Vasco
0.1
Castilla y León
0.5
1.6
-0.4
0.2
0.0
-1.3
-0.9
-0.2
-0.3
-0.2
Aragón
Rioja, La
0.6
0.4
Galicia
Asturias, Principado de
0.8
-0.4
Canarias
Madrid, Comunidad de
2.3
1.1
-0.9
Annual
0.3
Average 2014
RTI – DECEMBER 2014 (5/8)
Retail Trade Indices. Base 2010
December 2014
Provisional data
1. Sales indices: General, by products and by distribution class
Adjusted for seasonal and calendar effects
Index
GENERAL INDEX
1. Service stations
2. GENERAL INDEX WITHOUT
SERVICE STATIONS
2.1. Food
2.2. Non-food products
2.2.1 Personal equipment
2.2.2 Household equipment
2.2.3 Other goods
DISTRIBUTION CLASS
3. Single retail stores
4. Small chain stores
5. Large chain stores
6. Department stores
Rate (%)
Monthly
Annual
Year-to-date
average
Deflated
index
Rate (%)
Monthly
Annual
93.8
95.3
0.5
-2.9
4.2
-8.3
0.6
-2.0
87.1
85.8
1.2
3.8
6.5
6.0
1.0
1.2
93.2
102.1
87.5
90.3
82.5
88.7
0.7
0.6
0.6
0.5
-0.4
1.0
4.1
2.4
5.4
5.4
7.6
3.9
0.9
0.6
1.2
2.5
2.4
-0.3
87.1
93.3
82.8
89.7
80.8
83.9
0.8
0.9
0.7
0.8
-0.2
1.0
4.7
4.9
6.4
5.0
8.2
5.1
0.9
0.8
1.5
2.4
2.9
-0.1
87.8
88.8
107.1
89.3
1.6
0.6
-0.2
-0.2
5.1
3.9
6.3
3.7
0.2
1.6
0.7
1.2
82.1
82.8
100.2
83.3
1.7
0.5
0.2
-0.2
5.7
4.5
6.9
4.2
0.2
1.6
0.7
1.2
2. Sales indices: General, by products and by distribution class.
Adjusted for calendar effects
Index
GENERAL INDEX
1. Service stations
2. GENERAL INDEX WITHOUT
SERVICE STATIONS
2.1. Food
2.2. Non-food products
2.2.1 Personal equipment
2.2.2 Household equipment
2.2.3 Other goods
DISTRIBUTION CLASS
3. Single retail stores
4. Small chain stores
5. Large chain stores
6. Department stores
Year-to-date
average
Rate (%)
Annual
Year-to-date
average
Deflated
index
Rate (%)
Annual
Year-to-date
average
111.8
94.3
4.2
-8.6
0.7
-1.9
103.2
88.0
6.7
6.1
1.1
1.3
113.3
121.3
108.0
114.9
99.2
109.2
5.3
4.8
5.7
5.9
7.7
4.6
1.1
0.8
1.3
2.5
2.5
-0.3
104.4
110.6
100.0
104.8
96.8
101.1
6.0
4.9
6.9
5.8
8.3
5.6
1.1
0.9
1.5
2.3
3.1
-0.1
99.3
106.6
127.7
129.8
5.4
3.6
6.4
5.2
0.2
1.6
0.7
1.5
91.5
98.3
117.7
119.6
6.1
4.3
7.0
5.9
0.2
1.6
0.7
1.5
3. Sales indices: General, by products and by distribution class Original Series
Index
Rate (%)
Annual
Deflated
index
Year-to-date
average
Rate (%)
Annual
Year-to-date
average
GENERAL INDEX
1. Service stations
111.5
94.2
3.0
-9.2
0.5
-2.0
103.0
87.9
5.4
5.4
0.9
1.2
2. GENERAL INDEX WITHOUT SERVICE
STATIONS
113.1
4.1
0.9
104.2
4.7
0.9
121.0
107.8
114.8
98.9
109.0
3.7
4.4
4.8
5.8
3.2
0.6
1.0
2.3
2.2
-0.5
110.4
99.7
104.6
96.5
100.8
3.9
5.4
4.6
6.5
4.2
0.8
1.2
2.1
2.8
-0.3
99.1
106.4
127.4
129.6
141.1
124.1
4.1
2.1
4.8
4.4
0.9
6.4
0.1
1.4
0.5
1.3
-0.5
2.3
91.3
98.0
117.4
119.4
128.7
114.8
4.7
2.7
5.5
5.1
1.2
7.4
0.0
1.4
0.5
1.3
-0.3
2.5
2.1. Food
2.2. Non-food products
2.2.1 Personal equipment
2.2.2 Household equipment
2.2.3 Other goods
DISTRIBUTION CLASS
2.1. Single retail stores
2.2. Small chain stores
2.3. Large chain stores
2.4. Department stores
2.4.1. Food
2.4.2. Non-food products
4. Sales indices: National and by Autonomous City and Community Original
Series
Index
NATIONAL
Andalucía
Aragón
Asturias, Principado de
Balears, Illes
Canarias
Cantabria
Castilla y León
Castilla - La Mancha
Cataluña
Comunitat Valenciana
Extremadura
Galicia
Madrid, Comunidad de
Murcia, Región de
Navarra, Comunidad Foral de
País Vasco
Rioja, La
Ceuta
Melilla
111.5
106.9
110.2
106.3
108.6
125.4
112.2
109.4
105.5
114.8
111.0
113.6
113.5
112.1
102.5
113.8
113.2
114.4
112.0
110.8
Rate (%)
Annual
3.0
2.2
1.0
1.3
7.1
4.8
6.0
0.7
0.8
5.2
4.0
1.1
1.6
2.1
3.3
3.7
2.1
2.3
2.6
4.0
Deflated
index
Year-to-date
average
0.5
0.4
-2.4
-1.2
3.1
3.6
1.8
-1.9
-0.4
1.3
1.6
-0.7
-0.2
-0.8
0.8
0.6
1.3
0.3
1.2
0.4
Rate (%)
Annual
103.0
98.8
102.1
97.9
100.0
119.3
102.2
99.9
97.4
104.8
102.7
105.1
104.4
104.5
94.5
105.8
104.5
104.2
105.3
105.1
5.4
4.6
3.3
3.8
9.4
7.1
8.8
3.3
3.8
7.4
6.6
3.5
3.7
4.7
6.1
6.4
4.1
4.5
3.7
5.1
Year-to-date
average
0.9
0.8
-2.0
-0.5
3.2
4.6
2.4
-1.5
0.5
1.4
2.1
0.1
0.0
-0.2
1.4
1.5
1.5
0.7
1.6
1.1
5. Employment Indices: General and by distribution class
Index
GENERAL INDEX
1. Service stations
Rate (%)
Monthly
96.7
91.9
96.9
98.7
86.3
102.6
97.0
2. GENERAL INDEX WITHOUT SERVICE STATIONS
2.1. Single retail stores
2.2. Small chain stores
2.3. Large chain stores
2.4. Department stores
Annual
1.1
-0.4
1.2
0.5
1.1
1.6
4.3
Year-to-date
average
0.8
-1.0
0.9
1.7
-1.0
0.2
1.8
0.1
-1.6
0.2
0.8
-1.8
0.0
0.6
6. Employment Indices: National and by Autonomous City and
Community
Index
NATIONAL
Andalucía
Aragón
Asturias, Principado de
Balears, Illes
Canarias
Cantabria
Castilla y León
Castilla - La Mancha
Cataluña
Comunitat Valenciana
Extremadura
Galicia
Madrid, Comunidad de
Murcia, Región de
Navarra, Comunidad Foral de
País Vasco
Rioja, La
Ceuta
Melilla
For further information see INEbase - www.ine.es/en/
Press Office: Telephone numbers: 91 583 93 63 / 94 08
Information Area: Telephone number: 91 583 91 00
Rate (%)
Monthly
96.7
93.1
95.8
93.0
98.0
102.9
99.3
97.7
97.9
99.1
98.1
100.2
97.3
94.5
93.7
95.8
97.1
98.3
101.0
101.9
Annual
1.1
1.0
1.3
1.2
-0.4
1.2
1.1
0.8
1.0
1.0
1.4
3.1
1.4
1.7
0.7
0.7
0.4
1.2
1.4
0.4
Year-to-date
average
0.8
1.0
-0.3
-0.2
1.6
0.4
2.3
0.5
1.0
1.7
0.9
2.0
0.2
0.0
1.5
1.0
0.6
-0.9
1.2
0.9
All press releases at: www.ine.es/en/prensa/prensa_en.htm
Fax: 91 583 90 87 - [email protected]
Fax: 91 583 91 58 – www.ine.es/infoine/?L=1
0.1
0.3
-0.2
-0.9
1.8
1.6
1.1
-0.4
0.4
0.8
0.3
0.4
-0.4
-1.3
-0.9
-0.1
0.1
0.3
0.6
0.3


© Copyright 2026