
The total number of mortgages constituted on dwellings recorded in
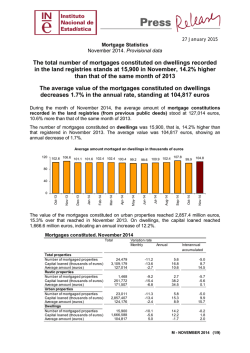
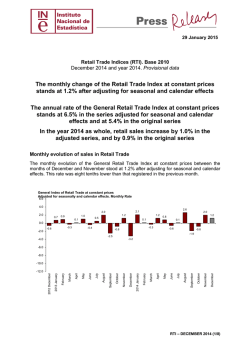
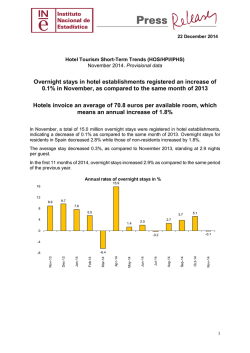
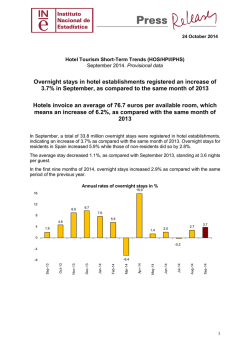
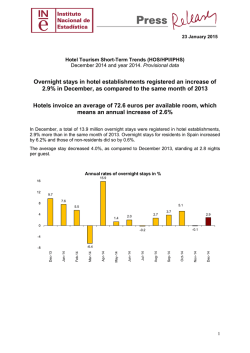
23 Decem ber 2014
Mortgage Statistics
October 2014. Provisional data
The total number of mortgages constituted on dwellings recorded
in the land registries stands at 17,687 in October, 18.0% higher than
that of the same month of 2013
The average value of the mortgages constituted on dwellings
decreases 2.6% in the annual rate, standing at 99,866 euros
During the month of October 2014, the average amount of mortgage constitutions
recorded in the land registries (from previous public deeds) stood at 130,535 euros,
7.6% more than that of the same month of 2013.
The number of mortgages constituted on dwellings was 17,687, that is, 18.0% higher than
that registered in October 2013. The average value was 99,866 euros, showing an annual
decrease of 2.6%.
97.5
102.6 106.6 101.1 101.6 102.4 102.4 100.4
99.2
98.6
Jun-14
120
May-14
Average amount mortaged on dwellings in thousands of euros
100.9 102.4
107.8
99.9
80
40
Oct-14
Sep-14
Aug-14
Jul-14
Apr-14
Mar-14
Feb-14
Jan-14
Dec-13
Nov-13
Oct-13
Sep-13
0
The value of the mortgages constituted on urban properties reached 3,299.1 million euros,
21.7% over that reached in October 2013. On dwellings, the capital loaned reached 1,766.3
million euros, indicating an annual increase of 14.9%.
Mortgages constituted. October 2014
Total
Total properties
Number of mortgaged properties
Capital loaned (thousands of euros)
Average am ount (euros)
Rustic properties
Number of mortgaged properties
Capital loaned (thousands of euros)
Average am ount (euros)
Urban properties
Number of mortgaged properties
Capital loaned (thousands of euros)
Average am ount (euros)
Dwellings
Number of mortgaged properties
Capital loaned (thousands of euros)
Average am ount (euros)
Variation rate
Monthly
Annual
Interannual
accumulated
27,554
3,596,767
130,535
-8.1
-7.4
0.8
9.4
17.7
7.6
-5.9
8.1
14.9
1,617
297,621
184,058
10.8
39.4
25.8
14.0
-13.5
-24.1
-6.5
-8.8
-2.5
25,937
3,299,146
127,198
-9.0
-10.1
-1.1
9.1
21.7
11.5
-5.9
9.5
16.3
17,687
1,766,322
99,866
-8.5
-15.2
-7.4
18.0
14.9
-2.6
-1.3
0.9
2.2
M - OCTOBER 2014 (1/9)
Mortgages constituted according to the nature of the property
According to the nature of the property, mortgages constituted on dwellings concentrated
49.1% of the total capital loaned in October.
Distribution of the capital loaned for mortgages according to the
nature of the property (%)
60
49.1
50
40
34.5
30
20
8.3
8.1
10
0
Dwellings
Lands
Other urban properties
Rustic properties
Monthly evolution of the mortgages constituted on dwellings
In order to contribute to the analysis and interpretation of the data, the following chart shows
the variation on the number of mortgages constituted on dwellings between the months of
October and September for the last five years. In 2014, the monthly rate registered a
decrease of 8.5%.
Evolution of the monthly rate of de number of mortgages constituted for the
dwellings (October variation as compared with September of the same year)
10
0.6
0
-10
-8.5
-10.9
-20
-30
-26.0
-28.7
2010
2011
2012
2013
2014
Regarding the capital loaned for mortgages constituted on dwellings, the monthly rate of
2014 was −15.2%.
Evolution of the monthly rate of the capital lent of mortgages constituted for the
dwellings (October variation as compared with September of the same year)
5.9
10
0
-10
-12.9
-20
-15.2
-30
-30.7
-40
2010
-31.5
2011
2012
2013
2014
M - OCTOBER 2014 2/9
Mortgage interest rates
92.8% of the mortgages constituted in October used a variable interest rate, as compared to
7.2% using a fixed rate. Euribor was the most used reference interest rate in constituting
mortgages with a variable interest rate, specifically in 89.7% of new contracts.
The average interest rate for the total properties was 3.78% and the average term was 21
years.
The average interest rate for mortgages constituted on dwellings was 3.60%, that is, 14.1%
less than that registered in October 2013.
4.11
4.04
3.97
3.82
3.88
3.90
3.76
3.59
3.60
Oct-14
4.14
Sep-14
4.21
Aug-14
4.29
Jul-14
4.19
Jun-14
4.15
May-14
5.00
Apr-14
Average interest rate on dwellings
4.00
3.00
2.00
1.00
Mar-14
Feb-14
Jan-14
Dec-13
Nov-13
Oct-13
Sep-13
0.00
Mortgages with registration changes
In October, the total number of mortgages with changes in their conditions recorded in the
land registries stood at 15,257, 34.2% lower than the figure recorded last year. On dwellings,
the number of mortgages with modified conditions increased 29.3%.
Considering the type of modification of conditions, in October 12,098 novations (or
modifications produced within the same financial institution) were produced, with a decrease
of 33.8%, as compared to October 2013. The number of transactions that changed
institutions (creditor subrogations) decreased 30.7%, and the number of mortgages that
changed the holder of the mortgaged property (debtor subrogations) did so by 48.4%.
Mortgages with registration changes. October 2014
Total
Total mortgages with changes
Novations
Subrogations Debtor
Subrogations Creditor
Variation rate
Inter-monthly
15,257
12,098
659
2,500
-20.0
-23.8
-19.9
5.8
Interannual
-34.2
-33.8
-48.4
-30.7
Interannual
accumulated
-14.8
-17.5
-12.4
1.2
Mortgages with changes in interest rate conditions
Of the 15,257 mortgages with changes in their conditions recorded in the land registries,
34.1% were due to changes in the interest rates.
After the change in conditions, the percentage of mortgages at a fixed interest rate
decreased from 6.6% to 2.9%, and that of mortgages at a variable interest rate increased
from 92.6% to 96.4%.
M - OCTOBER 2014 3/9
Euribor was the rate to which the greatest percentage of mortgages at a variable rate was
referenced, both before (75.1%) and after the change (86.5%).
After the changing of conditions, the average interest rate of loans in mortgages at a fixed
rate decreased by 0.56 points, and that of mortgages at a variable rate did so by 1.35 points.
Mortgages with registration changes in interest rates conditions. October 2014
Interest rate modality
Total interest rate changes
Fixed
Variable
-Euribor
Without interest
Before the change in interest rate
After the change in interes t rate
No. of
Original
Original
No. of
Final interest Final average
mortgages interest rate average
mortgages rate structure interest of
structure % interest of loan
%
loan
5,205
100.0
5,205
100.0
343
6.6
4.87
153
2.9
4.31
4,818
92.6
4.55
5,015
96.4
3.20
3,909
75.1
4.47
4,502
86.5
3.09
44
0.8
37
0.7
-
Results by Autonomous Community
The Autonomous Communities with the highest number of mortgages constituted on
dwellings in October were Andalucía (3,329), Comunidad de Madrid (2,942) and Cataluña
(2,694).
The Autonomous Communities that registered the greatest annual variation rates were
Comunitat Valenciana (46.3%), Aragón (37.1%) and Castilla-La Mancha (34.7%).
The Autonomous Communities with the greatest capital loaned for mortgages constituted on
dwellings were Comunidad de Madrid (403.2 million euros), Cataluña (295.4 million) and
Andalucía (280.1 million).
Mortgages constituted on dwellings by Autonomous City and Community. October 2014
Number
Variation rate
Monthly
TOTAL
Andalucía
Aragón
Asturias, Principado de
Balears, Illes
Canarias
Cantabria
Castilla - La Mancha
Castilla y León
Cataluña
Comunitat Valenciana
Extrem adura
Galicia
Madrid, Comunidad de
Murcia, Región de
Navarra, Com unidad Foral de
País Vasco
Rioja, La
Ceuta
Melilla
17,687
3,329
514
350
499
675
192
667
625
2,694
2,106
315
803
2,942
486
380
926
119
25
40
-8.5
0.8
-24.9
8.4
8.7
-2.2
5.5
-18.4
-1.0
-3.0
-0.2
4.7
0.0
-28.1
-8.1
1.3
-14.9
30.8
108.3
-31.0
Annual
18.0
21.9
37.1
-6.4
-4.2
7.1
20.0
1.1
34.7
18.9
46.3
28.6
-9.0
14.3
27.2
3.8
25.5
32.2
-63.2
100.0
Capital loaned
Variation rate
(thousands of euros) Monthly
Annual
1,766,322
-15.2
14.9
280,123
-5.7
18.1
47,935
-25.4
42.5
30,475
0.9
-1.7
59,194
-2.7
-5.6
54,568
0.8
-0.6
17,791
6.0
8.2
54,916
-22.2
-0.6
49,065
-0.3
34.5
295,423
-10.6
11.0
179,916
9.2
58.3
23,225
10.4
39.6
68,294
-20.6
-14.1
403,176
-34.1
15.1
35,125
-12.7
25.3
42,625
1.5
-11.0
106,169
-19.7
21.7
10,260
48.3
55.0
3,524
183.3
-68.5
4,518
13.2
92.4
M - OCTOBER 2014 4/9
The Autonomous Communities with the greatest positive monthly rates in the number of
mortgages constituted on dwellings were La Rioja (30.8%), Illes Balears (8.7%) and
Principado de Asturias (8.4%).
In turn, the Autonomous Communities registering the greatest decreases in the monthly
variation rates were Comunidad de Madrid (−28.1%), Aragón (−24.9%) and Castilla y León
(−18.4%).
Monthly variation of the number of mortgages constituted on dwellings.
October 2014
Rioja, La
30.8
Balears, Illes
8.7
Asturias, Principado de
8.4
Cantabria
5.5
Extremadura
4.7
Navarra, Comunidad Foral de
1.3
Andalucía
0.8
Galicia
0.0
Comunitat Valenciana
-0.2
Castilla - La Mancha
-1.0
Canarias
-2.2
Cataluña
-3.0
Murcia, Región de
-8.1
TOTAL
-8.5
País Vasco
-14.9
Castilla y León
Aragón
Madrid, Comunidad de
-18.4
-24.9
-28.1
M - OCTOBER 2014 5/9
Mortgages Statistics
October 2014. Provisional data
M.1 Total mortgaged rustic and urban buildings
Capital in thousands of euros
Total buildings
Number
Capital
TOTAL
Andalucía
Aragón
Asturias, Principado de
Balears, Illes
Canarias
Cantabria
Castilla y León
Castilla - La Mancha
Cataluña
Comunitat Valenciana
Extremadura
Galicia
Madrid, Comunidad de
Murcia, Región de
Navarra, Comunidad Foral de
País Vasco
Rioja, La
Ceuta
Melilla
27,554
5,905
854
521
979
1,113
277
1,172
1,148
3,743
3,146
561
1,360
3,934
750
586
1,234
181
35
55
3,596,767
695,407
78,568
43,043
134,025
98,635
55,082
155,872
141,423
532,018
308,677
49,673
137,757
796,817
59,993
113,541
159,750
25,362
4,856
6,268
Rustic buildings
Number
Capital
1,617
480
48
26
67
41
5
172
224
74
143
67
74
27
57
78
27
4
0
3
297,621
101,796
6,285
2,817
12,013
8,859
988
46,990
17,090
12,646
25,858
12,433
13,738
17,891
7,921
4,090
4,434
583
0
1,189
Urban buildings
Number
Capital
25,937
5,425
806
495
912
1,072
272
1,000
924
3,669
3,003
494
1,286
3,907
693
508
1,207
177
35
52
3,299,146
593,611
72,283
40,226
122,012
89,776
54,094
108,882
124,333
519,372
282,819
37,240
124,019
778,926
52,072
109,451
155,316
24,779
4,856
5,079
M.2 Urban buildings, according to type of building
Capital in thousands of euros
Urban buildings
Number
Capital
TOTAL
Andalucía
Aragón
Asturias, Principado de
Balears, Illes
Canarias
Cantabria
Castilla y León
Castilla - La Mancha
Cataluña
Comunitat Valenciana
Extremadura
Galicia
Madrid, Comunidad de
Murcia, Región de
Navarra, Comunidad Foral de
País Vasco
Rioja, La
Ceuta
Melilla
25,937
5,425
806
495
912
1,072
272
1,000
924
3,669
3,003
494
1,286
3,907
693
508
1,207
177
35
52
3,299,146
593,611
72,283
40,226
122,012
89,776
54,094
108,882
124,333
519,372
282,819
37,240
124,019
778,926
52,072
109,451
155,316
24,779
4,856
5,079
Dwellings
Number
17,687
3,329
514
350
499
675
192
667
625
2,694
2,106
315
803
2,942
486
380
926
119
25
40
Capital
1,766,322
280,123
47,935
30,475
59,194
54,568
17,791
54,916
49,065
295,423
179,916
23,225
68,294
403,176
35,125
42,625
106,169
10,260
3,524
4,518
Lots
Number
679
176
11
1
29
66
7
51
31
99
61
12
34
42
18
16
20
5
0
0
Other urban land
Number
Capital
Capital
291,376
69,150
1,087
147
13,928
5,646
2,882
31,145
3,733
35,212
9,254
2,084
19,295
81,347
2,591
3,948
5,728
4,199
0
0
7,571
1,920
281
144
384
331
73
282
268
876
836
167
449
923
189
112
261
53
10
12
1,241,448
244,338
23,261
9,604
48,890
29,562
33,421
22,821
71,535
188,737
93,649
11,931
36,430
294,403
14,356
62,878
43,419
10,320
1,332
561
M - OCTOBER 2014 (6/9)
October 2014. Provisional data
M.3 Rustic buildings, according to loaning bank
Capital in thousands of euros
Rustic buildings
Number
Capital
TOTAL
Andalucía
Aragón
Asturias, Principado de
Balears, Illes
Canarias
Cantabria
Castilla y León
Castilla - La Mancha
Cataluña
Comunitat Valenciana
Extremadura
Galicia
Madrid, Comunidad de
Murcia, Región de
Navarra, Comunidad Foral de
País Vasco
Rioja, La
Ceuta
Melilla
1,617
480
48
26
67
41
5
172
224
74
143
67
74
27
57
78
27
4
0
3
297,621
101,796
6,285
2,817
12,013
8,859
988
46,990
17,090
12,646
25,858
12,433
13,738
17,891
7,921
4,090
4,434
583
0
1,189
Banks
Number
833
233
21
18
49
18
5
53
71
43
94
57
55
24
30
37
20
3
0
2
Capital
172,908
59,164
2,421
2,025
8,962
1,938
988
17,527
6,694
10,248
15,120
10,757
8,368
17,166
5,194
2,591
2,365
280
0
1,100
Other banks
Number
Capital
784
247
27
8
18
23
0
119
153
31
49
10
19
3
27
41
7
1
0
1
124,713
42,632
3,864
792
3,051
6,921
0
29,463
10,396
2,398
10,738
1,676
5,370
725
2,727
1,499
2,069
303
0
89
M.4 Urban buildings, according to loaning bank
Capital in thousands of euros
Urban buildings
Number
Capital
TOTAL
Andalucía
Aragón
Asturias, Principado de
Balears, Illes
Canarias
Cantabria
Castilla y León
Castilla - La Mancha
Cataluña
Comunitat Valenciana
Extremadura
Galicia
Madrid, Comunidad de
Murcia, Región de
Navarra, Comunidad Foral de
País Vasco
Rioja, La
Ceuta
Melilla
25,937
5,425
806
495
912
1,072
272
1,000
924
3,669
3,003
494
1,286
3,907
693
508
1,207
177
35
52
3,299,146
593,611
72,283
40,226
122,012
89,776
54,094
108,882
124,333
519,372
282,819
37,240
124,019
778,926
52,072
109,451
155,316
24,779
4,856
5,079
Banks
Number
21,647
4,389
637
378
838
878
243
836
722
3,247
2,628
454
1,127
3,402
511
231
898
148
32
48
Capital
2,818,382
521,828
54,905
32,842
101,708
76,262
24,845
93,695
106,663
441,874
245,938
34,277
99,866
721,365
34,507
80,036
118,963
19,544
4,713
4,551
Other banks
Number
Capital
4,290
1,036
169
117
74
194
29
164
202
422
375
40
159
505
182
277
309
29
3
4
480,764
71,783
17,378
7,384
20,304
13,514
29,249
15,187
17,670
77,498
36,881
2,963
24,153
57,561
17,565
29,415
36,353
5,235
143
528
M - OCTOBER 2014 (7/9)
October 2014. Provisional data
M.5 Total mortgages cancelled, according to type of building
Total buildings
TOTAL
Andalucía
Aragón
Asturias, Principado de
Balears, Illes
Canarias
Cantabria
Castilla y León
Castilla - La Mancha
Cataluña
Comunitat Valenciana
Extremadura
Galicia
Madrid, Comunidad de
Murcia, Región de
Navarra, Comunidad Foral de
País Vasco
Rioja, La
Ceuta
Melilla
Rustic buildings
38,659
7,834
1,162
629
1,179
1,887
434
1,975
1,959
4,758
5,620
685
1,858
5,072
1,441
568
1,102
392
45
59
1,731
533
52
10
50
63
26
164
127
84
194
76
147
52
104
15
18
16
0
0
Dwellings
Lots
24,956
5,185
592
400
587
1,221
273
1,177
1,164
3,171
3,794
438
1,081
3,597
953
339
678
233
25
48
Other urban land
1,421
221
18
30
33
46
5
85
279
116
141
23
140
81
39
136
18
10
0
0
10,551
1,895
500
189
509
557
130
549
389
1,387
1,491
148
490
1,342
345
78
388
133
20
11
M.6 Total cancelled mortgages, according to type of building and
loaning bank
Total buildings
Banks
TOTAL
Andalucía
Aragón
Asturias, Principado de
Balears, Illes
Canarias
Cantabria
Castilla y León
Castilla - La Mancha
Cataluña
Comunitat Valenciana
Extremadura
Galicia
Madrid, Comunidad de
Murcia, Región de
Navarra, Comunidad Foral de
País Vasco
Rioja, La
Ceuta
Melilla
33,427
6,721
1,004
481
995
1,674
410
1,669
1,766
4,204
4,992
619
1,731
4,332
1,263
383
796
296
38
53
Rustic buildings
Banks
Other
banks
5,232
1,113
158
148
184
213
24
306
193
554
628
66
127
740
178
185
306
96
7
6
1,280
365
14
9
37
46
26
146
81
53
140
58
143
45
84
8
13
12
0
0
Urban buildings
Banks
Other
banks
451
168
38
1
13
17
0
18
46
31
54
18
4
7
20
7
5
4
0
0
32,147
6,356
990
472
958
1,628
384
1,523
1,685
4,151
4,852
561
1,588
4,287
1,179
375
783
284
38
53
Other
banks
4,781
945
120
147
171
196
24
288
147
523
574
48
123
733
158
178
301
92
7
6
M - OCTOBER 2014 (8/9)
October 2014. Provisional data
M.7 Total mortgages with changes, according to type of change and
type of building
Total
buildings
TOTAL
Andalucía
Aragón
Asturias, Principado de
Balears, Illes
Canarias
Cantabria
Castilla y León
Castilla - La Mancha
Cataluña
Comunitat Valenciana
Extremadura
Galicia
Madrid, Comunidad de
Murcia, Región de
Navarra, Comunidad Foral de
País Vasco
Rioja, La
Ceuta
Melilla
15,257
3,486
370
228
355
604
91
542
499
2,168
3,038
141
586
2,129
600
84
155
162
12
7
Type of change
Type of building
Novation
Subrogations Subrogations Rustic
Urban
Debtor
Creditor
buildings buildings
12,098
2,846
327
204
351
333
72
389
361
1,797
1,932
108
488
2,002
540
74
108
154
12
0
For further information see INEbase – www.ine.es/en/
659
89
28
3
1
42
0
26
48
43
284
0
7
17
26
5
31
8
0
1
2,500
551
15
21
3
229
19
127
90
328
822
33
91
110
34
5
16
0
0
6
615
204
9
21
40
15
3
21
37
20
88
8
63
28
52
3
2
1
0
0
14,642
3,282
361
207
315
589
88
521
462
2,148
2,950
133
523
2,101
548
81
153
161
12
7
Dwellings
9,315
1,933
201
122
202
455
65
279
319
1,567
1,993
84
212
1,212
426
55
93
80
11
6
All press releases at: www.ine.es/en/prensa/prensa_en.htm
Press Office: Telephone numbers: 91 583 93 63 / 94 08 – Fax: 91 583 90 87 – [email protected]
Information Area: Telephone number: 91 583 91 00 – Fax: 91 583 91 58 – www.ine.es/infoine/?L=1
M - OCTOBER 2014 (9/9)
© Copyright 2026