
The total number of mortgages constituted on dwellings recorded in
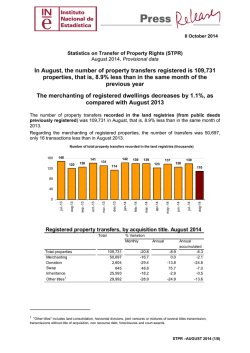
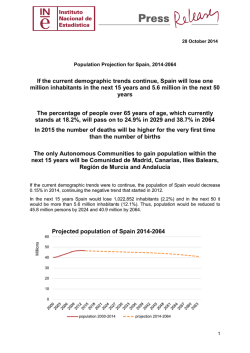
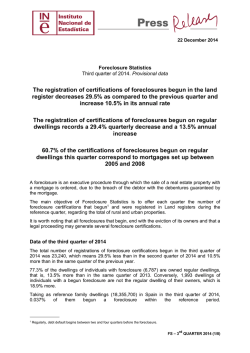
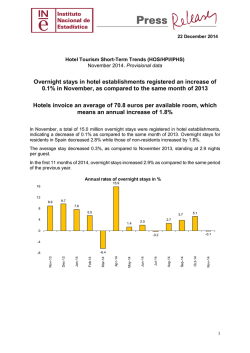
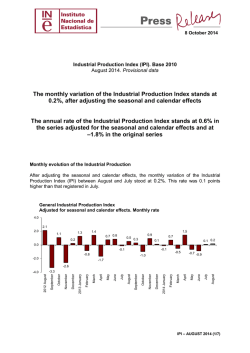
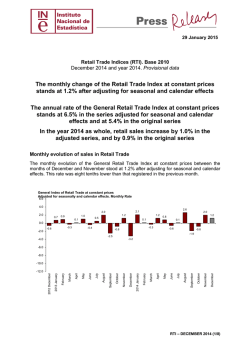
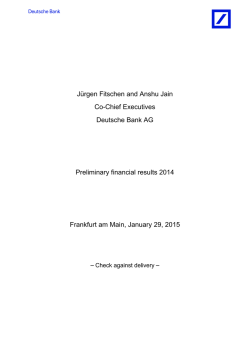
27 January 2015
Mortgage Statistics
November 2014. Provisional data
The total number of mortgages constituted on dwellings recorded
in the land registries stands at 15,900 in November, 14.2% higher
than that of the same month of 2013
The average value of the mortgages constituted on dwellings
decreases 1.7% in the annual rate, standing at 104,817 euros
During the month of November 2014, the average amount of mortgage constitutions
recorded in the land registries (from previous public deeds) stood at 127,014 euros,
10.6% more than that of the same month of 2013.
The number of mortgages constituted on dwellings was 15,900, that is, 14.2% higher than
that registered in November 2013. The average value was 104,817 euros, showing an
annual decrease of 1.7%.
102.6 106.6 101.1 101.6 102.4 102.4 100.4
99.2
98.6
Jun-14
120
May-14
Average amount mortaged on dwellings in thousands of euros
107.8
100.9 102.4
99.9
104.8
80
40
Nov-14
Oct-14
Sep-14
Aug-14
Jul-14
Apr-14
Mar-14
Feb-14
Jan-14
Dec-13
Nov-13
Oct-13
0
The value of the mortgages constituted on urban properties reached 2,857.4 million euros,
15.3% over that reached in November 2013. On dwellings, the capital loaned reached
1,666.6 million euros, indicating an annual increase of 12.2%.
Mortgages constituted. November 2014
Total
Total properties
Number of mortgaged properties
Capital loaned (thousands of euros)
Average am ount (euros)
Rustic properties
Number of mortgaged properties
Capital loaned (thousands of euros)
Average am ount (euros)
Urban properties
Number of mortgaged properties
Capital loaned (thousands of euros)
Average am ount (euros)
Dwellings
Number of mortgaged properties
Capital loaned (thousands of euros)
Average am ount (euros)
Variation rate
Monthly
Annual
Interannual
accumulated
24,479
3,109,179
127,014
-11.2
-13.6
-2.7
5.6
16.8
10.6
-5.0
8.7
14.5
1,468
251,772
171,507
-9.2
-15.4
-6.8
2.7
38.2
34.5
-5.7
-5.6
0.1
23,011
2,857,407
124,176
-11.3
-13.4
-2.4
5.8
15.3
8.9
-5.0
9.9
15.7
15,900
1,666,588
104,817
-10.1
-5.6
5.0
14.2
12.2
-1.7
-0.2
1.8
2.0
M - NOVEMBER 2014 (1/9)
Mortgages constituted according to the nature of the property
According to the nature of the property, mortgages constituted on dwellings concentrated
53.6% of the total capital loaned in November.
Distribution of the capital loaned for mortgages according to the
nature of the property (%)
60
53.6
50
40
30.3
30
20
8.1
8.0
10
0
Dwellings
Lands
Other urban properties
Rustic properties
Monthly evolution of the mortgages constituted on dwellings
In order to contribute to the analysis and interpretation of the data, the following chart shows
the variation on the number of mortgages constituted on dwellings between the months of
November and October for the last five years. In 2014, the monthly rate registered a
decrease of 10.1%, the lowest of the period considered.
Evolution of the monthly rate of de number of mortgages constituted for the
dwellings (November variation as compared with October of the same year)
40
25.2
20
11.4
0.2
0
-7.1
-10.1
-20
2010
2011
2012
2013
2014
Regarding the capital loaned for mortgages constituted on dwellings, the monthly rate of
2014 was −5.6%, also the lowest of the period.
Evolution of the monthly rate of the capital lent of mortgages constituted for the
dwellings (November variation as compared with October of the same year)
40
29.6
30
20
14.3
10
3.7
0
-3.4
-10
2010
2011
2012
2013
-5.6
2014
M - NOVEMBER 2014 2/9
Mortgage interest rates
92.6% of the mortgages constituted in November used a variable interest rate, as compared
to 7.4% using a fixed rate. Euribor was the most used reference interest rate in constituting
mortgages with a variable interest rate, specifically in 87.2% of new contracts.
The average interest rate for the total properties was 3.48% and the average term was 21
years.
The average interest rate for mortgages constituted on dwellings was 3.49%, that is, 18.6%
less than that registered in November 2013.
4.04
3.97
3.82
3.88
3.90
3.76
3.59
3.60
3.49
Nov-14
4.11
Oct-14
4.14
Sep-14
4.21
Aug-14
4.29
Jul-14
4.19
4.00
Jun-14
5.00
May-14
Average interes rate on dwellings
3.00
2.00
1.00
Apr-14
Mar-14
Feb-14
Jan-14
Dec-13
Nov-13
Oct-13
0.00
Mortgages with registration changes
In November, the total number of mortgages with changes in their conditions recorded in the
land registries stood at 14,149, 40.9% lower than the figure recorded last year. On dwellings,
the number of mortgages with modified conditions decreased 33.1%.
Considering the type of modification of conditions, in November 11,115 novations (or
modifications produced within the same financial institution) were produced, with a decrease
of 42.0%, as compared to November 2013. The number of transactions that changed
institutions (creditor subrogations) decreased 39.7%, and the number of mortgages that
changed the holder of the mortgaged property (debtor subrogations) did so by 23.8%.
Mortgages with registration changes. November 2014
Total
Total mortgages with changes
Novations
Subrogations Debtor
Subrogations Creditor
Variation rate
Inter-monthly
14,149
11,115
759
2,275
-7.3
-8.1
15.2
-9.0
Interannual
-40.9
-42.0
-23.8
-39.7
Interannual
accum ulated
-17.3
-19.8
-13.5
-3.5
Mortgages with changes in interest rate conditions
Of the 14,149 mortgages with changes in their conditions recorded in the land registries,
37.2% were due to changes in the interest rates.
After the change in conditions, the percentage of mortgages at a fixed interest rate
decreased from 5.7% to 3.4%, and that of mortgages at a variable interest rate increased
from 93.3% to 95.9%.
M - NOVEMBER 2014 3/9
Euribor was the rate to which the greatest percentage of mortgages at a variable rate was
referenced, both before (78.7%) and after the change (86.7%).
After the changing of conditions, the average interest rate of loans in mortgages at a fixed
rate decreased by 1.17 points, and that of mortgages at a variable rate did so by 1.37 points.
Mortgages with registration changes in interest rates conditions. November 2014
Interest rate modality
Total interest rate changes
Fixed
Variable
-Euribor
Without interest
Before the change in
No. of
Original
mortgages interest rate
structure %
5,259
100.0
301
5.7
4,907
93.3
4,140
78.7
51
1.0
interest rate
Original
average
interest of loan
4.71
4.54
4.46
-
After the change in interest rate
No. of
Final interest Final average
mortgages rate structure interest of
%
loan
5,259
100.0
177
3.4
3.54
5,043
95.9
3.17
4,561
86.7
3.08
39
0.7
-
Results by Autonomous Community
The Autonomous Communities with the highest number of mortgages constituted on
dwellings in November were Andalucía (3,183), Comunidad de Madrid (2,565) and Cataluña
(2,264).
The Autonomous Communities that registered the greatest annual variation rates were La
Rioja (106.3%), Extremadura (35.6%) and País Vasco (27.6%).
The Autonomous Communities with the greatest capital loaned for mortgages constituted on
dwellings were Comunidad de Madrid (382.9 million euros), Andalucía (288.7 million) and
Cataluña (261.1 million).
Mortgages constituted on dwellings by Autonomous City and Community. November 2014
Number
TOTAL
Andalucía
Aragón
Asturias, Principado de
Balears, Illes
Canarias
Cantabria
Castilla - La Mancha
Castilla y León
Cataluña
Comunitat Valenciana
Extrem adura
Galicia
Madrid, Comunidad de
Murcia, Región de
Navarra, Com unidad Foral de
País Vasco
Rioja, La
Ceuta
Melilla
15,900
3,183
455
299
419
771
144
624
597
2,264
1,743
301
707
2,565
425
236
967
163
13
24
Variation rate
Monthly
Annual
-10.1
14.2
-4.4
24.9
-11.5
19.4
-14.6
4.5
-16.0
-12.7
14.2
26.0
-25.0
-24.2
-6.4
10.2
-4.5
13.9
-16.0
16.6
-17.2
16.4
-4.4
35.6
-12.0
-17.1
-12.8
7.6
-12.6
21.8
-37.9
9.3
4.4
27.6
37.0
106.3
-48.0
-31.6
-40.0
26.3
Capital loaned
Variation rate
(thousands of euros) Monthly
Annual
1,666,588
-5.6
12.2
288,700
3.1
26.0
41,934
-12.5
35.3
26,507
-13.0
-5.0
47,518
-19.7
-51.1
60,079
10.1
17.4
13,143
-26.1
-28.1
52,562
-4.3
2.6
51,313
4.6
34.1
261,111
-11.6
21.5
156,448
-13.0
22.4
22,074
-5.0
28.2
62,810
-8.0
-12.2
382,935
-5.0
7.2
31,875
-9.3
25.3
23,219
-45.5
-14.8
121,394
14.3
37.6
18,803
83.3
160.4
1,924
-45.4
15.4
2,239
-50.4
-2.7
M - NOVEMBER 2014 4/9
The Autonomous Communities with the greatest monthly rates in the number of mortgages
constituted on dwellings were La Rioja (37.0%), Canarias (14.2%) and País Vasco (4.4%).
In turn, the Autonomous Communities registering the greatest decreases in the monthly
variation rates were Comunidad Foral de Navarra (−37.9%), Cantabria (−25.0%) and
Comunitat Valenciana (−17.2%).
Monthly variation of the number of mortgages constituted on dwellings.
November 2014
Rioja, La
37.0
Canarias
14.2
País Vasco
4.4
Andalucía
-4.4
Extremadura
-4.4
Castilla - La Mancha
-4.5
Castilla y León
-6.4
TOTAL
-10.1
Aragón
-11.5
Galicia
-12.0
Murcia, Región de
-12.6
Madrid, Comunidad de
-12.8
Asturias, Principado de
-14.6
Cataluña
-16.0
Balears, Illes
-16.0
Comunitat Valenciana
-17.2
Cantabria
Navarra, Comunidad Foral de
-25.0
-37.9
M - NOVEMBER 2014 5/9
Mortgages Statistics
November 2014. Provisional data
M.1 Total mortgaged rustic and urban buildings
Capital in thousands of euros
Total buildings
Number
Capital
TOTAL
Andalucía
Aragón
Asturias, Principado de
Balears, Illes
Canarias
Cantabria
Castilla y León
Castilla - La Mancha
Cataluña
Comunitat Valenciana
Extremadura
Galicia
Madrid, Comunidad de
Murcia, Región de
Navarra, Comunidad Foral de
País Vasco
Rioja, La
Ceuta
Melilla
24.479
4.747
788
451
681
1.299
203
1.037
1.084
3.239
2.577
490
1.310
3.607
665
341
1.650
260
19
31
3.109.179
555.053
79.799
54.779
91.951
204.252
18.845
88.639
153.117
411.848
241.326
62.296
115.213
623.882
67.763
36.252
275.315
23.487
2.806
2.556
Rustic buildings
Number
Capital
1.468
390
59
25
56
34
6
121
163
69
112
87
72
3
69
26
172
4
0
0
251.772
72.115
6.739
2.276
17.368
5.268
538
9.790
35.126
10.879
10.482
31.290
7.230
135
9.620
1.767
30.414
735
0
0
Urban buildings
Number
Capital
23.011
4.357
729
426
625
1.265
197
916
921
3.170
2.465
403
1.238
3.604
596
315
1.478
256
19
31
2.857.407
482.938
73.060
52.503
74.583
198.984
18.307
78.849
117.991
400.969
230.844
31.006
107.983
623.747
58.143
34.485
244.901
22.752
2.806
2.556
M.2 Urban buildings, according to type of building
Capital in thousands of euros
Urban buildings
Number
Capital
TOTAL
Andalucía
Aragón
Asturias, Principado de
Balears, Illes
Canarias
Cantabria
Castilla y León
Castilla - La Mancha
Cataluña
Comunitat Valenciana
Extremadura
Galicia
Madrid, Comunidad de
Murcia, Región de
Navarra, Comunidad Foral de
País Vasco
Rioja, La
Ceuta
Melilla
23.011
4.357
729
426
625
1.265
197
916
921
3.170
2.465
403
1.238
3.604
596
315
1.478
256
19
31
2.857.407
482.938
73.060
52.503
74.583
198.984
18.307
78.849
117.991
400.969
230.844
31.006
107.983
623.747
58.143
34.485
244.901
22.752
2.806
2.556
Dwellings
Number
15.900
3.183
455
299
419
771
144
624
597
2.264
1.743
301
707
2.565
425
236
967
163
13
24
Capital
1.666.588
288.700
41.934
26.507
47.518
60.079
13.143
52.562
51.313
261.111
156.448
22.074
62.810
382.935
31.875
23.219
121.394
18.803
1.924
2.239
Lots
Number
843
189
123
5
12
128
6
22
122
66
18
15
38
33
9
5
48
4
0
0
Other urban land
Number
Capital
Capital
247.363
73.067
18.461
2.982
2.702
19.277
1.442
4.959
7.541
18.468
3.923
2.482
3.698
38.925
2.499
870
45.280
787
0
0
6.268
985
151
122
194
366
47
270
202
840
704
87
493
1.006
162
74
463
89
6
7
943.456
121.171
12.665
23.014
24.363
119.628
3.722
21.328
59.137
121.390
70.473
6.450
41.475
201.887
23.769
10.396
78.227
3.162
882
317
M - NOVEMBER 2014 (6/9)
November 2014. Provisional data
M.3 Rustic buildings, according to loaning bank
Capital in thousands of euros
Rustic buildings
Number
Capital
TOTAL
Andalucía
Aragón
Asturias, Principado de
Balears, Illes
Canarias
Cantabria
Castilla y León
Castilla - La Mancha
Cataluña
Comunitat Valenciana
Extremadura
Galicia
Madrid, Comunidad de
Murcia, Región de
Navarra, Comunidad Foral de
País Vasco
Rioja, La
Ceuta
Melilla
1.468
390
59
25
56
34
6
121
163
69
112
87
72
3
69
26
172
4
0
0
251.772
72.115
6.739
2.276
17.368
5.268
538
9.790
35.126
10.879
10.482
31.290
7.230
135
9.620
1.767
30.414
735
0
0
Banks
Number
766
215
31
19
38
20
6
60
116
40
47
57
48
2
35
7
24
1
0
0
Capital
146.034
39.912
2.767
1.754
12.235
2.251
538
5.407
24.188
9.206
4.072
29.841
5.336
28
4.200
755
3.364
180
0
0
Other banks
Number
Capital
702
175
28
6
18
14
0
61
47
29
65
30
24
1
34
19
148
3
0
0
105.738
32.203
3.972
522
5.133
3.017
0
4.383
10.938
1.673
6.410
1.449
1.894
107
5.420
1.012
27.050
555
0
0
M.4 Urban buildings, according to loaning bank
Capital in thousands of euros
Urban buildings
Number
Capital
TOTAL
Andalucía
Aragón
Asturias, Principado de
Balears, Illes
Canarias
Cantabria
Castilla y León
Castilla - La Mancha
Cataluña
Comunitat Valenciana
Extremadura
Galicia
Madrid, Comunidad de
Murcia, Región de
Navarra, Comunidad Foral de
País Vasco
Rioja, La
Ceuta
Melilla
23.011
4.357
729
426
625
1.265
197
916
921
3.170
2.465
403
1.238
3.604
596
315
1.478
256
19
31
2.857.407
482.938
73.060
52.503
74.583
198.984
18.307
78.849
117.991
400.969
230.844
31.006
107.983
623.747
58.143
34.485
244.901
22.752
2.806
2.556
Banks
Number
19.150
3.761
606
301
557
1.083
177
728
720
2.740
2.082
385
972
3.151
470
203
1.038
132
18
26
Capital
2.387.640
380.714
62.654
30.966
66.174
181.336
15.220
57.723
101.299
352.113
198.742
29.806
83.597
557.107
44.862
23.185
189.114
8.127
2.543
2.358
Other banks
Number
Capital
3.861
596
123
125
68
182
20
188
201
430
383
18
266
453
126
112
440
124
1
5
469.767
102.224
10.406
21.537
8.409
17.648
3.087
21.126
16.692
48.856
32.102
1.200
24.386
66.640
13.281
11.300
55.787
14.625
263
198
M - NOVEMBER 2014 (7/9)
November 2014. Provisional data
M.5 Total mortgages cancelled, according to type of building
Total buildings
TOTAL
Andalucía
Aragón
Asturias, Principado de
Balears, Illes
Canarias
Cantabria
Castilla y León
Castilla - La Mancha
Cataluña
Comunitat Valenciana
Extremadura
Galicia
Madrid, Comunidad de
Murcia, Región de
Navarra, Comunidad Foral de
País Vasco
Rioja, La
Ceuta
Melilla
Rustic buildings
37.945
8.402
863
622
1.095
2.054
450
1.862
1.799
4.903
5.823
634
1.802
4.508
1.504
323
935
309
20
37
1.910
453
175
27
54
38
16
100
168
57
455
46
96
68
108
14
25
9
0
1
Dwellings
Lots
23.792
5.137
467
386
640
1.402
274
1.132
1.079
3.158
3.430
430
1.096
3.022
1.043
230
641
181
15
29
Other urban land
1.457
478
38
8
31
41
10
113
171
81
155
37
103
126
32
13
17
3
0
0
10.786
2.334
183
201
370
573
150
517
381
1.607
1.783
121
507
1.292
321
66
252
116
5
7
M.6 Total cancelled mortgages, according to type of building and
loaning bank
Total buildings
Banks
TOTAL
Andalucía
Aragón
Asturias, Principado de
Balears, Illes
Canarias
Cantabria
Castilla y León
Castilla - La Mancha
Cataluña
Comunitat Valenciana
Extremadura
Galicia
Madrid, Comunidad de
Murcia, Región de
Navarra, Comunidad Foral de
País Vasco
Rioja, La
Ceuta
Melilla
32.933
7.210
691
490
960
1.896
397
1.582
1.590
4.353
5.126
580
1.668
4.006
1.271
204
637
218
18
36
Rustic buildings
Banks
Other
banks
5.012
1.192
172
132
135
158
53
280
209
550
697
54
134
502
233
119
298
91
2
1
1.435
341
134
21
35
33
15
94
81
42
368
38
89
37
68
10
19
9
0
1
Urban buildings
Banks
Other
banks
475
112
41
6
19
5
1
6
87
15
87
8
7
31
40
4
6
0
0
0
31.498
6.869
557
469
925
1.863
382
1.488
1.509
4.311
4.758
542
1.579
3.969
1.203
194
618
209
18
35
Other
banks
4.537
1.080
131
126
116
153
52
274
122
535
610
46
127
471
193
115
292
91
2
1
M - NOVEMBER 2014 (8/9)
November 2014. Provisional data
M.7 Total mortgages with changes, according to type of change and
type of building
Total
buildings
TOTAL
Andalucía
Aragón
Asturias, Principado de
Balears, Illes
Canarias
Cantabria
Castilla y León
Castilla - La Mancha
Cataluña
Comunitat Valenciana
Extremadura
Galicia
Madrid, Comunidad de
Murcia, Región de
Navarra, Comunidad Foral de
País Vasco
Rioja, La
Ceuta
Melilla
14.149
3.129
517
216
290
748
116
1.236
635
2.079
2.067
139
308
1.776
520
78
198
87
9
1
Type of change
Type of building
Novation
Subrogations Subrogations Rustic
Urban
Debtor
Creditor
buildings buildings
11.115
2.626
493
192
287
422
116
1.035
521
1.415
1.334
101
272
1.573
468
51
125
75
9
0
For further information see INEbase – www.ine.es/en/
759
93
7
9
0
183
0
14
10
73
257
10
3
13
10
26
39
12
0
0
2.275
410
17
15
3
143
0
187
104
591
476
28
33
190
42
1
34
0
0
1
923
284
12
14
37
18
3
34
108
26
79
15
9
239
41
0
3
1
0
0
13.226
2.845
505
202
253
730
113
1.202
527
2.053
1.988
124
299
1.537
479
78
195
86
9
1
Dwellings
8.348
1.956
249
115
156
378
36
501
351
1.435
1.351
82
180
1.000
334
60
104
54
6
0
All press releases at: www.ine.es/en/prensa/prensa_en.htm
Press Office: Telephone numbers: 91 583 93 63 / 94 08 – Fax: 91 583 90 87 – [email protected]
Information Area: Telephone number: 91 583 91 00 – Fax: 91 583 91 58 – www.ine.es/infoine/?L=1
M - NOVEMBER 2014 (9/9)
© Copyright 2026