
In August, the number of property transfers registered is 109,731
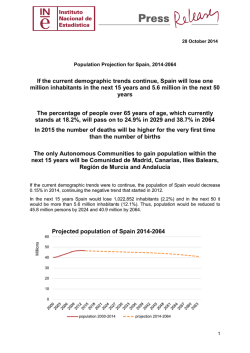
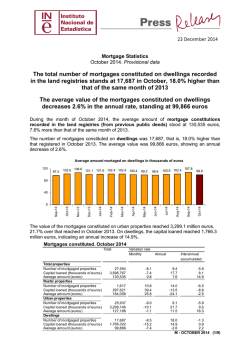
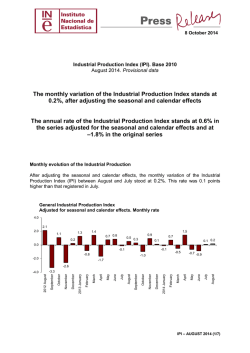
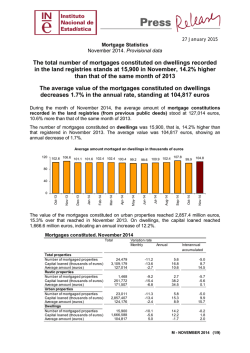
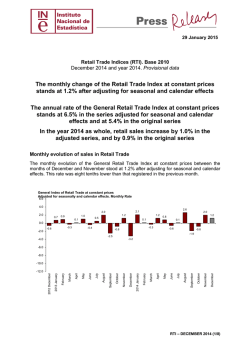
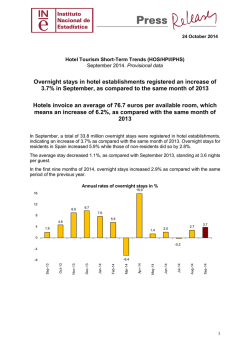
8 October 2014
Statistics on Transfer of Property Rights (STPR)
August 2014. Provisional data
In August, the number of property transfers registered is 109,731
properties, that is, 8.9% less than in the same month of the
previous year
The merchanting of registered dwellings decreases by 1.1%, as
compared with August 2013
The number of property transfers recorded in the land registries (from public deeds
previously registered) was 109,731 in August, that is, 8.9% less than in the same month of
2013.
Regarding the merchanting of registered properties, the number of transfers was 50,697,
only 16 transactions less than in August 2013.
Number of total property transfers recorded in the land registries (thousands)
148
126
sep.-13
141
120
aug-13
160
142
131
139
139
120
137
123
114
139
126
110
80
40
aug-14
jul.-14
jun.-14
may.-14
apr-14
mar.-14
feb.-14
jan-14
dec-13
nov.-13
oct.-13
jul.-13
0
Registered property transfers, by acquisition title. August 2014
Total
Total properties
Merchanting
Donation
Swap
Inheritance
Other titles 1
% Variation
Monthly
Annual
109,731
50,697
2,604
845
25,593
-20.8
-16.7
-29.4
48.8
-18.2
-8.9
0.0
-13.8
75.7
-2.9
29,992
-28.9
-24.9
Annual
accumulated
-6.3
-2.1
-24.8
-7.0
-0.5
-13.6 1
1
"Other titles" includes land consolidation, horizontal divisions, joint ventures or mixtures of several titles transmission,
transmissions without title of acquisition, non recourse debt, foreclosures and court awards.
STPR –AUGUST 2014 (1/8)
Merchanting recorded in the land registries
84.4% of the registered merchanting in August corresponded to urban properties and 15.6%
to rustic properties. Among the urban properties, 55.0% were merchanting of dwellings.
The number of merchanting of rustic properties increased by 6.4% in the annual rate in
August, and that of urban properties decreased by 1.1%. Within the later, merchanting of
dwellings recorded an annual variation of –1.1%.
Number of registered merchanting. August 2014
Total
Urban properties
- Dwellings
- Other urban properties
Rustic properties
% Variation
Monthly
42,801
23,525
19,276
7,896
Annual
-16.7
-17.7
-15.4
-17.0
-1.1
-1.1
-1.2
6.4
Annual
accumulated
-3.7
-3.0
-4.5
6.7
Evolution of the monthly rate
In order to contribute to the analysis and interpretation of the data, the following chart shows
the variation in the number of merchantings of dwellings between the months of July and
August of the last five years. In 2014, the monthly rate was –17.7%.
30
Evolution of the monthly rate of the number of merchantings of
dwellings (variation of August as compared with July of the same
year)
20
10
2.8
0.1
0
-4.3
-10
-7.9
-20
-30
-17.7
2010
2011
2012
2013
2014
STPR – AUGUST 2014 (2/8)
Registered merchanting on dwellings, by protection system and status
90.1% of transfers of dwellings by merchanting in August were free housing, and 9.9% were
protected housing.
In annual terms, the number of transfers of free dwellings by merchanting decreased by
1.3%, and that of protected dwellings did so by 0.7%.
34.4% of the dwellings transferred by merchanting in August were new, and 65.6% were
used.
The number of transactions on new dwellings decreased 22.1%, and the number of used
dwellings increased 15.2%, as compared with August 2013.
Number of registered merchantings of dwellings. August 2014
Total
Total
Free housing
Protected housing
Total
New housing
Used housing
Percentage
23,525
21,204
2,321
23,525
8,104
% Variation
Monthly
90.1
9.9
34.4
65.6
15,421
Annual
-17.7
-17.6
-18.9
-17.7
-22.8
-1.1
-1.3
0.7
-1.1
-22.1
Annual
accumulated
-3.0
-2.1
-10.6
-3.0
-14.9
-14.7
15.2
7.2
Number of registered merchantings on dwellings (thousands)
40
10.6
9.9
9.8
10.8
oct.-13
nov.-13
dec-13
New
Used
14.5
11.5
11.3
10.7
14.3
16.3
18.1
10.9
9.8
10.5
8.1
aug-14
10.4
15.7
jul.-14
11.3
10
14.2
jun.-14
11.6
apr-14
12.3
mar.-14
12.9
feb.-14
13.2
jan-14
13.4
sep.-13
16.1
14.5
aug-13
20
may.-14
30
17.3
15.4
jul.-13
0
STPR – AUGUST 2014 (3/8)
Results by Autonomous Community
In August 2014, the total number of property transfers recorded in the land registries per
100,000 inhabitants2 reached its highest value in the Autonomous Communities of Aragón
(487), Castilla y León (472) and La Rioja (462).
The Autonomous Communities which registered the greatest annual variations were Illes
Balears (29.8%), Principado de Asturias (16.8%) and Cantabria (11.6%).
In turn, the Autonomous Communites that registered the lowest annual rates were Galicia,
La Rioja (both at –26.9%) and Canarias (–19.9%).
Number of registered property transfers, by Autonomous Cities and Communities
TOTAL
Andalucía
Aragón
As turias, Principado de
Balears , Illes
Canarias
Cantabria
Castilla y León
Castilla - La Mancha
Cataluña
Comunitat Valenciana
Extrem adura
Galicia
Madrid, Com unidad de
Murcia, Región de
Navarra, Com unidad Foral de
País Vasco
Rioja, La
Ceuta
Melilla
Total property transfers recorded in
the registries
Registered merchantings of
dwellings
Number
Number
109,731
18,556
5,161
2,663
3,378
3,482
1,472
9,537
6,770
16,232
13,619
2,612
6,243
9,964
3,218
1,559
3,993
1,148
74
50
% Annual
variation
-8.9
-4.6
10.3
16.8
29.8
-19.9
11.6
-17.1
-10.1
-11.0
-19.3
-4.5
-26.9
3.8
-5.1
-13.0
2.7
-26.9
0.0
-12.3
Number per
hundred
thousand
inhabitants 2
297
282
487
303
380
203
311
472
416
279
345
299
277
198
285
313
230
462
118
84
% Annual
variation
23,525
4,765
596
397
657
1,184
335
1,290
833
3,610
3,323
410
973
3,138
725
267
832
148
22
20
-1.1
-9.4
6.0
29.3
19.7
4.0
15.9
27.2
-5.4
-11.7
-7.7
5.4
1.8
19.5
-0.4
-9.5
9.9
-48.4
-42.1
-13.0
Number per
hundred
thousand
inhabitants 2
64
72
56
45
74
69
71
64
51
62
84
47
43
62
64
54
48
60
35
34
Regarding the merchanting on registered dwellings, the Autonomous Communities with the
highest number of transfers per 100,000 inhabitants2 were Comunitat Valenciana (84), Illes
Balears (74) and Andalucía (72).
_____________________
2
This data was calculated from the provisional data of the Population Figures at 1st January 2014. Only the population aged
18 to 84 years old was considered.
STPR – AUGUST 2014 (4/8)
The Autonomous Communities showing the greatest annual variation rates in the
merchanting of dwellings in August were Principado de Asturias (29.3%), Castilla y León
(27.2%) and Illes Balears (19.7%).
In turn, those showing the greatest decreases were La Rioja (–48.4%), Cataluña (–11.7%)
and Comunidad Foral de Navarra (–9.5%).
Annual variation of the number of merchantings of
dwellings by Autonomous Community. August 2014
Asturias, Principado de
29.3
Castilla y León
27.2
Balears, Illes
19.7
Madrid, Comunidad de
19.5
Cantabria
15.9
País Vasco
9.9
Aragón
6.0
Extremadura
5.4
Canarias
4.0
Galicia
1.8
Murcia, Región de
-0.4
TOTAL
-1.1
Castilla - La Mancha
-5.4
Comunitat Valenciana
-7.7
Andalucía
-9.4
Navarra, Comunidad Foral de
-9.5
Cataluña
-11.7
Rioja, La
-48.4
-60
-40
-20
0
20
40
STPR – AUGUST 2014 (5/8)
Statistics on Transfer of Property Rights
August 2014. Provisional Data
STPR. 1 Transfers recorded in the land registries,
made on rustic and urban properties
Total
TOTAL
Andalucía
Aragón
Asturias, Principado de
Balears, Illes
Canarias
Cantabria
Castilla y León
Castilla - La Mancha
Cataluña
Comunitat Valenciana
Extremadura
Galicia
Madrid, Comunidad de
Murcia, Región de
Navarra, Comunidad Foral de
País Vasco
Rioja, La
Ceuta
Melilla
Rustic properties
109,731
18,556
5,161
2,663
3,378
3,482
1,472
9,537
6,770
16,232
13,619
2,612
6,243
9,964
3,218
1,559
3,993
1,148
74
50
25,355
2,936
2,093
1,050
699
425
374
4,473
3,304
2,040
2,358
975
2,143
395
610
517
525
436
1
1
Urban properties
Dwellings
Plots
47,193
9,149
1,522
859
1,213
1,897
545
2,637
1,874
7,934
6,548
1,008
2,118
5,619
1,496
606
1,751
347
37
33
Other urban properties
4,863
1,002
445
35
190
104
35
540
450
745
377
162
110
284
139
67
134
44
0
0
32,320
5,469
1,101
719
1,276
1,056
518
1,887
1,142
5,513
4,336
467
1,872
3,666
973
369
1,583
321
36
16
STPR. 2 Transfers made on rustic properties, by acquisition title
Rustic properties
TOTAL
Andalucía
Aragón
Asturias, Principado de
Balears, Illes
Canarias
Cantabria
Castilla y León
Castilla - La Mancha
Cataluña
Comunitat Valenciana
Extremadura
Galicia
Madrid, Comunidad de
Murcia, Región de
Navarra, Comunidad Foral de
País Vasco
Rioja, La
Ceuta
Melilla
25,355
2,936
2,093
1,050
699
425
374
4,473
3,304
2,040
2,358
975
2,143
395
610
517
525
436
1
1
Merchanting
Donation
7,896
1,141
656
237
188
149
96
1,157
1,220
490
851
351
589
102
276
130
118
145
0
0
1,003
69
73
35
40
15
20
103
172
104
169
28
67
14
17
36
36
5
0
0
Swap
Inheritance
203
4
27
7
15
1
4
23
50
0
13
3
31
0
6
7
11
1
0
0
Other titles
10,818
1,031
994
586
365
53
181
2,189
1,290
993
938
438
715
201
135
285
272
152
0
0
5,435
691
343
185
91
207
73
1,001
572
453
387
155
741
78
176
59
88
133
1
1
STPR - AUGUST 2014 (6/8)
August 2014. Provisional Data
STPR. 3 Transfers made on urban properties, by acquisition title
Urban properties
TOTAL
Andalucía
Aragón
Asturias, Principado de
Balears, Illes
Canarias
Cantabria
Castilla y León
Castilla - La Mancha
Cataluña
Comunitat Valenciana
Extremadura
Galicia
Madrid, Comunidad de
Murcia, Región de
Navarra, Comunidad Foral de
País Vasco
Rioja, La
Ceuta
Melilla
84,376
15,620
3,068
1,613
2,679
3,057
1,098
5,064
3,466
14,192
11,261
1,637
4,100
9,569
2,608
1,042
3,468
712
73
49
Merchanting
42,801
7,946
1,207
778
1,419
1,844
607
2,405
1,510
6,723
6,127
721
2,009
5,479
1,310
476
1,820
332
54
34
Donation
Swap
1,601
93
58
12
59
25
14
82
156
314
265
29
39
249
54
50
91
5
5
1
Inheritance
642
31
7
13
13
9
1
7
25
32
29
3
43
377
6
2
40
4
0
0
Other titles
14,775
2,101
612
417
455
340
155
992
627
3,115
1,861
368
624
1,405
251
333
947
157
6
9
24,557
5,449
1,184
393
733
839
321
1,578
1,148
4,008
2,979
516
1,385
2,059
987
181
570
214
8
5
STPR. 4 Transfers made on dwellings, by acquisition title
Dwellings
TOTAL
Andalucía
Aragón
Asturias, Principado de
Balears, Illes
Canarias
Cantabria
Castilla y León
Castilla - La Mancha
Cataluña
Comunitat Valenciana
Extremadura
Galicia
Madrid, Comunidad de
Murcia, Región de
Navarra, Comunidad Foral de
País Vasco
Rioja, La
Ceuta
Melilla
Merchanting
47,193
9,149
1,522
859
1,213
1,897
545
2,637
1,874
7,934
6,548
1,008
2,118
5,619
1,496
606
1,751
347
37
33
23,525
4,765
596
397
657
1,184
335
1,290
833
3,610
3,323
410
973
3,138
725
267
832
148
22
20
Donation
Swap
903
49
36
9
21
15
6
41
73
171
160
22
23
157
44
27
42
1
5
1
Inheritance
249
14
6
0
5
5
1
3
3
19
11
1
22
127
4
1
26
1
0
0
Other titles
9,569
1,551
377
269
230
216
103
590
340
1,915
1,238
294
390
1,027
180
197
547
90
6
9
12,947
2,770
507
184
300
477
100
713
625
2,219
1,816
281
710
1,170
543
114
304
107
4
3
STPR - AUGUST 2014 (7/8)
August 2014. Provisional Data
STPR. 5 Merchanting of dwellings, by system and status
Dwellings
TOTAL
Andalucía
Aragón
Asturias, Principado de
Balears, Illes
Canarias
Cantabria
Castilla y León
Castilla - La Mancha
Cataluña
Comunitat Valenciana
Extremadura
Galicia
Madrid, Comunidad de
Murcia, Región de
Navarra, Comunidad Foral de
País Vasco
Rioja, La
Ceuta
Melilla
23,525
4,765
596
397
657
1,184
335
1,290
833
3,610
3,323
410
973
3,138
725
267
832
148
22
20
Free housing
21,204
4,383
509
310
638
1,124
301
1,073
748
3,248
3,013
322
917
2,884
648
199
731
120
20
16
For further information see INEbase – www.ine.es/en/
State-subsidised housing
New housing
2,321
382
87
87
19
60
34
217
85
362
310
88
56
254
77
68
101
28
2
4
8,104
1,838
113
155
193
472
109
435
283
843
1,208
119
476
1,139
282
99
263
56
14
7
Used housing
15,421
2,927
483
242
464
712
226
855
550
2,767
2,115
291
497
1,999
443
168
569
92
8
13
All press releases at: www.ine.es/en/prensa/prensa_en.htm
Press Office: Telephone numbers: 91 583 93 63 / 94 08 – Fax: 91 583 90 87 – [email protected]
Information Area: Telephone number: 91 583 91 00 – Fax: 91 583 91 58 – www.ine.es/infoine/?L=1
STPR - AUGUST 2014 (8/8)
© Copyright 2026