Las pernoctaciones en establecimientos hoteleros aumentan un 3,7
24 October 2014
Hotel Tourism Short-Term Trends (HOS/HPI/IPHS)
September 2014. Provisional data
Overnight stays in hotel establishments registered an increase of
3.7% in September, as compared to the same month of 2013
Hotels invoice an average of 76.7 euros per available room, which
means an increase of 6.2%, as compared with the same month of
2013
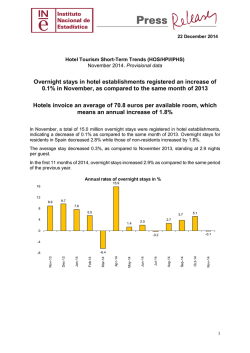
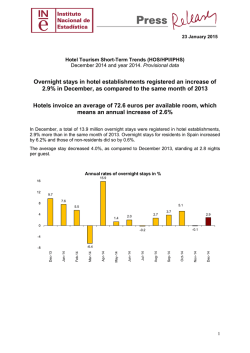
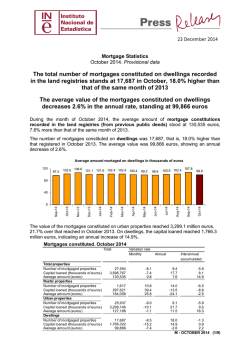
In September, a total of 33.8 million overnight stays were registered in hotel establishments,
indicating an increase of 3.7% as compared with the same month of 2013. Overnight stays for
residents in Spain increased 5.9% while those of non-residents did so by 2.8%.
The average stay decreased 1.1%, as compared with September 2013, standing at 3.6 nights
per guest.
In the first nine months of 2014, overnight stays increased 2.9% as compared with the same
period of the previous year.
Annual rates of overnight stays in %
15.9
16
12
8.9
9.7
7.6
8
5.5
4.6
4
1.9
1.4
2.7
2.0
3.7
0
-0.2
-4
Sep-14
Aug-14
Jul-14
Jun-14
May-14
Apr-14
Feb-14
Jan-14
Dec-13
Nov-13
Oct-13
Sep-13
Mar-14
-6.4
-8
1
Main destinations
In September, Andalucía, Comunitat Valenciana, Cataluña and Comunidad de Madrid were
the main destinations of guests resident in Spain, with annual variation rates for overnight stays
of 5.9%, 1.6%, 17.4% and 7.5%, respectively.
Distribution of overnight stays of guests resident in Spain in %
25%
22.8%
20%
14.3%
15%
13.3%
10%
7.9% 7.9%
5.7%
5%
5.0% 4.5%
3.0% 2.8% 2.7%
2.3% 2.1% 1.9%
1.6% 1.3%
0.8%
0.1% 0.1%
Ceuta
Melilla
Rioja, La
Navarra, Comunidad Foral
de
Extremadura
Murcia, Región de
Cantabria
Castilla-La Mancha
País Vasco
Aragón
Asturias, Principado de
Balears, Illes
Castilla y León
Galicia
Canarias
C. de Madrid
Cataluña
Comunitat Valenciana
Andalucía
0%
The main destination chosen by non-residents was Illes Balears, with 34.3% of the total
amount of overnight stays. In this Autonomous Community, overnight stays by foreign
nationals decreased 1.1%, as compared with September 2013. Illes Balears was followed by
Cataluña (19.9% of the total and a 2.7% decrease of overnight stays) and Canarias (18.8% of
the total and an increase of 8.4% of overnight stays by non-residents).
Distribution of overnight stays of guests resident abroad in %
35%
34.3%
30%
25%
19.9%
20%
18.8%
15%
12.4%
10%
5.3%
5%
4.5%
3.8%
1.0%
Rest o f AACC
Galicia
C. de Mad rid
Comunitat
Valenciana
Andalucía
Canarias
Cataluña
Balears, Illes
0%
2
Hotel Occupancy
In September, 63.6% of the available bedplaces were occupied, indicating an annual increase
of 3.1%. The weekend occupancy rate by bedplaces increased by 4.5%, standing at 69.0%.
Occupancy rate and weekend occupancy rate by bedplaces
80
74.074.4
69.9
70
66.0
65.5
61.7
58.8
60
51.8
50.6
50.2
47.7
50
59.1
58.5
52.2
44.4
41.5
40.0
40
43.4
51.8
69.0
65.6
63.6
59.2
51.7
46.1
38.4
30
20
10
Occupancy rate by bedplaces
Sep-14
Aug-14
Jul-14
Jun-14
May-14
Apr-14
Mar-14
Feb-14
Jan-14
Dec-13
Nov-13
Oct-13
Sep-13
0
Weekend occupancy rate by bedplaces
Illes Balears registered the greatest occupancy rate by bedplaces in September (82.0%),
followed by Canarias (74.1%) and Comunitat Valenciana (67.2%).
Occupancy rate by bedplaces by Automous Community
90
82.0
74.1
80
67.2 64.4
70
63.6
60
60.3 59.5 58.8 58.5
55.5
52.3 49.9
50
47.1 47.0 45.3
39.4 37.9
40
33.6 31.8
29.8
30
20
10
Castilla-La Mancha
Extremadura
Aragón
Galicia
Castilla y León
Asturias, Principado de
Cantabria
Navarra, Comunidad Foral de
Murcia, Región de
Ceuta
Melilla
Rioja, La
Madrid, Comunidad de
Andalucía
País Vasco
TOTAL
Cataluña
Comunitat Valenciana
Canarias
Balears, Illes
0
3
By tourist areas, the island of Menorca registered in September the highest occupancy rate,
both by bedplaces (83.7%) and by weekend occupancy (84.0%). It also recorded the highest
number of overnight stays, with more than 6.3 million.
The tourist sites with the highest number of overnight stays were Barcelona, Madrid and Calvià.
Santa Margalida reached the highest occupancy rate by bedplaces (93.9%) and Santa
Llucmajor the highest weekend occupancy rate (96.7%).
Overnight stays according to the country of origin of the guests
Guests from Germany and the United Kingdom concentrated 26.7% and 26.3%, respectively,
of the total of overnight stays in hotel establishments by non-residents in September. The
British market experienced a decrease of 1.1% and the German market increased by 5.4%.
Overnight stays of guests from France, Russia, and Italy (the following countries of origin)
registered annual rates of 9.9%, –20.3% and 0.3%, respectively.
Distribution of overnight stays of residents abroad from the
main 16 countries in %
30
26.7
26.3
25
20
15
10
6.5
1.6
1.5
1.5
1.5
1.1
0.9
0.9
Czech Republic
Denmark
2.1
Norway
2.4
Sweden
3.0
Ireland
3.6
Poland
3.6
Portugal
5.5
5
Switzerland
United States of
America
Belgium
Netherlands
Italy
Russia
France
United Kingdom
Germany
0
4
Hotel Prices
The annual rate of the Hotel Prices Index (HPI) stood at 2.2% in September, that is, 0.3 points
lower than that of the previous month and the 0.8 points over that registered in the previous
year.
Hotel Prices Index. Annual variation rate
4
3.1
3
2.5
2.2
2
1.7
0.0
0.9
0.7
Jul-14
1
Jun-14
1.4
0.1
0
-0.2
-0.3
-0.6
-1
Sep-14
Aug-14
May-14
Apr-14
Feb-14
Jan-14
Dec-13
Nov-13
Oct-13
Sep-13
Mar-14
-1.5
-2
Illes Balears, Cataluña, Andalucía and Canarias were the Autonomous Communities that
carried the greatest weight of the total load of the HPI in the month of September (they
represented 75.2% of the total). Hotel prices increased 4.1% in the annual rate in Illes Balears,
3.3% in Canarias, and 1.5% in Andalucía. In turn, they decreased in Cataluña by 0.3%.
By hotel category, the increases in hotel prices were registered in five-golden-star
establishments (3.9%), three-golden-star hotels (3.0%), one-golden-star hotels (2.3%), three
and two-silver-star hotels (2.1%), four-golden-star establishments (1.8%), and two-golden-star
hotels (0.5%).
In turn, the prices registered a decrease in one-silver-star establishments (5.1%).
Indicators on the Profitability of the Hotel Sector
The daily average invoicing per occupied room (ADR) in September was 76.7 euros, which
represented an increase of 6.2% as compared with the same month of 2013.
In turn, the daily average revenue per available room (RevPAR), that is conditioned by the
occupancy registered in hotel establishments, reached 53.8 euros, with an increase of 11.0%.
By category, the average invoicing was 164.5 euros for five-star hotels, 84.5 euros for fourstar hotels and 64.4 euros for three-star hotels. Income per available room for the same
categories was 126.5, 67.8, and 48.7 euros, respectively.
5
Average daily rate (ADR) by hotel category in euros
200
180
164.5
155.6
160
140
120
84.5
100
80
72.2
80.2
76.7
59.4 64.4
53.4 52.3
60
48.5 49.0
47.0 49.5
41.5 39.6
40
20
September 2013
1 silver star
3 & 2 silver stars
1 gold star
2 gold stars
3 gold stars
4 gold stars
NATIONAL TOTAL
5 gold stars
0
September 2014
Revenue per available room (RevPAR) by hotel category in
euros
140
126.5
120
110.8
100
80
67.8
61.9
60
53.8
48.4
48.7
43.6
40
27.4 27.6
20.0
20
21.0
20.2
17.4
14.114.5
For further information see INEbase-www.ine.es/en/
September 2014
1 silver star
1 gold star
3 & 2 silver stars
September2013
2 gold stars
3 gold stars
4 gold stars
5 gold stars
NATIONAL TOTAL
0
All press releases at: www.ine.es/en/prensa/prensa_en.htm
Press Office: Telephone numbers: 91 583 93 63 / 94 08 – Fax: 91 583 90 87 [email protected]
Information Area: Telephone number: 91 583 91 00 – Fax: 91 583 91 58– www.ine.es/infoine/?L=1
6
Tourist Accomodation Occupancy Survey
(Hotels and similar establishments)
September 2014
Provisional data
1. Guests, overnight stays and average stay by category
of establishment
Category
Number of guests
Total
TOTAL
Number of overnight stays
Residents
Residents
in Spain
abroad
Total
Residents
Residents
in Spain
abroad
Average
stay
9,320,009
4,248,164
5,071,845
33,865,799
10,522,047
23,343,752
3.63
Five
474,578
147,183
327,395
1,689,452
348,238
1,341,214
3.56
Four
4,162,534
1,826,300
2,336,235
15,983,099
4,711,822
11,271,278
3.84
Three
2,809,758
1,225,339
1,584,419
11,572,210
3,283,987
8,288,223
4.12
Two
717,248
409,662
307,586
1,940,521
894,636
1,045,885
2.71
One
277,614
166,725
110,889
652,034
330,415
321,620
2.35
Two and three
480,085
280,009
200,076
1,116,476
527,317
589,159
2.33
One
398,192
192,946
205,246
912,006
425,631
486,374
2.29
HOTELS: Golden stars
INNS: Silver stars
Annual rate
4.88
4.75
4.98
3.73
5.86
2.80
-1.09
Cumulative annual rate
4.37
4.42
4.33
2.89
3.49
2.57
-1.42
2. Open establishments, capacity, occupancy
and employed personnel by category of establishment
Category
Estimated
open
Estimated
bed-places
establishments
Occupancy rate
Employed
personnel
Of
Of
Of
bed-places
bed-places
bedrooms
at weekend
TOTAL
16,554
1,746,006
63.56
69.02
70.03
230,178
HOTELS: Golden stars
Five
274
84,956
65.30
72.56
77.03
26,823
Four
2,355
735,942
70.95
75.84
80.31
108,843
Three
2,981
537,944
70.48
75.26
75.92
61,980
Two
2,136
136,169
47.14
56.35
52.00
12,270
One
1,350
57,296
37.70
44.01
42.98
4,865
Two and three
3,256
100,821
36.63
43.22
40.48
8,247
One
4,201
92,878
32.63
37.68
36.72
7,150
0.48
0.71
3.10
4.52
4.10
1.19
INNS: Silver stars
Annual rate
HOS (TABLES ANNEX) - SEPTEMBER 2014 (1/3)
24th October 2014
3. Guests, overnight stays, occupancy, average stay and
employed personnel
Results by area and tourist site
Guests
Overnight stays
Occupancy rate
Residents Residents
in Spain
abroad
Residents
in Spain
Of
bed-places
Residents
abroad
Of
bed-places
at weekend
Average
Of
stay
bedrooms
Employed
personnel
Tourist area with a greater occupancy rate per month
Isla de Mallorca
59,480
905,538
228,694
6,125,681
83.73
84.02
88.09
6.58
34,430
Isla de Lanzarote
24,017
78,218
151,578
695,080
80.89
79.51
92.53
8.28
5,950
Islas de Ibiza-Formentera
39,132
212,578
149,667
1,337,660
79.80
82.64
83.88
5.91
8,906
Isla de Fuerteventura
18,180
100,618
111,351
962,979
79.38
77.39
88.19
9.04
7,110
13,474
Palma - Calvià
31,002
378,810
119,236
2,147,840
79.29
81.37
84.65
5.53
169,029
167,641
734,325
877,067
77.61
83.34
80.59
4.79
9,149
Sur de Tenerife
35,779
165,494
155,511
1,387,692
76.66
78.56
86.13
7.67
12,701
Costa de Gipuzkoa
30,558
38,204
60,654
82,718
74.19
83.05
83.63
2.09
1,158
Costa Blanca
Tourist area with a greater number of overnight stays per month *
Costa del Sol
174,291
300,374
556,154
1,397,777
72.47
76.53
82.59
4.12
12,728
71,283
195,577
297,364
1,620,425
73.65
75.62
81.27
7.19
15,660
Barcelona
124,565
529,476
246,484
1,487,183
73.82
79.35
86.27
2.65
12,961
Costa Brava
120,656
234,547
295,741
1,164,878
61.86
68.99
65.93
4.11
8,213
Costa Daurada
115,239
145,180
396,680
1,000,469
70.64
74.86
78.33
5.37
6,411
58,854
121,642
234,061
1,058,162
70.15
72.24
77.02
7.16
10,620
38,945
113,889
183,730
1,020,333
73.62
75.41
80.08
7.88
9,678
118,402
74,002
372,673
365,907
60.82
66.45
72.25
3.84
5,883
Isla de Tenerife
Isla de Gran Canaria
Sur de Gran Canaria
Costa de la Luz de Cádiz
Tourist site with a greater occupancy rate per month
Santa Margalida
1,049
46,559
3,941
398,180
93.87
93.34
96.06
8.45
1,884
10,523
55,165
39,983
300,300
93.81
96.68
88.89
5.18
1,487
Alcúdia
2,593
67,572
10,904
513,403
89.26
87.95
90.33
7.47
2,748
Capdepera
1,759
61,128
4,324
474,558
88.75
89.49
94.20
7.61
1,937
120
32,231
175
282,670
88.62
88.00
92.52
8.74
1,123
81,933
99,507
500,430
613,664
88.57
92.08
89.18
6.14
5,506
Llucmajor
Son Servera
Benidorm
Muro
2,099
52,562
9,611
402,348
88.04
88.10
93.93
7.54
2,344
12,468
48,464
35,014
232,187
85.81
91.76
90.07
4.39
2,144
Pollença
4,426
19,247
7,400
133,035
85.61
85.88
91.31
5.93
1,155
Santanyí
1,424
39,664
5,358
305,678
85.48
84.90
91.91
7.57
2,026
Eivissa
Tourist site with a greater number of overnight stays per month *
Barcelona
115,220
507,816
227,854
1,425,757
74.96
80.43
87.05
2.65
12,486
Madrid
346,225
404,236
597,610
944,469
63.10
71.60
79.11
2.05
11,222
Calvià
9,659
169,777
48,419
1,126,663
76.43
76.07
82.81
6.55
6,673
Palma
19,999
191,772
66,734
933,411
81.29
86.16
85.68
4.72
6,225
San Bartolomé de Tirajana
30,087
85,870
144,178
781,776
75.27
77.15
81.63
7.99
7,722
Salou
43,345
86,962
181,571
658,000
79.00
82.21
86.80
6.44
3,395
Adeje
15,839
86,372
77,505
741,894
77.88
80.10
86.79
8.02
6,986
Lloret de Mar
27,326
97,990
93,177
628,555
74.34
77.55
77.02
5.76
2,745
Pájara
8,769
66,219
53,679
635,716
83.79
81.66
90.56
9.19
4,726
Sant Llorenç des Cardassar
1,355
60,757
7,184
552,093
83.52
81.75
91.67
9.00
2,960
* Not taken into account those included in the preceding table because they are in the bigger occupancy rate tables too.
HOS (TABLES ANNEX) - SEPTEMBER 2014 (2/3)
Provisional data
4. Guests and overnight stays by country of residence
Results by country
Countries
Number of guests
Overnight stays
Total
Total
%
%
TOTAL
Residents in Spain
Residents abroad
Total Residents abroad
9,320,009
100.00
33,865,799
100.00
4,248,164
45.58
10,522,047
31.07
5,071,845
54.42
23,343,752
68.93
5,071,845
100.00
23,343,752
100.00
Total Residents in E.U. (without Spain)
- Germany
- Austria
- Belgium
- Denmark
- Finland
- France
- Greece
- Ireland
- Italy
- Luxembourg
- Netherlands
- Poland
- Portugal
- United Kingdom
- Czech Republic
- Sweden
- Other EU countries*
Norway
Russia
Switzerland
Rest of Europe
Japan
United States of America
Rest of America
Africa
Other countries
3,682,226
72.60
18,865,607
80.82
955,802
18.85
6,222,749
26.66
46,307
0.91
208,381
0.89
134,122
2.64
695,402
2.98
49,516
0.98
217,934
0.93
29,793
0.59
114,709
0.49
488,406
9.63
1,509,332
6.47
9,700
0.19
28,964
0.12
81,778
1.61
352,780
1.51
236,989
4.67
850,321
3.64
8,606
0.17
51,832
0.22
178,105
3.51
840,734
3.60
73,864
1.46
354,672
1.52
121,220
2.39
366,278
1.57
1,068,565
21.07
6,149,277
26.34
35,282
0.70
220,049
0.94
76,212
1.50
341,395
1.46
87,959
1.73
340,800
1.46
59,630
1.18
248,049
1.06
176,568
3.48
1,281,666
5.49
109,099
2.15
481,588
2.06
90,265
1.78
345,007
1.48
61,824
1.22
113,971
0.49
248,509
4.90
553,604
2.37
269,591
5.32
620,233
2.66
50,386
0.99
115,814
0.50
323,747
6.38
718,213
3.08
*Countries included in Other EU countries: Bulgaria, Cyprus, Croatia, Slovakia, Slovenia, Esthonia, Hungary, Latvia, Lithuania,
Malta and Romania
HOS (TABLES ANNEX) - SEPTEMBER 2014 (3/3)
Provisional data
Hotel Price Index (HPI). 2008 Base
September 2014
Provisional data
National General Index and breakdown by
Autonomous Cities and Communities
Index
TOTAL
Andalucía
Aragón
Asturias, Principado de
Balears, Illes
Canarias
Cantabria
Castilla y León
Castilla - La Mancha
Cataluña
Comunitat Valenciana
Extremadura
Galicia
Madrid, Comunidad de
Murcia, Región de
Navarra, Comunidad Foral de
País Vasco
Rioja, La
Ceuta
Melilla
95.1
Annual growth
rate
2.2
87.8
64.9
85.1
108.3
101.7
87.8
87.0
81.6
98.0
87.8
83.8
89.4
80.5
79.7
82.0
99.5
85.8
104.5
100.6
1.5
-0.1
-3.1
4.1
3.3
3.3
0.9
-0.4
-0.3
1.9
-1.9
0.3
4.7
0.8
-1.0
3.1
-2.5
-1.3
3.0
National General Index and breakdown by
categories
Index
TOTAL
HOTELS: Gold stars
Five
Fourth
Three
Two
One
HOSTALS: Silver stars
Three and two
One
HPI (ANNEX OF TABLES) - September 2014
24th October 2014
95.1
Annual growth
rate
2.2
90.8
93.2
99.7
92.6
100.7
3.9
1.8
3.0
0.5
2.3
91.8
93.2
2.1
-5.1
Indicators on the Profitability of the Hotel Sector
September 2014
Provisional data
(*)
National ADR and RevPAR and breakdown by Autonomous
Cities and Communities
ADR
(in euros)
76.7
75.7
51.9
54.7
81.9
79.4
64.5
54.0
56.2
84.2
66.0
51.8
54.0
83.0
62.0
58.6
83.4
60.7
74.6
65.3
TOTAL
Andalucía
Aragón
Asturias, Principado de
Balears, Illes
Canarias
Cantabria
Castilla y León
Castilla - La Mancha
Cataluña
Comunitat Valenciana
Extremadura
Galicia
Madrid, Comunidad de
Murcia, Región de
Navarra, Comunidad Foral de
País Vasco
Rioja, La
Ceuta
Melilla
Annual growth
rate
6.2
3.0
1.9
-0.1
10.7
5.7
10.8
1.2
2.4
6.8
2.5
-2.7
1.1
10.0
-4.2
-2.9
4.6
-1.9
9.2
1.2
RevPar
(in euros)
53.8
51.9
19.5
27.1
71.4
64.9
32.2
23.9
19.4
60.7
47.0
18.7
22.9
61.1
34.1
30.3
59.0
39.3
41.8
45.0
Annual growth
rate
11.0
8.1
2.7
13.6
12.3
10.4
17.2
12.0
10.1
8.4
9.4
0.7
6.8
27.5
5.8
5.4
11.1
3.0
18.9
4.6
(*)
National ADR and RevPar and breakdown by
categories
TOTAL
HOTELS: Gold stars
Five
Four
Three
Two
One
GUESTHOUSES: Silver stars
Three and two
One
ADR
(in euros)
76.7
Annual growth
rate
6.2
RevPar
(in euros)
53.8
Annual growth
rate
11.0
164.5
84.5
64.4
52.3
49.0
5.7
5.4
8.3
-2.0
1.0
126.5
67.8
48.7
27.6
21.0
14.2
9.6
11.8
1.0
5.0
49.5
39.6
5.3
-4.7
20.2
14.5
16.0
3.3
(*) ADR: Average Daily Rate
RevPAR: Revenue per Available Room
Indicators on Profitability (ANNEX OF TABLES) - September 2014
24th October 2014
© Copyright 2026
