
Warming and wetting signals emerging from analysis of changes in
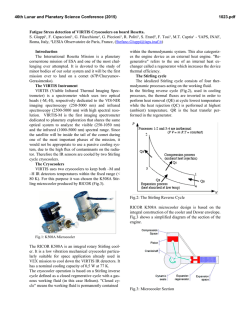
(This is a sample cover image for this issue. The actual cover is not yet available at this time.)
This article appeared in a journal published by Elsevier. The attached
copy is furnished to the author for internal non-commercial research
and education use, including for instruction at the authors institution
and sharing with colleagues.
Other uses, including reproduction and distribution, or selling or
licensing copies, or posting to personal, institutional or third party
websites are prohibited.
In most cases authors are permitted to post their version of the
article (e.g. in Word or Tex form) to their personal website or
institutional repository. Authors requiring further information
regarding Elsevier’s archiving and manuscript policies are
encouraged to visit:
http://www.elsevier.com/copyright
Author's personal copy
Global and Planetary Change 100 (2013) 295–307
Contents lists available at SciVerse ScienceDirect
Global and Planetary Change
journal homepage: www.elsevier.com/locate/gloplacha
Warming and wetting signals emerging from analysis of changes in climate extreme
indices over South America
María de los Milagros Skansi a,⁎, Manola Brunet b, c, Javier Sigró b, Enric Aguilar b,
Juan Andrés Arevalo Groening d, Oscar J. Bentancur e, Yaruska Rosa Castellón Geier f,
Ruth Leonor Correa Amaya g, Homero Jácome h, Andrea Malheiros Ramos i, j, Clara Oria Rojas k,
Alejandro Max Pasten l, Sukarni Sallons Mitro m, Claudia Villaroel Jiménez n, Rodney Martínez o,
Lisa V. Alexander p, P.D. Jones c, q
a
Departamento Climatología, Servicio Meteorológico Nacional, 25 de Mayo 658 (C1002ABN), Ciudad Autónoma de Buenos Aires, Argentina
Centre for Climate Change, Department of Geography, University Rovira i Virgili, Av. Catalunya, 35, 43071, Tarragona, Spain
Climatic Research Unit, University of East Anglia, Norwich, NR4 7TJ, United Kingdom
d
Instituto Nacional de Meteorología e Hidrología (INAMEH), Carretera Hoyo de la Puerta, Parque Tecnológico Sartenejas, Edificio INAMEH. Municipio Baruta,
Estado Miranda, 1080 Venezuela
e
Dpto. Biometría, Estadística y Computación, Facultad de Agronomía, UDELAR, Av. Garzón 780, Montevideo, CP.12900, Uruguay
f
Unidad Climatologia, Institucion: Servicio Nacional de Meteorologia e Hidrologia (SENAMHI), Calle Reyes Ortiz No. 41 (Zona Central), La Paz, Bolivia
g
Grupo de Gestión de Datos y Red Meteorológica, Subdirección de Meteorología, Instituto de Hidrología, Meteorología y Estudios Ambientales, IDEAM,
Carrera 10 No. 20–30 Piso 6, Colombia
h
Dpto. de Climatología, Instituto Nacional de Meteorología e Hidrología (INAMHI), Calle Iñaquito No. N36-14 y Corea, Codigo Postal No. 16-310, Quito, Ecuador
i
Coordenação de Desenvolvimento e Pesquisa (CDP). Instituto Nacional de Meteorologia (INMET). Eixo Monumental, Via S1 Sudoeste. 70680-900, Brasília-DF, Brazil
j
Geophysics Centre of Évora (CGE), University of Évora, Portugal. Rua Romão Ramalho, 59. 7000-671. Évora, Portugal
k
Centro de Prediccion Numerica de la Direccion General de Meteorología, Servicio Nacional de Meteorologia e Hidrologia del Peru, Jr. Cahuide 785, Jesus Maria, Lima, Peru
l
Direccion Nacional de Aeronautica Civil–Dirección de Meteorologia e Hidrología Gerencia de Climatologia e Hidrología, Departamento de Climatología, Cnel.
Francisco Lopez 1080 c/ De La Conquista, Paraguay
m
Meteorological Service Suriname, Magnesiumstraat 41, Paramaribo, Surinam
n
Direccion Meteorológica de Chile, Subdepartamento de Climatología y Meteorología Aplicada, Seccion de Met. Aplicada — Oficina de Estudios, Av. Portales 3450, Estación Central,
Santiago, Chile
o
Centro Internacional para la Investigación del Fenómeno de El Niño (CIIFEN), Escobedo 1204 y 9 de Octubre, P.O. Box 09014237, Guayaquil, Ecuador
p
Climate Change Research Centre and Centre of Excellence for Climate Systems Science, University of New South Wales, Sydney NSW 2052, Australia
q
Center of Excellence for Climate Change Research/Dept of Meteorology, Faculty of Meteorology, Environment and Arid Land Agriculture, King Abdulaziz University, P. O. Box 80234,
Jeddah 21589, Saudi Arabia
b
c
a r t i c l e
i n f o
Article history:
Received 30 July 2012
Accepted 11 November 2012
Available online 20 November 2012
Keywords:
daily temperature and precipitation data
quality control
homogenization
climate extreme indices
temperature extreme indices change
precipitation extreme indices change
ETCCDI
South America
Amazonia
a b s t r a c t
Here we show and discuss the results of an assessment of changes in both area-averaged and station-based
climate extreme indices over South America (SA) for the 1950–2010 and 1969–2009 periods using
high-quality daily maximum and minimum temperature and precipitation series. A weeklong regional workshop in Guayaquil (Ecuador) provided the opportunity to extend the current picture of changes in climate
extreme indices over SA.
Our results provide evidence of warming and wetting across the whole SA since the mid-20th century onwards. Nighttime (minimum) temperature indices show the largest rates of warming (e.g. for tropical nights,
cold and warm nights), while daytime (maximum) temperature indices also point to warming (e.g. for cold
days, summer days, the annual lowest daytime temperature), but at lower rates than for minimums. Both
tails of night-time temperatures have warmed by a similar magnitude, with cold days (the annual lowest
nighttime and daytime temperatures) seeing reductions (increases). Trends are strong and moderate (moderate to weak) for regional-averaged (local) indices, most of them pointing to a less cold SA during the day
and warmer night-time temperatures.
⁎ Corresponding author at: Departamento Climatología, Servicio Meteorológico Nacional, 25 de Mayo 658 (C1002ABN), Ciudad Autónoma de Buenos Aires, Argentina. Tel.: +54
11 51676767x18259/18273; fax: +54 11 51676709.
E-mail addresses: [email protected] (M.M. Skansi), [email protected] (M. Brunet), [email protected] (J. Sigró), [email protected] (E. Aguilar),
[email protected] (J.A. Arevalo Groening), [email protected] (O.J. Bentancur), [email protected] (Y.R. Castellón Geier), [email protected] (R.L. Correa Amaya),
[email protected] (H. Jácome), [email protected] (A. Malheiros Ramos), [email protected] (C. Oria Rojas), [email protected] (A.M. Pasten),
[email protected] (S. Sallons Mitro), [email protected] (C. Villaroel Jiménez), [email protected] (R. Martínez), [email protected] (L.V. Alexander),
[email protected] (P.D. Jones).
0921-8181/$ – see front matter © 2012 Elsevier B.V. All rights reserved.
http://dx.doi.org/10.1016/j.gloplacha.2012.11.004
Author's personal copy
296
northeastern Brazil
western South America
southeastern South America
M.M. Skansi et al. / Global and Planetary Change 100 (2013) 295–307
Regionally-averaged precipitation indices show clear wetting and a signature of intensified heavy rain events
over the eastern part of the continent. The annual amounts of rainfall are rising strongly over south-east SA
(26.41 mm/decade) and Amazonia (16.09 mm/decade), but north-east Brazil and the western part of SA have
experienced non-significant decreases. Very wet and extremely days, the annual maximum 5-day and 1-day
precipitation show the largest upward trends, indicating an intensified rainfall signal for SA, particularly over
Amazonia and south-east SA. Local trends for precipitation extreme indices are in general less coherent spatially,
but with more general spatially coherent upward trends in extremely wet days over all SA.
© 2012 Elsevier B.V. All rights reserved.
1. Introduction
The study of extreme weather and climate events is a current topic
of higher scientific and societal interest. It is being fuelled by relevant
scientific communities, including various climatological branches that
assess climate change (e.g. observational, modeling, adaptation and impact sectors). This issue has been addressed recently by the Intergovernmental Panel on Climate Change (IPCC, 2012) in the Special Report
on Extremes (SREX). This has provided the most comprehensive global
review and assessment on the relation between climate extremes, their
impacts and the strategies to manage associated perils.
A number of issues, however, constrain our current understanding
and scientific confidence in the observed changes in extremes.
Among others, availability and accessibility of long-term and highquality climate series at the relevant time scales for assessing extremes
(e.g. daily and sub-daily) is one of the most serious gaps, particularly
over some regions of the world (often called climate-data-sparse regions), such as most of South America. The availability of climate series
is also limited temporally, since for most of the world the length of
digitized daily climate series (e.g. for temperature and precipitation)
only goes back in time to the mid-20th century and for many regions
is restricted to the 1970s onwards. In addition, there are also concerns
regarding the quality and homogeneity of the available series, which
could compromise the robustness of assessed changes. Many countries
also restrict access to their higher temporal resolution time-series. In
short, the quality and quantity of accessible climate series still limit
our understanding of the observed changes in climate extremes, particularly over data-sparse regions (Trenberth et al., 2007: Appendix 3.B.2).
A number of international groups have made major efforts to advance both knowledge of global changes in climate extremes and to promote the recovery and development of climate data (i.e. ensuring data
quality and homogeneity) over data-sparse regions. In this regard, the
ETCCDI1 has largely contributed to this effort by advancing knowledge
on changes in climate extremes through the formulation of a suite of
27 core climate extreme indices calculated from daily temperature
and precipitation data (http://cccma.seos.uvic.ca/ETCCDI/list_27_indices.
shtml). They have also promoted the analysis and monitoring of extremes
around the world through organizing regional workshops in data-sparse
regions that have involved scientists from National Meteorological and
Hydrological Services (NMHS) as part of ETCCDI's two-pronged approach
(Peterson and Manton, 2008, p. 1266).
Contributions from the ETCCDI to filling in gaps in data-sparse regions and enhancing analyses of the global picture of changes in extremes (Trenberth et al., 2007, based on Alexander et al., 2006) have
helped to improve knowledge and understanding about how and how
much climatic extremes are changing under climate change. However,
1
Joint World Meteorological Organization (WMO) Commission for Climatology
(CCl)/World Climate Research Programme (WCRP) project on Climate Variability and
Predictability (CLIVAR)/Joint WMO–Intergovernmental Oceanographic Commission
of the United National Educational, Scientific and Cultural Organization (UNESCO)
Technical Commission for Oceanography and Marine Meteorology (JCOMM) Expert
Team on Climate Change Detection and Indices (ETCCDI: http://www.clivar.org/
organization/etccdi).
the network of stations used in global analysis (e.g. Alexander et al.,
2006; Vose et al., 2005 or Brown et al., 2008), are not globally uniform
and contain irregular or limited data over northern Latin America and
South America as a whole, Africa, parts of Australia, India, the Middle
East and Southern Asia, which restricts our ability to estimate changes
in extremes over these regions (Seneviratne et al., 2012: 123).
For South America (SA hereafter), some effort has been made to assess changes in climate extremes based on temperature and precipitation station data at the daily scale (for temperature extremes: Vincent
et al., 2005; Alexander et al., 2006 and for precipitation extremes:
Haylock et al., 2006; Khan et al., 2007; Sheffield and Wood, 2008;
Grimm and Tedeschi, 2009; Dai, 2011; Mo and Berbery, 2011).
Parts of SA have been more intensively explored, such as SE SA for observed changes in temperature extremes (e.g. Rusticucci and Barrucand,
2004; Barrucand et al., 2008; Marengo and Camargo, 2008; Rusticucci
and Renom, 2008; Marengo et al., 2009; Renom, 2009; Tencer, 2010;
Rusticucci, 2012) or for precipitation extremes (e.g. Dufek and Ambrizzi,
2008; Dufek et al., 2008; Marengo et al., 2009; Pscheidt and Grimm,
2009; Penalba and Robledo, 2010; Llano and Penalba, 2011; Teixeira
and Satyamurty, 2011). Other sub-regional studies are focused on NE
Brazil for precipitation extremes (e.g. Santos and Brito, 2007; Silva and
Azevedo, 2008; Santos et al., 2009) and over western SA for temperature
extremes (Falvey and Garreaud, 2009) and for precipitation extremes
(Dufek et al., 2008).
From these studies, there is a clear geographical imbalance in the assessments of one or another part of SA and in the number of stations
employed. Most previous studies have focused on southern SA, with
limited studies and data over the northern half of SA. Most analyses
however point to observed changes in temperature extremes consistent
with warming when averaged over the whole continent but with regional variations (Vincent et al., 2005: 5016–5020). However, while extreme indices based on minimum (i.e. night-time) temperature have
warmed, those based on maximum (i.e. daytime) temperature show little change or have cooled, particularly over southern SA (Rusticucci,
2012, pp. 4–6).
The scientific confidence in the observed changes over SA, therefore, ranges from low to medium, depending on the region analyzed
(Seneviratne et al., 2012: Table 3.2, p. 194). There is low confidence
in the assessed changes in extremes based on either daily maximum
or minimum temperature data over the northern half of SA, including
Amazonia, due to the irregular network in these regions. In the southern half of SA (including NE Brazil, south, SE and west Coast of SA)
there is medium confidence in the estimated extreme temperature
trends. In the case of heat waves and warm spells, the confidence is
low over all SA, including southern SA, due to either insufficient evidence or to spatially varying trends.
A similar uncertain picture is apparent when assessing changes in
precipitation extremes over all SA, due to both the scarcity of studies
and spatially incoherent trends in either heavy events (e.g. those defined as daily precipitation >95th or 99th percentiles) or in dryness
(e.g. consecutive dry days — CDD, Palmer Drought Severity Index –
PDSI – indices) reducing the scientific confidence in the estimated
trends. There is medium confidence that there have been increases in
heavy precipitation events over Amazonia and many parts of NE Brazil,
but a few areas in the west (W) coast of SA indicate decreases or mixed
Author's personal copy
M.M. Skansi et al. / Global and Planetary Change 100 (2013) 295–307
results (Seneviratne et al., 2012: Table 3.2, p. 194, based on Haylock et
al., 2006; Santos and Brito, 2007; Silva and Azevedo, 2008; Santos et
al., 2009).
The scientific confidence provided by the SREX report for changes in
dryness in SA is low either due to spatially varying trends or inconsistent results among assessments. Slight reductions in the CDD index
have been estimated over Amazonia, but with inconsistent spatial
signals. However the opposite signal (tenuous increases in dryness)
has been found over southern SA and contrasting spatial signals and
inconsistencies among studies over NE Brazil and W SA also return
low confidence in the estimated trends in dryness (Seneviratne et al.,
2012: Table 3.2, p. 194 based on Haylock et al., 2006; Dufek and
Ambrizzi, 2008; Dufek et al., 2008; Sheffield and Wood, 2008; Llano
and Penalba, 2011; Dai, 2011).
With the aim of improving both the spatial and temporal coverage of former assessments (e.g. Vincent et al., 2005; Haylock et al.,
2006) and enhancing the global picture of changes in climate extremes over SA, a week-long ETCCDI regional workshop was held
in Guayaquil (Ecuador) in the Centro Internacional para la
Investigación del Fenomeno El Niño (CIIFEN) in January 2011. This
workshop followed the “recipe” devised by the ETCCDI and enabled
a more extended assessment (both spatially and temporally) of
changes in climate extremes over SA.
Therefore, this study aims to analyze both local and regional/
sub-regional changes in annual temperature and precipitation
extremes over SA. This is done by calculating a core set of 27 ETCCDI
extreme indices from high-quality daily weather data and estimating
trends.
In the next sections we provide details of the network and indices
used for assessing recent changes, the methodology applied for ensuring the quality and homogeneity of the final series employed for estimating local and regional annual trends. In addition, we discuss our
findings and provide insights on the shortcomings that SA countries
are still facing to gain a truly regional picture of the observed changes
in extremes.
2. Data, methods, indices and trend estimation
2.1. Rationale for the ETCCDI regional workshop
In a previous ETCCDI regional workshop held in Brazil (Vincent et al.,
2005; Haylock et al., 2006) in 2004, a network of 68 (54) temperature
(precipitation) time-series covering the period 1960–2000 were analyzed, which enabled the first regional assessment on changes in extremes over SA as a whole to be produced (Rusticucci, 2012: p. 4).
The low density of stations employed in both studies supported
the need for enhancing the spatial and temporal availability of
high-quality daily time-series since only a limited assessment of observed changes could be performed. The ETCCDI regional workshop
held in Guayaquil (Ecuador) in January 2011 presented an opportunity to extend the network for SA. Participants from mainly NMHS'
in Argentina, Bolivia, Brazil, Chile, Colombia, Ecuador, Paraguay,
Peru, Surinam, Uruguay and Venezuela attended the workshop and
brought their best, longest and most complete digital daily maximum
temperature (TX), minimum temperature (TN) and precipitation
(RR) time-series for analysis.
The participants brought daily records for 261 (262) TX (TN) series and 280 RR records from a selection of data available in their
national databanks, representing well distributed stations and covering the main climatic types in their countries. During the workshop itself only about 15% of records could be analyzed, so intense
post-workshop analysis was required. Many time-series were discovered to contain large data gaps or many missing values that
compromised data completeness and their suitability for computing
extreme indices. This is common among South American national
networks.
297
2.2. Time-series quality control (QC), homogeneity testing and
homogenization
Time-series were quality controlled using RClimDex. This software
was developed by the ETCCDI and is freely available at http://cccma.
seos.uvic.ca/ETCCDI/software.shtml. We complemented RClimDex
with an additional QC procedure and software (also freely available
at http://www.c3.urv.cat/data1.html along with the user manual
(Aguilar et al., 2010)). The time-series were subjected to the QC procedures by the participants either during or after the workshop. This
involved identifying and documenting potential non-systematic errors and ensuring that the time-series were reasonably free of gross
errors, at the same time as ensuring internal, temporal and spatial
consistency of the records.
RClimDex and the additional QC software provide several graphical and numerical output files which can be used in tandem to further
assess the quality of the data. Graphical output includes monthly and
interannual box-plots, which allow for the identification of outliers
for RR, TX, TN and DTR series. Assessment can then be made as to
the reliability of data by using expert judgment and by consulting
original data sources. Details of all the additional numerical and
graphical output is given in Aguilar et al. (2010: pp.4–6).
Once the QC exercise is complete, workshop participants can test
their time series for consistency or “homogeneity”. With the timeseries quality controlled at the workshop, the attendees were trained
in the application of two homogeneity tests: (i) RHtestV3 method and
software (Wang et al., 2010: section 5, see http://cccma.seos.uvic.ca/
ETCCDI/software.shtml) and (ii) an application of the Standard Normal
Homogeneity Test (Alexandersson and Moberg, 1997) run in R and
called RSNHT (available at http://www.c3.urv.cat/data1.html; Aguilar,
2010). RHtestV3 was used to test homogeneity on the RR series and
RSNHT was used not only for testing homogeneity, but also for adjusting
the TX/TN series at the monthly scale. The homogeneity testing of the RR
series was also supported by visual inspection of the indices and looking
for unusual behavior. After homogeneity testing of the RR time-series, 28
records were rejected for having too many break points and thus only
252 out of the original 280 RR series were used to compute the extreme
indices.
The 261 (262) TX (TN) records were subjected to homogenization
by using the RSNHT software. On average 1.1 (1.2) breaks in TX (TN) series were detected, validated and accounted for by interpolating monthly adjustments returned by the RSNHT to the daily scale following the
procedure recommended by Vincent et al. (2002: pp. 1325–1326).
2.3. The network used, extreme indices and trend estimation
The network brought by the attendees to the workshop is shown in
Table A in the supplementary information. This table provides the station names by country, start and end dates, geographical coordinates,
elevation and the variables available at the station. Fig. 1 shows the
location of the original station network assessed, depicting the final
number of stations used for assessing extremes (circles) and those
rejected (triangles), along with the borders of the fours sub-regions
analyzed as adapted from the SREX report.
Following QC, homogeneity testing and homogenization, only 188
(252) temperature (precipitation) series were assessed to be suitable
for computing extreme indices (those locations shown in Fig. 1);
although for percentile indices only a maximum of 145 stations were
considered suitable. The network includes records spanning the whole
of the 20th century up to 2010, but with only a few records going
back to the 1900s (e.g. in Surinam for RR records) or back to the
1930s and 1940s (e.g. in Argentina and Colombia for the three variables
and decades respectively, and Venezuela for RR for the latter decade).
Although about 28% of the stations start in the 1950s, it is not until
the late 1960s that about 94% of the stations have data (see Table A in
the supplementary data). This latter period allows a larger number of
Author's personal copy
298
M.M. Skansi et al. / Global and Planetary Change 100 (2013) 295–307
10
SA, likely the best analyzed region in SA so far). For analysis of precipitation extremes there has been much better coverage in previous analyses
(e.g. Penalba and Robledo, 2010, Fig. 2, p. 534 and Table 1, p. 535–536
over the La Plata Basin; Teixeira and Satyamurty, 2011, Fig. 2, p. 1915
for southern and SE Brazil), but those time-series do not extend to recent
years.
The authors are aware that even with the enhanced spatial and
temporal coverage presented here, the complex topography and
large variety of climates in this continent, make it difficult to comprehensively analyze observed changes in climate extremes at lower
spatial scales (e.g. national, sub-regional). Our network is, nevertheless, large enough to improve the global picture over all SA. This is
particularly the case over the northern half of SA, but also in the western part of SA. The new study also improves the temporal extent over
all SA.
AMZ
0
NEB
Latitude
-10
-20
-30
-40
-50
WSA
-80
SSA
-70
-60
-50
-40
-30
Longitude
Fig. 1. Location map showing the network of stations assessed, including those used
(circles) and not used (triangles). Stations with temperature and precipitation data
are shown in red, while green (yellow) have only precipitation (temperature) series.
Solid (empty) circles are those considered homogeneous or homogenized (not homogenized temperature records, only precipitation series used). Boxes identify the four SA
sub-regions adapted from the SREX Report (see text for details).
indices to be calculated annually from stations mainly located in
the northernmost part of SA where data availability is very limited in
previous studies. This justifies the analysis periods used in this paper
i.e. 1969–2009 for the common analysis of local trends and the 1950–
2010 for the regional and sub-regional series of extreme indices
assessment.
A visual comparison between our Fig. 1 and Figure 1 in Vincent et al.
(2005: p. 5015), Figure 1 in Haylock et al. (2006: p. 1494) and Fig. 3,
plots a–f, in Marengo et al. (2009, p. 2248) highlights the improvement
in the spatial coverage of the data and indices used in this study. An
enhanced spatial resolution is especially evident over the northern
half of SA, including the whole W SA. The density of stations particularly
over Brazil, Colombia, Surinam or Venezuela is somewhat better than
that used in previous studies and in Ecuador, Peru, Chile it is remarkably
better. This enables us to expand the analysis to these parts of SA,
which have been highlighted in recent reviews as data-sparse areas
(e.g. Rusticucci, 2012, p.2; Seneviratne et al., 2012: Table 3.2, p. 194).
The improvement in coverage of this study can also be seen
over southern SA when compared with previous SA assessments
(e.g. Vincent et al., 2005; Haylock et al., 2006). Over the western coast
of SA, both studies have assessed relatively few numbers of records:
20 (16) temperature (precipitation) series. In this study we have analyzed 53 temperature and precipitation series over this sector, which
also expands across Peru, Ecuador and Colombia where previous coverage was scarce.
Other studies focused on parts of SA use similar or reduced coverage
than this study (e.g. Falvey and Garreaud, 2009: Table 1; Rosenbluth
et al., 1997: Table Ia–b pp. 69–70 and Fig. 1, p.71; Rusticucci and
Barrucand, 2004: Fig. 1, p. 4110; Barrucand et al., 2008: Fig. 1;
Rusticucci and Renom, 2008: Fig. 1 in p. 1084 and pp. 1084–1085;
Renom, 2009: p. 13 for temperature extremes over the southern part of
2.3.1. The ETCCDI extreme indices
As discussed elsewhere (e.g. Klein Tank et al., 2009; Zhang et al.,
2011; Zwiers et al., 2011), the ETCCDI extreme indices were defined
with the aim of both monitoring changes in “moderate” extremes
and for enhancing climate change detection studies given their high
signal-to-noise ratio (Zhang et al., 2011: p. 854).
To compute the ETCCDI extremes requires long, continuous, quality
controlled and homogeneous daily time-series. This requirement is an
issue in many parts of the world, including SA, where there is a lack of
high-quality daily measurements covering several decades. Therefore,
for indices calculation using RClimDex, a number of conditions have to
be met. An annual value of an index will not be calculated if there are
more than 15 days missing in a year. In addition, the percentile-based
indices will only be calculated if at least 80% of the data are present in
the reference period. These requirements for data completeness had
an impact on the final number of extreme indices computed from the
homogenized temperature series in this study, since only a maximum
of 170 (145) locations could compute temperature (percentile-based)
indices.
From the 27 core extreme or “moderately extreme” indices defined by the ETCCDI, we assess 13 (9) temperature (precipitation) indices in this assessment. Table 1 outlines index names, definitions,
units and the number of stations for which each index has been calculated for both periods assessed. While the indices chosen can be calculated both annually and monthly by RClimDex, in this assessment
we only consider the annual values.
Percentile indices are calculated using the 1971–2000 base period,
in order that most series could be included in the trend analysis over
the 1950–2010 period. To eliminate possible bias in the trend estimation of the percentile-based indices associated with the existing inhomogeneities at the limits of the reference period, the RClimDex
software follows the bootstrapping approach proposed by Zhang et
al. (2005: pp. 1643–1644).
2.3.2. Linear trend estimation of indices
Although the RClimDex software also produces trend files for each
index, in this study the estimated change is explained by a linear trend
fitted over two different periods: (i) a common period (1969–2009)
used for assessing local trends and (ii) the period 1950–2010 for which
the linear trends have been estimated on a regional (all SA) and
sub-regional scales as defined by SREX (IPCC, 2012: Fig. 3–1, p. 123 and
Appendix 3.A-2. See also Fig. 1).
Trends were calculated annually by adapting Sen's (1968) slope
estimator, following the method proposed by Zhang et al. (2000) in
a study of annual temperature and precipitation change over Canada.
This more robust approach for trend estimation was adopted because
the indices have mostly non-Gaussian distributions and also because
daily data could contain large real outliers that could compromise the
results returned by the non-resistant least squares method.
Author's personal copy
M.M. Skansi et al. / Global and Planetary Change 100 (2013) 295–307
C deg 133
150
C deg 136
148
C deg 133
148
C deg 137
149
%
days
131
144
%
days
127
145
%
days
131
145
%
days
128
145
C
Deg
121
170
tabulated values in Kendall (1955). Trends have only been estimated
for an index if less than 25% of the annual values were missing. This
has had an impact over the northern part of SA, particularly over Brazil,
Colombia and Venezuela for temperature indices. This highlights
the need to fill in gaps by recovering, digitizing and reconstructing
long-term and high-quality climate records over these areas.
To provide a global picture of the sign and magnitude of the estimated changes in extreme indices over all SA and over its four sub-regions:
Amazonia (region 7), the NE of Brazil (region 8), W SA (region 9) and SE
SA (region 10) (see Appendix 3.A-2 of the IPCC, 2012 for coordinates
and Fig. 1 for the adapted borders), we have calculated five (one for
all SA and four for its regions) simple area-averaged indices from the
available indices series estimated for each region. As stated, the indices
trends have been estimated locally for the common period 1969–2009,
which has been selected because it was the time interval that also
returned a larger number of trends with better cover the northernmost
part of SA. They are mainly used for assessing spatial coherency of the
emerging signals.
To minimize latitudinal/longitudinal and altitudinal effects on trend
estimation for area-averaged indices, we created anomalies with respect to a 1971–2000 reference period for each station series for all indices that are not based on percentiles and whose units are given in
absolute quantities (those shown in italics in Table 1). This makes the
assessments between stations more comparable given the rich climatic
diversity in SA. Also, to adjust the variance bias associated with varying
the sample size in these regionally/sub-regionally averaged series
over time, we applied the approach developed by Osborn et al. (1997:
pp. 92–93) to minimize this bias in the indices time-series.
Days
126
170
3. Results and discussion
Days
100
141
Days
145
145
Days
145
144
mm
169
238
Table 1
Temperature and precipitation indices from the ETCCDI analyzed in this assessment
with associated definitions and units (for further details see also http://
cccma.seos.uvic.ca/ETCCDI/list_27_indices.shtml), along with the number of stations
for which each index has been computed for both periods: the 1950–2010 for
area-averaged indices and 1969–2009 for station-based indices. All indices are calculated annually from January to December. Italics indicate those indices that are not
percentile-based (see Section 2.3.2 for details).
ID
Index name
Indices definitions
Units No. of stations
1969– 1950–
2009
2010
TXx
Highest
Tmax
Highest
Tmin
Lowest Tmax
Annual highest value of daily
maximum temperature
TNx
Annual highest value of daily
minimum temperature
TXn
Annual lowest value of daily
maximum temperature
TNn
Lowest Tmin Annual lowest value of daily
minimum temperature
TN10p
Cold nights Percentage of days when
TN b 10th percentile from the
1971–2000 reference period
TX10p
Cold days
Percentage of days when
TXb 10th percentile from the
1971–2000 reference period
TN90p
Warm
Percentage of days when
nights
TN >90th percentile from the
1971–2000 reference period
TX90p
Warm days Percentage of days when
TX> 90th percentile from the
1971–2000 reference period
DTR
Daily
Annual mean difference between
temperature TX and TN
range
SU25
No. summer Annual count of days when
days
TX > 25 °C
TR20
No. tropical
Annual count of days when
nights
TN > 20 °C
WSDI
Warm spell Annual count of days with at
duration
least 6 consecutive days when
index
TX> 90th percentile from the
1971–2000 reference period
CSDI
Cold spell
Annual count of days with at
duration
least 6 consecutive days when
index
TN b 10th percentile from the
1971–2000 reference period
Rx1day
The highest
Annual maximum 1-day
1-day RR
precipitation
amount
Rx5day
The highest
Annual maximum consecutive
5-day RR
5-day precipitation
amount
SDII
Simple daily Annual total precipitation divided
RR intensity by the number of wet days
index
(defined as
precipitation ≥ 1.0 mm) in the
year
R20
No. of heavy Annual count of days when daily
RR days
RR ≥20 mm
CDD
Consecutive Maximum number of consecutive
dry days
days with daily rainfall b 1 mm
CWD
Consecutive Maximum number of consecutive
wet days
days with daily rainfall ≥ 1 mm
R95p
Very wet
Annual total precipitation when
days
RR >95th percentile from the
1971–2000 reference period
R99p
Extremely
Annual total precipitation when
wet days
RR >99th percentile from the
1971–2000 reference period
PRCPTOT Wet-days
Annual total RR from wet days
RR >1 mm
annual
amount
299
In this section, we describe the results of the analysis carried out for
assessing changes in annual temperature and precipitation extremes
over SA, both area-averaged and station-based. First, we examine the
spatially-averaged trends for the extreme indices and, second, we provide the results for local trends to assess spatial coherency. Next, we discuss and put our findings in the context of previous assessments.
3.1. Regional and sub-regional trends
mm
169
240
mm/
day
173
238
Days
170
240
Days
173
241
Days
174
242
mm
171
241
mm
152
239
mm
174
244
Annual trends of all indices are tested for statistical significance at
the 0.01 (0.05) confidence level for regional and sub-regional averaged
indices (station-based trends) unless otherwise stated. The 95% confidence intervals for trend coefficients have also been estimated from
Table 2 (Table 3) shows the trend coefficients estimated, along with
their significance levels, for each TX and TN (RR) area-averaged indices
for the 1950–2010 period at both global-all SA- and sub-regional levels.
The calculated ± standard errors for the 95% confidence interval of the
extreme indices coefficient trend are given in brackets. Significant signals of warming (wetting and intensified rainfall events) are evident
throughout the whole continent (mainly over the eastern part of SA, excluding NE Brazil).
Over all SA, the TN-based indices record faster rates of warming than
TX-based indices. Strong reductions (increases) are estimated for cold
nights (warm nights), while cold (warm) days shows moderate
(weak) downward (upward) trends (significant at the 5% for the latter).
Tropical nights (TR20) are also warming at higher rates than summer
days (SU25), with TR20 (SU25) recording strong (moderate) upward
trends (Table 2). Also the annual coldest night and day and the warmest
night show a strong tendency toward higher temperatures, while the
warmest day shows no significant change. Reductions in the duration
of cold spells (a proxy for cold waves) are also significant over all SA,
but increases in warm spells (a proxy for heat waves) are weak and
do not reach statistical significance for the continent as a whole. As
the TN-based indices change at higher rates than the TX indices, the annual Diurnal Temperature Range (DTR) shows a moderate downward
trend over all SA.
Fig. 2 shows annual anomaly series for cold nights and days (Fig. 2a
and c) and warm nights and days (Fig. 2b and d) averaged over all SA,
depicting the warming signal over the continent as a whole. Fig. 3
Author's personal copy
300
M.M. Skansi et al. / Global and Planetary Change 100 (2013) 295–307
Table 2
Annual trends (in days/decade) for the period 1950–2010 for regionally and sub-regionally averaged temperature indices using a robust linear trend estimate along with the±standard
errors in brackets using a 95% confidence interval (see Section 2.3.2 for details). Bold (italic) indicates significance at 0.01 (0.05) levels. AMA stands for Amazonia, NEB for NE Brazil,
WSA for western South America and SESA for SE South America.
Index
All SA
AMA (region 7)
NEB (region 8)
WSA (region 9)
SESA (region 10)
TXn
TXx
TNn
TNx
TX10p
TX90p
TN10p
TN90p
SU25
TR20
WSDI
CSDI
DTR
0.20 (0.11/0.28)
−0.05 (−0.15/0.06)
0.20 (0.09/0.31)
0.18 (0.13/0.22)
−0.61 (−0.988/−0.43)
0.62 (0.10/1.04)
−1.77 (−2.11/−1.49)
1.54 (1.17/1.90)
1.26 (0.20/2.18)
4.68 (3.81/5.61)
0.09 (−0.44/0.72)
−1.09 (−1.45/−0.83)
−0.12 (−0.16/−0.07)
0.19 (0.09/0.29)
0.12 (0.04/0.18)
0.32 (0.24/0.41)
0.24 (0.17/0.31)
−0.85 (−1.28/−0.35)
1.20 (0.67/1.73)
−2.27 (−2.85/−1.81)
2.28 (1.73/2.87)
1.60 (0.65/2.44)
1.67 (1.32/2.07)
1.05 (0.31/2.13)
−1.92 (−2.94/−1.09)
0.40 (0.30/0.56)
0.30 (0.14/0.45)
0.34 (0.23/0.46)
0.56 (0.37/0.73)
0.34 (0.27/0.40)
−2.09 (−2.56/−1.62)
3.05 (1.94/4.09)
−4.50 (−5.36/−3.68)
4.02 (3.41/4.71)
6.94 (5.07/8.71)
10.61 (8.61/12.11)
1.78 (0.65/3.90)
−3.74 (−5.50/−2.12)
−0.07 (−0.19/0.06)
0.07 (−0.03/0.16)
0.11 (−0.01/0.24)
0.19 (0.07/0.30)
0.22 (0.15/0.28)
−0.53 (−1.16/0.13)
1.18 (0.61/1.86)
−1.60 (−2.02/−1.10)
1.60 (1.07/2.06)
1.46 (0.63/2.37)
2.86 (2.02/4.04)
0.35 (0.05/0.66)
−0.81 (−1.24/−0.45)
0.17 (0.07/0.28)
0.20 (0.05/0.33)
−0.14 (−0.27/−0.01)
0.13 (0/0.27)
0.13 (0.06/0.20)
−0.52 (−0.83/−0.26)
0.44 (−0.05/0.86)
−1.43 (−1.75/−1.13)
1.30 (0.98/1.58)
0.68 (−0.52/2.14)
2.84 (2.13/3.58)
−0.25 (−0.77/0.30)
−0.64 (−0.84/−0.44)
−0.03 (−0.10/0.04)
shows annual time-series for the annual coldest night (Fig. 3a) and
coldest day (Fig. 3b), tropical nights (Fig. 3c) and summer days
(Fig. 3d). All these indices clearly point to higher temperatures in these
annual coldest events and an increasing in the number of days recording
values exceeding the 20 °C (25 °C) during night-time (daytime).
On sub-regional scales the largest trends have been estimated over
NE Brazil for cold nights (about 27% days decrease in frequency) and
warm nights (about 24% days increase in frequency), followed by
Amazonia for both indices by averaging 17 and 23 stations respectively.
Also increases (decreases) in warm (cold) days are remarkable over
NE Brazil: 18% (13%) more (less) frequent and Amazonia with 7% (5%)
more (less) frequent. Moderate reductions (increments) in cold (warm)
nights and days are evident over W and SE SA, where a network of 26
and 79 stations respectively have been used. Tropical nights and summer
days increase over the four sub-regions with lower rates of change for the
latter index. Tropical nights (summer days) change faster over NE Brazil
and W and SE SA (NE Brazil, Amazonia and W SA). Cold spells show
significant reductions over the four sub-regions with the highest rates
being estimated over NE Brazil (about 22 days shorter at present than
in the 1950s), while warm spells increase significantly over NE Brazil
(about 11 days longer), Amazonia and W SA, with the latter being significant at the 5% level. Finally, DTR increased strongly (slightly) over
Amazonia (W SA), while weak and non-significant downward trends
are estimated over the two remaining regions (Table 2).
Clear and significant wetting and intensified rainfall signals emerge
from the analysis of precipitation extreme indices averaged over all SA
over 1950 to 2010 (Table 3). Annual total precipitation is strongly increasing when averaged over the whole continent (about 92 mm
more rain at present than in the 1950s), which is being accompanied
by high rates of upward trends in heavy events. This is particularly evident for increases in events exceeding the 95th percentile (about
92 mm more intense nowadays than in the 1950s), followed by the
highest 5-day consecutive rainfall amounts (11 mm more), extremely
wet days (about 36 mm more) and the highest 1-day precipitation
(5 mm more intense). Weak increases in the number of consecutive
rainy days (0.24 days longer) and in the simple daily intensity (about
0.50 mm more intense wet days) indices cannot explain the strong upward trend in the total amount of annual rainfall, which is more likely
related to the intensification seen in the heaviest events, although we
have not explored this further. Also, consecutive dry days are increasing
though not significantly, suggesting that a wetter continent might be
more likely associated with rainfall intensification rather than with an
increment in the frequency of wet days >1 mm. Finally, the number
of heavy rain (RR > 20 mm= R20) events also moderately increase
over all SA (Table 3).
Fig. 4 shows the time-varying annual anomalies for total annual rainfall (Fig. 4a), annual wettest consecutive 5-day precipitation (Fig. 4c),
very wet days (Fig. 4b) and extremely wet days (Fig. 4d). All of them
show long-term, steady increases between 1950 and 2010. Annual precipitation totals have seen a strong increase up to the mid-1970s
followed by stagnation in higher amounts until 2010. Fig. 5 shows the
annual anomaly series for R20 (Fig. 5a) and the annual wettest 1-day
(Fig. 5b), both recording increases over all SA.
Sub-regional signals show SE SA (103 stations) as the region with the
highest rates of change for annual rainfall (about 158 mm wetter than it
was in the 1950s), followed by Amazonia (77 stations and about
97 mm higher), while W SA (NE Brazil) sees moderate (weak) but
non-significant reductions estimated from a network of 32 and 30 stations respectively. Very wet days and extremely wet days show upward
trends that are related to significant increases over Amazonia (SE SA)
with about 192 (87) mm higher amounts than in the 1950s. These events
are also increasing over W and NE Brazil but they are not statistical significant. The annual wettest day only increases significantly at the 5%
level over SE SA (6.24 mm wetter) and Amazonia (4 mm wetter), but
over W SA (NE Brazil) the estimated upward (downward) trends are
non-significant. For the annual wettest consecutive 5-day events
Table 3
The same as Table 2, but for precipitation indices.
Index
All SA
AMA (region 7)
NEB (region 8)
WSA (region 9)
SESA (region 10)
Rx1day
Rx5day
R20
CDD
CWD
R95p
R99p
SDII
PRCPTOT
0.86 (0.33/1.37)
1.86 (0.91/2.72)
0.23 (0.10/0.36)
0.25 (−0.27/1.00)
0.04 (−0.02/0.11)
15.29 (11.42/19.50)
5.95 (3.86/7.52)
0.09 (0.03/0.15)
15.40 (5.83/22.71)
0.67 (0.09/1.1.9
1.10 (0/2.13)
0.09 (−0.20/0.35)
−0.23 (−1.04/0.62)
0.08 (−0.02/0.16)
32.02 (24.02/39.77)
10.65 (7.50/13.75)
−0.06 (−0.11/0)
16.09 (0.33/31.85)
−0.52 (−2.14/1.10)
0.29 (−3.58/3.73)
0.16 (−0.68/0.79)
−5.58 (−8.98/−2.68)
−0.07 (−0.17/0.14)
9.86 (−7.00/25.27)
5.76 (−1.49/12.63)
0.01 (−0.16/0.18)
−1.42 (−41.71/40.63)
0.63 (−0.31/1.64)
−0.78 (−3.00/1.55)
−0.10 (−0.34/0.11)
1.12 (−1.01/3.10)
0.02 (−0.17/0.22)
4.55 (−4.77/12.15)
1.45 (−2.27/5.52)
0 (−0.15/0.15)
−13.97 (−33.34/3.80)
1.04 (0.09/1.97)
2.40 (0.73/3.99)
0.52 (0.28/0.79)
0.41 (−0.34/1.34)
0.05 (0/0.10)
14.49 (7.07/21.15)
5.66 (3.11/8.33)
0.19 (0.08/0.30)
26.41 (11.71/42.89)
Author's personal copy
2010
2000
1990
1980
1970
1950
2010
2000
1990
1980
1960
25
b
20
15
15
10
10
5
5
TN10p
TN90p
0
0
25
c
20
15
15
10
10
5
TX10p
2010
1990
1980
1970
1960
1950
2010
2000
1990
1980
TX90p
1970
1950
0
2000
5
1960
% days
20
25
d
% days
% days
1970
a
20
301
% days
25
1960
1950
M.M. Skansi et al. / Global and Planetary Change 100 (2013) 295–307
0
Fig. 2. Annual time-series (1950–2010) of area-averaged temperature indices over all South America for cold nights (Fig. 2a), warm nights (Fig. 2b), cold days (Fig. 2c) and warm
days (Fig. 2d). The indices are smoothed with a 13-year Gaussian filter. See Section 2.3.2 for details on trend estimation and adjustment of variance bias associated with varying
sample size in the area-averaged indices.
a
2010
2000
1990
1980
1970
1960
A summary of the sign of the trend and its significance for all the
locally estimated indices are given in Table 4. Indices that represent
warming such as cold night reductions, warm night and tropical night
1950
2010
2000
1990
1980
1970
3.2. Local trends for temperature and precipitation extreme indices
3
b
2
1
1
0
0
-1
-1
-2
-2
TXn
TNn
-3
-3
30
C Deg
20
c
30
d
20
10
10
0
0
-10
-10
-20
-20
2000
1990
1980
1970
1960
1950
2010
2000
1990
1980
1970
1960
1950
2010
SU25
TR20
-30
C Deg
C Deg
2
found. A similar signal is found for heavy events (RR>20 mm), with a
moderate upward trend over SE SA (3 days more than in the 1950s),
while in the other sub-regions except W SA, heavy rainfall events are increasing but not significantly (Table 3).
C Deg
3
1960
1950
significant increases are found over SE SA and Amazonia (the latter significant at the 5% level), while over W SA (NE Brazil) they are decreasing
(increasing) but non-significant. Consecutive wet days (CWD) show
weak and non-significant upward trends over the four sub-regions except
NE of Brazil. CDD, a proxy for dryness, shows significant reductions
over the NE of Brazil (33 days longer than in the 1950s) and Amazonia
(although non-significant) and over W and SE SA consecutive dry days
are increasing but not significantly. The SDII index increase only over SE
SA (about 3 mm more intense), while weak but non-significant increases
are seen in the remaining sub-regions except W SA where no change is
-30
Fig. 3. Annual anomaly (with respect to the 1971–2000 reference period) between 1950 and 2010 of area-averaged temperature indices for South America and for the annual
lowest night-time (Fig. 3a) and daytime (Fig. 3b) temperatures, tropical nights (Fig. 3c) and summer days (Fig. 3d).
Author's personal copy
200
a
2010
2000
1990
1980
1970
1960
1950
2010
2000
1990
1980
1970
mm
1960
M.M. Skansi et al. / Global and Planetary Change 100 (2013) 295–307
1950
302
mm
400
b
100
300
0
200
-100
R95p
PRCPTOT
-200
100
20
c
150
d
10
100
0
50
-10
2000
1990
1980
1970
1960
1950
2010
2000
1990
1980
1970
1960
1950
mm
2010
R99p
Rx5day
-20
0
mm
Fig. 4. The same as Fig. 3 but for total annual rainfall (Fig. 4a) and annual maximum consecutive 5-day precipitation (Fig. 4c), and the same as Fig. 2 but for very wet days (Fig. 4b)
and extremely wet days (Fig. 4d) indices.
increases have more significant than non-significant local trends. No
rain-based index shows more significant than non-significant trends.
Fig. 6 shows local trends for cold nights and days and for warm nights
and days. Both generalized reductions (increases) in the frequency of
cold (warm) nights and days over most of the South American locations
are evident with a high spatial coherency of the signals, particularly for
cold nights. Downward trends are strong over the northern and western
parts of SA, while SE SA also sees moderate and weak reductions, some
of them not significant. A few differences to this are the local nonsignificant trends seen over eastern Uruguay, south Argentina, Chile,
Paraguay, Peru and northwest Brazil (Fig. 6 upper left plot). Further research is required to assess whether this is due to the complex topography at these stations or whether homogenization issues could explain
them. Similar spatial patterns and signals, although weaker, have been
established for cold days (Fig. 6 upper right panel) with strong negative
trends in the northern part of SA, while the southern part sees mostly
non-significant reductions. Similar patterns (strong increases in the
north and weak in the southern parts of SA) are found for warm nights
(Fig. 6 bottom left panel). Warm days show a general increase over the
northern part of SA, while the southern part has mostly non-significant
(both increasing and decreasing) trends (Fig. 6 bottom right plot).
Fig. 7 shows local trends for tropical nights, summer days and the
annual lowest night-time and daytime temperatures. Tropical nights
mostly record increases, with a few spatially incoherent trends in
southern Paraguay and central Argentina (Fig. 7 upper left panel).
Generalized and significant increases are estimated for summer days,
except for a subset of stations (Fig. 7 bottom left panel). A stronger
warming signal is seen over SE Brazil and over southern SA with a similar spatial pattern to that estimated for tropical nights. TNn (upper
right panel) and TXn indices (bottom right panel) show consistent
and generalized changes toward higher values of both the annual
lowest nighttime and daytime temperatures over all SA, particularly
in the northern half of the continent with most being moderate and
significant upward trends. This indicates a consistent warming signal
in warmest nights and days.
Trends (both upward and downward) in precipitation indices at
station locations are mostly non-significant. This much more contrasting pattern compared to the temperature indices is expected given
that precipitation has higher temporal and spatial variability. This characteristic, however, does not contradict the clear wetting signal that
emerged from our assessment at the regional and sub-regional scales,
since averaging across locations increases the signal to noise ratio.
Fig. 8 shows rates of change for PRCPTOT (which can be used as baseline to place observed changes in other precipitation extreme indices
in context), heavy events (such as the R95p, Rx1day, R99p or Rx5day)
and CDD indices.
3
15
b
10
1
5
0
0
-1
-5
-2
Rx1day
2000
1990
1980
1970
1960
1950
2010
2000
1990
1980
1970
1960
1950
R20
-3
mm
a
2010
Days
2
-10
-15
Fig. 5. The same as Fig. 3 but for the number of heavy rainy days >20 mm (Fig. 5a) and the annual wettest day (Fig. 5b).
Author's personal copy
M.M. Skansi et al. / Global and Planetary Change 100 (2013) 295–307
Table 4
Number of stations for which each index has returned significant negative and positive
trends (at the 5% level), along with non-significant trends for the annual temperature
and precipitation station-based indices over 1969–2009.
Index ID
Negative
Positive
Non-significant
TXx
TNx
TXn
TNn
TN10p
TX10p
TN90p
TX90p
DTR
SU25
TR20
WSDI
CSDI
Rx1day
Rx5day
SDII
R20
CDD
CWD
R95p
R99p
PRCPTOT
3
1
0
3
91
50
0
2
31
2
2
–
1
3
4
7
5
3
6
3
1
5
41
54
28
41
1
2
83
53
6
37
52
19
5
6
10
16
16
16
6
12
13
11
89
81
105
93
39
75
48
73
84
89
46
44
10
161
155
151
149
154
160
156
138
158
For PRCPTOT (Fig. 8 upper left panel), both strong to moderate (moderate to weak) upward (downward) trends, mostly non-significant, are
evident. In general there are widespread mostly non-significant increases
over SA in very wet days and extremely wet days (Fig. 8 upper middle
panel and upper right panel respectively). Very wet days have a less spatially consistent wetting signal than extremely wet days, since the latter
records general upward trends over all SA with a few significant and
moderate trends. Changes in both extreme indices are clear and spatially
coherent indicators of the intensification of the heaviest events over the
continent.
The annual wettest consecutive 5-day and 1-day precipitation have
less spatially consistent patterns (Fig. 8 bottom left panel and bottom
middle panel respectively). The dominant signal is a tendency toward
higher amounts in both indices despite many moderate to low (low to
moderate) and non-significant downward trends in Rx5-day (Rx1-day).
Finally, local trends for consecutive dry days (Fig. 8 bottom right panel)
show mostly upward trends, some significant with strong rates of change,
although downward non-significant trends are also present.
3.3. Discussion
Previous studies of South American temperature and precipitation
extremes have used a variety of networks and time periods for their
assessments. This study can be used to highlight some of the similarities and differences with those other assessments where either similar timescales or similar networks were used.
Reasonable agreement with our findings for temperature indices
and those reported by Vincent et al. (2005) is found. This is particularly true for cold and warm nights and to a lesser extent for cold
days mainly over southern and western SA (see Fig. 3c, 3d p. 5018
and Fig. 2c p. 5017 in Vincent et al., 2005). However, this cannot
be stated for changes in warm days (Vincent et al., 2005: Fig. 2d,
p. 5017). Our findings point to strong warming over northern SA
and weak upward trends over southern SA in contrast to the previous
study which showed mixed signals (both warming and cooling) over
all SA, especially over Argentina where we have mainly estimated weak
upward trends. For the regionally averaged indices, there is good agreement for cold and warm nights (Vincent et al., 2005, Fig. 5c and 5d,
p. 5020 respectively), while cold and warm days (Fig. 5a and b p. 5020)
show less vigorous warming than in this study. Good agreement is also
found between both assessments for upward trends in tropical
303
nights and summer days (Vincent et al., 2005: Fig. 3b p. 5018 and
Fig. 2a p. 5017), although some disagreement in a few Argentinean,
Paraguayan and Uruguayan locations can be seen for summer days.
Comparing findings for smaller scales (e.g. for Uruguay from
Rusticucci and Renom, 2008: p. 1086, 1088), similar weak downward
(upward) trends for cold nights and days (warm nights) to our findings
are seen, although neither study finds statistical significance. Also our
findings point to weak and non-significant increases in warm days,
while their assessment indicated decreases. However, the highlighted
differences in trends between our study and the previous studies
discussed can be explained not only by the different networks used,
but also because of the differences in length of periods assessed.
Also, there is good agreement between our results for local trends
in precipitation indices when compared with those from Haylock
et al. (2006) for all SA, bearing in mind the differences highlighted
above on the variety of locations and periods assessed. Most of the
local trends for PRCPTOT, Rx1day, Rx5day, R95p and CDD indices in
Haylock et al. (2006: Fig. 2, p. 1497) show strong similarities to our
findings. However, for the R99p index, our results indicate general increases across SA while the previous study showed mixed trends.
They show similar contrasting spatial patterns with mixed upward
and downward trends, although differences between statistical significance of trends between both assessments must be highlighted,
since the previous study estimated more significant local trends
than those calculated by us.
Other agreement also occurs in the annual evolution of areaaveraged precipitation indices between both assessments. Haylock
et al., 2006 (Fig. 3 p. 1498 and Fig. 4 p. 1499) show time-series
of R20 and R99 indices for the four quadrants of the continent (NW,
NE, SE and SW) and found significant trends over the SE quadrant
for both indices, while in our assessment both indices show upward
and significant trends over SE SA, although they are stronger over
Amazonia (a region with a non-significant trend in the previous study
due to the highly sparse data).
4. Summary and outlook
In this study we have analyzed changes in temperature and precipitation extremes by using an extended network of daily quality
controlled, homogeneity tested or homogenized records over South
America covering the 2nd half of the 20th century up to 2010. The
time-series assessed, however, present a number of problems.
Lack of multi-decadal time-series at the daily scale over most of the SA
countries is one issue which is still hampering our knowledge on how
and by how much extremes are changing under climate change. Another
serious problem in the continent is climate series completeness, since
large amounts of missing periods and values are a common characteristic
of South American daily data. This has had a negative impact on the computation of the ETCCDI extreme indices used in our study, especially for
temperature-based indices in general and percentile-based indices in
particular.
Despite WMO Resolution 40 on the free exchange of meteorological
and related historical data, accessibility of long-term and high-quality
climate records with an appropriate time resolution is a major issue,
since data sharing is restricted due to national policies that preclude
data exchange. Access to these data is an essential requirement before
we can confidently detect or predict climate variability and change
(e.g. Brunet and Jones, 2011: pp. 30–34; Thorne et al., 2011: pp. 4–6).
Therefore, there is still a need to promote data rescue and data development activities at both the international and national level in order to
improve observed and projected changes in extremes over SA.
Even given the above mentioned problems, this assessment has
improved our knowledge of the spatial and temporal changes in temperature and precipitation extremes over all SA and its regions than
was possible in previous studies. Nevertheless, we are aware that
our study and findings are limited both in time and space, since we
Author's personal copy
304
M.M. Skansi et al. / Global and Planetary Change 100 (2013) 295–307
TN10P
TX10P
10
0
0
-10
-10
Latitude
Latitude
10
-20
-30
-20
-30
-40
-40
%days/10 yrs
< -6 to -6
-20
-6 to -2
-2 to 0
0 to 2
2 to 6
6 to
>=
6 20
-50
-80
-70
-60
-50
-40
%days/10 yrs
< -6 to -6
-20
-6 to -2
-2 to 0
0 to 2
2 to 6
6 to
>=
6 20
-50
-30
-90
-80
-70
Longitude
TN90P
10
-50
-40
TX90P
10
0
0
-10
-10
Latitude
Latitude
-60
Longitude
-20
-30
-20
-30
-40
-40
%days/10 yrs
< -6 to -6
-20
-6 to -2
-2 to 0
0 to 2
2 to 6
6 to
>=
6 20
-50
-80
-70
-60
-50
-40
%days/10 yrs
< -6 to -6
-20
-6 to -2
-2 to 0
0 to 2
2 to 6
6 to
>=
6 20
-50
-30
Longitude
-80
-70
-60
-50
-40
-30
Longitude
Fig. 6. Local robust trends estimated annually for the 1969–2009 period for cold nights (upper left plot), cold days (upper right panel), warm nights (bottom left panel) and warm days
(bottom right panel), all showing warming. See Section 2.3.2 for details on trend estimation.
do not explore changes at the intra-annual scale (e.g. monthly and
seasonal), or using the whole distribution of data, or provide results
at fine spatial scales (e.g. national and sub-national).
In line with global assessments (Alexander et al., 2006; Donat
et al., submitted for publication) which found that the world is
becoming substantially less cold, SA has experienced widespread decreases in cold extremes (e.g. cold nights and days, the annual lowest
TN and TX values, cold spells) along with increases, although less
marked, in warm extremes (e.g. warm days, the annual highest TX
and TN values or warm spells).
Author's personal copy
M.M. Skansi et al. / Global and Planetary Change 100 (2013) 295–307
TR20
10
0
0
-10
-10
Latitude
Latitude
10
-20
TNn
-20
-30
-30
-40
< -6to -6
-10
-6 to -2
-2 to 0
0 to 2
2 to 6
>=
6 10
6 to
-80
-70
-60
-50
-40
°C/10 yrs
-40
days/10 yrs
-50
<-1.5
-3
to -1.5
-1.5 to -0.5
-0.5 to 0
0 to 0.5
0.5 to 1.5
>1.5
1.5to 3
-50
-30
-80
-70
-60
-50
-40
-30
Longitude
Longitude
SU25
10
TXn
10
0
0
-10
-10
Latitude
Latitude
305
-20
-20
-30
-30
°C/10 yrs
-40
-40
days/10 yrs
< -6to -6
-10
-6 to -2
-2 to 0
0 to 2
2 to 6
>=
6 10
6 to
-50
-80
-70
-60
-50
-40
<-1.5
-3
to -1.5
-1.5 to -0.5
-0.5 to 0
0 to 0.5
0.5 to 1.5
1.51.5
to 3
>=
-50
-30
Longitude
-80
-70
-60
-50
-40
-30
Longitude
Fig. 7. The same as Fig. 6 but for tropical nights (upper left panel), summer days (bottom left panel), and the annual lowest night time (upper right plot) and daytime (bottom right
plot) temperatures.
SA is also becoming wetter as a whole, with Amazonia and
SE SA leading the increases in the total amount of annual precipitation. This upward trend seems to be more related to intensification of heavy rainfall (particularly over Amazonia and SE SA)
than to increases in the duration or frequency of consecutive wet
days. Significant increases in consecutive dry days also point to this
feature.
Many of the principal findings on global changes in climate extremes have resulted from ETCCDI regional workshops. It is hoped
that in the near future that up-to-date data availability and accessibility will evolve towards accessible and user-friendly platforms such as
those produced for the European Climate Assessment and Dataset
(ECA&D) project for Europe (http://eca.knmi.nl/). There are potential
opportunities to build up a South American portal using the same
Author's personal copy
306
M.M. Skansi et al. / Global and Planetary Change 100 (2013) 295–307
PRCPTOT
R95P
10
0
-10
-10
-10
Latitude
0
-20
-20
mm/10 yrs
-80
-70
-60
-50
-40
-75 to -25
-25 to 0
0 to 25
25 to 75
75 75
to 300
>=
-50
-30
-80
-70
Longitude
-40
-50
-80
-30
-70
RX1DAY
0
-10
-10
-10
Latitude
0
-20
-40
-30
CDD
-20
-30
-30
-30
-50
10
0
-20
-60
Longitude
10
Latitude
Latitude
-50
-75 to -25
-25 to 0
0 to 25
25 to 75
75 75
to 300
>=
Longitude
RX5DAY
10
-60
<-300
-75 to -75
-40
<-300
-75 to -75
-40
-75 to -25
-25 to 0
0 to 25
25 to 75
75 75
to 300
>=
-50
mm/10 yrs
mm/10 yrs
<-300
-75 to -75
-40
-20
-30
-30
-30
R99P
10
0
Latitude
Latitude
10
days/10 yrs
mm/10 yrs
mm/10 yrs
< -6to -6
-20
-6 to -2
-2 to 0
0 to 2
2 to 6
6>=to6 20
-40
-50
-80
-70
-60
-50
-40
-40
-50
-30
<
-6to -6
-16
< -6to -6
-20
-6 to -2
-2 to 0
0 to 2
2 to 6
6>=to6 20
-80
-70
Longitude
-60
-50
Longitude
-40
-6 to -4
-2 to 0
0 to 2
2 to 6
6 to6 20
>=
-40
-50
-30
-80
-70
-60
-50
-40
-30
Longitude
Fig. 8. The same as Fig. 6 but for annual total rainfall (upper left panel), very wet days (upper central panel), extremely wet days (upper right panel), annual maximum consecutive
5-day precipitation (bottom left panel), annual maximum 1-day precipitation (bottom central panel) and consecutive dry days (bottom right panel).
technology, software and experience as in ECA&D. This endeavor will
need both adequate support and increased interaction with all South
American NMHSs to ensure adequate data provision to enable a robust climate service to a wide community of users.
Finally, the climate series used in this study are accessible from
the websites of the Brazilian, Chilean and Venezuelan NMHSs, while
those belonging to the NMHSs in Bolivia, Colombia, Ecuador and Peru
will be made accessible through the WSACAD (Western South America
Climate Assessment & Dataset) portal once implemented on-line.
Finally, the series from Argentina, Paraguay, Suriname and Uruguay
NMHSs are accessible under request from the relevant NMHS.
Supplementary data to this article can be found online at http://
dx.doi.org/10.1016/j.gloplacha.2012.11.004.
Acknowledgments
We thank to the WMO Education and Training program for
funding the Guayaquil Workshop under the coordination of the
WMO WIS-Data Management Applications Division. The authors are
also grateful to CIIFEN and Centre for Climate Change (C3) for their
scientific guidance and leadership during and post workshop activities. LVA is supported by Australian Research Council grants
CE110001028 and LP100200690. MB is supported by the European
Community's Seventh Framework Programme (FP7/2007–2013)
under Grant Agreement 242093 (EURO4M: European Reanalysis
and Observations for Monitoring). PDJ acknowledges the support of
the European Community's Seventh Framework Programme (FP7/
2007–2013) under Grant Agreement 212492 (CLARIS LPB: A Europe–
South America Network for Climate Change Assessment and Impact
Studies in La Plata Basin).
References
Aguilar, E., 2010. Manual de uso de RSNHT.R (software de homogenización del Center for
Climate Change, URV, Tarragona, España), Centre for Climate Change self-editing,
Tarragona. (12 pp. Available at: http://www.c3.urv.cat/data/manual/manual_rsnht.
pdf and accessed on the 20th July 2012).
Aguilar, E., Sigró, J., Brunet, M., 2010. RCLIMDEX con funcionalidades extras de Control de
Calidad. Manual de Uso, versión 1.0, Centre for Climate Change self-editing, Tarragona.
(20 pp. Available at: http://www.c3.urv.cat/data/manual/Manual_rclimdex_extraQC.r.
pdf and accessed on the 20th July 2012).
Alexander, L.V., Zhang, X., Peterson, T.C., Caesar, J., Gleason, B., Klein Tank, A.M.G.,
Haylock, M., Collins, D., Trewin, B., Rahimzdeh, F., Tagipour, A., Kumar Kolli, R.,
Revadekar, J.V., Griffiths, G., Vincent, L., Stephenson, D.B., Burn, J., Aguilar, E.,
Brunet, M., Taylor, M., New, M., Zhai, P., Rusticucci, M., Vazquez Aguirre, J.L.,
2006. Global observed changes in daily climate extremes of temperature and precipitation. Journal of Geophysical Research-Atmospheres 111, D05109 http://
dx.doi.org/10.1029/2005JD006290.
Author's personal copy
M.M. Skansi et al. / Global and Planetary Change 100 (2013) 295–307
Alexandersson, H., Moberg, A., 1997. Homogenization of Swedish temperature data. 1.
Homogeneity test for linear trends. International Journal of Climatology 17, 25–34.
Barrucand, M., Rusticucci, M., Vargas, W., 2008. Temperature extremes in the south
of South America in relation to Atlantic Ocean surface temperature and Southern
Hemisphere circulation. Journal of Geophysical Research 113, D20111 http://
dx.doi.org/10.1029/2007JD009026.
Brown, S.J., Caesar, J., Ferro, C.A.T., 2008. Global changes in extreme daily temperature
since 1950. Journal of Geophysical Research-Atmospheres 113, D05115.
Brunet, M., Jones, P.D., 2011. Emerging data rescue initiatives: bringing historical
climate data into the 21st century. Climate Research 47, 29–40 http://dx.doi.org/
10.3354/cr00960.
Dai, A., 2011. Drought under global warming: a review. Wiley Interdisciplinary
Reviews: Climate Change 2 (1), 45–65.
Donat, M.G., Alexander, L.V., Yang, H., Durre, I., Vose, R., Dunn, R. Willett, K., Aguilar, E.
Brunet, M., Caesar, J., Hewitson, B., Jack, C., Klein Tank, A.M.G., Kruger, A.C., Marengo, J., Peterson, T.C., Renom, M., Oria Rojas, C., Rusticucci, M., Salinger, J., Sekele, S.S.,
Srivastava, A.K., Trewin, B., Villarroel, C., Vincent, L.A., Zhai, P., Zhang, X., Kitching, S.,
submitted for publication. Updated analyses of temperature and precipitation
extreme indices since the beginning of the twentieth century: The HadEX2 dataset.
Journal of Geophysical Research — Atmospheres.
Dufek, A.S., Ambrizzi, T., 2008. Precipitation variability in Sao Paulo State, Brazil.
Theoretical and Applied Climatology 93 (3–4), 167–178.
Dufek, A.S., Ambrizzi, T., da Rocha, R.P., 2008. Are reanalysis data useful for calculating
climate indices over South America? Trends and Directions in Climate Research:
In: Gimeno, L., Garcia-Herrera, R., Trigo, R.M. (Eds.), Annals of the New York
Academy of Sciences, New York, NY, USA, vol. 1146, pp. 87–104.
Falvey, M., Garreaud, R.D., 2009. Regional cooling in a warming world: recent temperature trends in the southeast Pacific and along the west coast of subtropical South
America (1979–2006). Journal of Geophysical Research 114, D04102 http://
dx.doi.org/10.1029/2008JD010519.
Grimm, A.M., Tedeschi, R.G., 2009. ENSO and extreme rainfall events in South America.
Journal of Climate 22, 1589–1609 http://dx.doi.org/10.1175/2008JCLI2429.1, 2009.
Haylock, M.R., Peterson, T.C., Alves, L.M., Ambrizzi, T., Anunciação, Y.M.T., Baez, J.,
Barros, V.R., Berlato, M.A., Bidegain, M., Coronel, G., Corradi, V., Garcia, V.J.,
Grimm, A.M., Karoly, D., Marengo, J.A., Marino, M.B., Moncunill, D.F., Nechet, D.,
Quintana, J., Rebello, E., Rusticucci, M., Santos, J.L., Trebejo, I., Vincent, L.A., 2006.
Trends in total and extreme South American rainfall 1960–2000 and links with
sea surface temperature. Journal of Climate 19, 1490–1512.
IPCC, 2012. Managing the risks of extreme events and disasters to advance climate
change adaptation. In: Field, C.B., Barros, V., Stocker, T.F., Qin, D., Dokken, D.J.,
Ebi, K.L., Mastrandrea, M.D., Mach, K.J., Plattner, G.-K., Allen, S.K., Tignor, M.,
Midgley, P.M. (Eds.), A Special Report of Working Groups I and II of the Intergovernmental Panel on Climate Change. Cambridge University Press, Cambridge, UK,
and New York, NY, USA (582 pp.).
Kendall, M.G., 1955. Rank Correlation Methods. Oxford Univ. Press, New York.
Khan, S., Kuhn, G., Ganguly, A.R., Erickson III, D.J., Ostrouchov, G., 2007. Spatio-temporal
variability of daily and weekly precipitation extremes in South America. Water
Resources Research 43, W11424 http://dx.doi.org/10.1029/2006WR005384.
Klein Tank, A.M.G., Zwiers, F.W., Zhang, X., 2009. Guidelines on Analysis of Extremes
in a Changing Climate in Support of Informed Decisions for Adaptation, WMO-TD
No. 1500/WCDMP-No. 72, Geneva . (52 pp.).
Llano, M.P., Penalba, O.C., 2011. A climatic analysis of dry sequences in Argentina. International Journal of Climatology 31, 504–513 http://dx.doi.org/10.1002/joc.2092.
Marengo, J.A., Camargo, C.C., 2008. Surface air temperature trends in southern Brazil
for 1960–2002. International Journal of Climatology 28, 893–904 http://dx.doi.org/
10.1002/joc.1584.
Marengo, J.A., Rusticucci, M., Penalba, O., Renom, M., 2009. An intercomparison of observed
and simulated extreme rainfall and temperature events during the last half of the twentieth century: part 2: historical trends. Climatic Change 98 (3–4), 509–529.
Mo, K.C., Berbery, E.H., 2011. Drought and persistent wet spells over South America
based on observations and the U.S. CLIVAR Drought Experiments. Journal of
Climate 24, 1801–1820 http://dx.doi.org/10.1175/2010JCLI3874.1.
Osborn, T.J., Briffa, K.R., Jones, P.D., 1997. Adjusting variance for sample-size in tree-ring
chronologies and other regional mean time series. Dendrochronologia 15, 89–99.
Penalba, O.C., Robledo, F.A., 2010. Spatial and temporal variability of the frequency of
extreme daily rainfall regime in the La Plata Basin during the 20th century. Climate
Change 98 (3–4), 531–550.
Peterson, T.C., Manton, M.J., 2008. Monitoring changes in climate extremes: a tale of
international collaboration. Bulletin of the American Meteorological Society 2008,
1266–1271 http://dx.doi.org/10.1175/2008BAMS2501.1 (September).
Pscheidt, I., Grimm, A.M., 2009. Frequency of extreme rainfall events in southern Brazil
modulated by interannual and interdecadal variability. International Journal of
Climatology 29, 1988–2011 http://dx.doi.org/10.1002/joc.1799.
Renom, M., 2009. Temperaturas extremas en Uruguay. Análisis de la variabilidad temporal de baja frecuencia y su relación con la circulación de gran escala, Ph.D. thesis,
Universidad de Buenos Aires, Buenos Aires (Argentina), 166 pp. Available at: www.
digital.bl.fcen.uba.ar and accessed on the 20th July 2012.
Rosenbluth, B., Fuenzalida, H.A., Aceituno, P., 1997. Recent temperature variations in
southern South America. International Journal of Climatology 17 (1), 67–85.
307
Rusticucci, M., 2012. Observed and simulated variability of extreme temperature events over
South America. Atmospheric Research 106 (2012), 1–17 http://dx.doi.org/10.1016/
j.atmosres.2011.11.001.
Rusticucci, M., Barrucand, M., 2004. Observed trends and changes in temperature
extremes over Argentina. Journal of Climate 17 (20), 4099–4107.
Rusticucci, M., Renom, M., 2008. Variability and trends in indices of quality controlled
daily temperature extremes in Uruguay. International Journal of Climatology 28 (8),
1083–1095.
Santos, C.A., Brito, J.I.B., 2007. Análise dos índices de extremos para o semiárido do
Brasil e suas relações com TSM e IVDN. Revista Brasileira de Meteorologia 22 (3),
303–312.
Santos, C.A.C., Brito, J.I.B., Rao, T.V.R., Meneses, E.A., 2009. Tendências dos Índices de
precipitação no Estado do Ceará. Revista Brasileira de Meteorologia 24 (1), 39–47.
Sen, P.K., 1968. Estimates of the regression coefficient based on Kendall's tau. Journal of
the American Statistical Association 63, 1379–1389.
Seneviratne, S.I., Nicholls, N., Easterling, D., Goodess, C.M., Kanae, S., Kossin, J., Luo, Y.,
Marengo, J., McInnes, K., Rahimi, M., Reichstein, M., Sorteberg, A., Vera, C., Zhang, X.,
2012. Changes in climate extremes and their impacts on the natural physical environment. Managing the Risks of Extreme Events and Disasters to Advance Climate
Change Adaptation. In: Field, C.B., Barros, V., Stocker, T.F., Qin, D., Dokken, D.J.,
Ebi, K.L., Mastrandrea, M.D., Mach, K.J., Plattner, G.-K., Allen, S.K., Tignor, M.,
Midgley, P.M. (Eds.), A Special Report of Working Groups I and II of the Intergovernmental Panel on Climate Change (IPCC). Cambridge University Press,
Cambridge, UK, and New York, NY, USA, pp. 109–230.
Sheffield, J., Wood, E.F., 2008. Global trends and variability in soil moisture and drought
characteristics, 1950–2000, from observation-driven simulations of the terrestrial
hydrologic cycle. Journal of Climate 21 (3), 432–458.
Silva, A.G., Azevedo, P., 2008. Índices de tendências de Mudanças Climáticas no Estado
da Bahia. Engenheiria Ambiental 5, 141–151.
Teixeira, M.S., Satyamurty, P., 2011. Trends in the frequency of intense precipitation
events in southern and southeastern Brazil during 1960–2004. Journal of Climate
24 http://dx.doi.org/10.1175/2011JCLI3511.1.
Tencer, B., 2010. Variabilidad de los eventos extremos de temperatura observados y
modelados en el sudeste de Sudamérica, y sus proyecciones ante un escenario de
cambio climático, Ph.D. thesis, Universidad de Buenos Aires, Buenos Aires (Argentina),
100 pp. Available at: www.digital.bl.fcen.uba.ar and accessed on the 20th July 2012.
Thorne, P.W., Willett, K.M., Allan, R.J., Bojinski, S., Christy, J.R., Fox, N., Gilbert, S., Jolliffe, I.,
Kennedy, J.J., Kent, E., Klein Tank, A., Lawrimore, J., Parker, D.E., Rayner, N.,
Simmons, A., Song, L., Stott, P.A., Trewin, B., 2011. Guiding the creation of a comprehensive surface temperature resource for 21st century climate science. BAMS http://
dx.doi.org/10.1175/2011BAMS3124.1.
Trenberth, K.E., Jones, P.D., Ambenje, P., Bojariu, R., Easterling, D., Klein Tank, A., Parker, D.,
Rahimzadeh, F., Renwick, J.A., Rusticucci, M., Solden, B., Zhai, P., 2007. Observations:
surface and atmospheric climate change. In: Solomon, S., Qin, D., Manning, M.,
Chen, Z., Marquis, M., Averyt, K.B., Tignor, M., Miller, H.L. (Eds.), Climate Change
2007: The Physical Science Basis. Contribution of Working Group I to the Fourth
Assessment Report of the Intergovernmental Panel on Climate Change. Cambridge
University Press, Cambridge, UK, and New York, NY, pp. 235–336.
Vincent, L.A., Zhang, X., Bonsal, B.R., Hong, W.D., 2002. Homogenization of daily
temperatures over Canada. Journal of Climate 15, 1322–1334.
Vincent, L.A., Peterson, T.C., Barros, V.R., Marino, M.B., Rusticucci, M., Carrasco, G.,
Ramirez, E., Alves, L.M., Ambrizzi, T., Berlato, M.A., Grimm, A.M., Marengo, J.A.,
Molion, L., Moncunill, D.F., Rebello, E., Anunciação, Y.M.T., Quintana, J., Santos, J.L.,
Baez, J., Coronel, G., Garcia, J., Trebejo, I., Bidegain, M., Haylock, M.R., Karoly, D.,
2005. Observed trends in indices of daily temperature extremes in South America
1960–2000. Journal of Climate 18, 5011–5023.
Vose, R.S., Easterling, D.R., Gleason, B., 2005. Maximum and minimum temperature
trends for the globe: an update through 2004. Geophysical Research Letters 32,
L23822.
Wang, X.L., Chen, H., Wu, Y., Feng, Y., Pu, Q., 2010. New techniques for the detection and
adjustment of shifts in daily precipitation data series. Journal of Applied Meteorology
and Climatology 49, 2416–2436 http://dx.doi.org/10.1175/2010JAMC2376.1.
Zhang, X., Vincent, L.A., Hogg, W.D., Niitsoo, A., 2000. Temperature and precipitation
trends in Canada during the 20th century. Atmosphere-Ocean 38, 395–429.
Zhang, X., Hegerl, G., Zwiers, F., Kenyon, J., 2005. Avoiding inhomogeneity in percentilebased indices of temperature extremes. Journal of Climate 18, 1641–1651.
Zhang, X., Alexander, L.V., Hegerl, G.C., Klein-Tank, A., Peterson, T.C., Trewin, B., Zwiers, F.W.,
2011. Indices for monitoring changes in extremes based on daily temperature and
precipitation data. Wiley Interdisciplinary Reviews: Climate Change 2, 851–870
http://dx.doi.org/10.1002/wcc.147.
Zwiers, F.W., Alexander, L.V., Hegerl, G.C., Knutson, T.R., Naveau, P., Nicholls, N., Schär, C.,
Seneviratne, S.I., Zhang, X., 2011. Community paper on climate extremes. Challenges
in Estimating and Understanding Recent Changes in the Frequency and Intensity
of Extreme Climate and Weather Events, World Climate Research Programme
Open Science Conference, 24–28 October 2011, Denver, CO, USA (45 pp. Available
at http://www.isse.ucar.edu/extremevalues/wcrpextr.pdf and accessed on the 20th
July 2012).


© Copyright 2026