
MMR - DAILY- 30th Jan 2015.indd
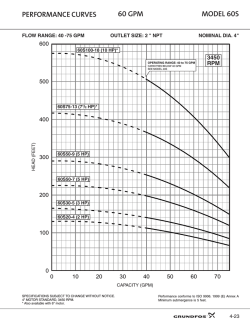
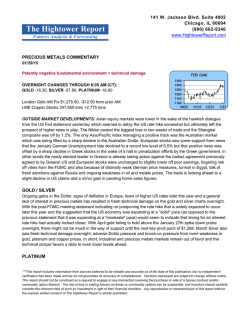
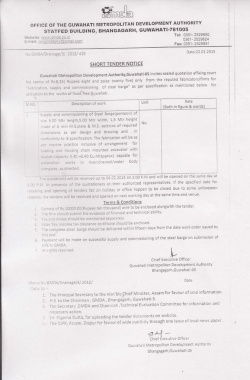
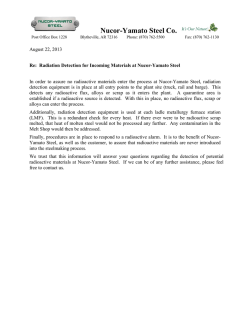
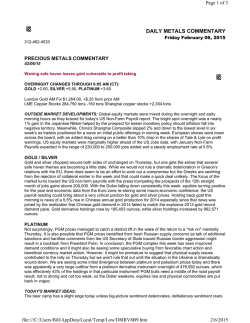
Fr i d ay 3 0 , J a nua r y 2015 News & Report Analysis Currency Market Precious Metal Base Metal Energy Market Steel firms fear price war due to huge import from Russia China absorbing rising supplies of cheap iron ore Goa to approach Centre seeking changes in MMDR Ordinance Sesa Sterlite Q3 consolidated PAT down 11% to Rs 1,588 crore POSCO reports 30% y-on-yr rise in Q4 operating profit 2 Friday 30, January 2015 Daily MMR Landed Prices London Metal Exchange : Thursday 29, January 2015 Pr. Sell (1) Morning Session Buy Sell * (2) Afternoon Session Buy Sell Kerb Change (2) - (1) Value Stk(tns) change $/ton Rs/ton Copper Grade A Spot 5485.50 5390.00 5390.50 5433.00 5434.00 5433.00 -95.0 2,47,450 MMR LP 3,62,544 3-mth 5455.50 5368.00 5369.00 5404.00 5405.00 5395.00 -86.5 2775 14-D MA 3,74,508 PP (HCL) 4,47,324 Average 10-days - 5596.80 20-days - 5831.40 30-days - 6009.70 Tin High Grade Spot 19450.00 19050.00 19075.00 19159.00 19160.00 19137.00 -375.0 11,860 -- -- 3-mth 19450.00 19100.00 19125.00 19200.00 19200.00 19175.00 -325.0 -5 -- -- -- -- Average 10-days - 19384.50 20-days - 19473.80 30-days - 19398.70 -- Lead Spot 1853.50 1826.50 1827.00 1834.00 1835.00 1846.00 -26.5 2,15,050 MMR LP 3-mth 1872.00 1842.00 1844.00 1848.00 1849.00 1860.00 -28.0 -25 14-D MA 1,27,723 PP (HZL) 1,38,400 Average 10-days - 1841.40 20-days - 1828.50 30-days - 1838.70 1,27,296 Zinc Special High Grade Spot 2112.00 2078.00 2078.50 2084.00 2085.00 2082.00 -33.5 6,33,175 MMR LP 1,48,937 3-mth 2121.50 2086.00 2088.00 2091.00 2092.00 2090.00 -33.5 -3550 14-D MA 1,49,585 PP (HZL) 1,59,000 Average 10-days - 2097.60 20-days - 2110.60 30-days - 2122.50 Aluminium Spot 1849.50 1822.00 1822.50 1810.00 1811.00 1808.00 -27.0 40,58,300 MMR LP 1,43,322 3-mth 1858.00 1831.00 1831.50 1822.00 1823.00 1819.00 -26.5 -10150 14-D MA 1,43,367 Average 10-days - 1832 20-days - 1802.40 30-days - 1820.70 PP (Nalco) 1,56,800 Aluminium Alloy Spot 1840.00 1830.00 1840.00 NA NA NA 0.0 26,500 3-mth 1850.00 1840.00 1850.00 NA NA NA 0.0 0 Average 10-days - 1842 20-days - 1825.50 30-days - 1856.30 Nickel Spot 14930.00 14700.00 14705.00 14794.00 14795.00 14846.00 -225.0 4,25,562 -- -- 3-mth 14970.00 14750.00 14760.00 14849.00 14850.00 14900.00 -210.0 1836 -- -- -- -01-Jan 09-Jan Average 10-days - 14588 20-days - 14770.30 30-days - 14966.80 Note: 1. MMR LP = MMR Landed Prices, excluding excise duty. 2. PP = Producer Prices ex-smelter, excl. excise Copper Aluminium Minor Metals ($/LB) Antimony 99.65% 9,100 Cadmium 99.80% 90.00 Cobalt HG Moly.oxide 99.80% 14.00 9.00 Tantalite 30% Ta2O5 81.00 Titanium Ferro-vana Con. Ti02 550.00 24.90 Silicon Zinc Lead 2,050 26-Jan 26-Jan Week ended Avg of Steel Prices: 24/01/2015 (Incl. Excise duty) Sponge Iron Pig Iron Ferro Alloys : Mandi 26,900 HMS 31,400 CRP(LSLP) Mumbai Mkt rates in kgs : Mumbai Kolkata 29,800 29,600 31,700 Ferro Moly 1000 Delhi Chennai Bhiwandi 30,000 28,100 MS Ingots 38,500 30,200 Ferro Silicon 83 Titanium 171 Indicative Domestic Market Rates (Rs./kg) Mumbai 29-Jan Prev Virgin Metals Copper Pat Copper W/Bar Delhi 29-Jan Comex Copper (cents/lb) Prev Chennai 29-Jan Prev Jan'15 - Feb'15 - Mar'15 - -430.0 -435.0 386.0 - 385.0 - Alum Ingot Zinc Slab Lead Ingot Tin Slab Nickel (4x4) Scrap Copper Heavy Copper Uten. 163.0 172.0 135.0 1,465.0 1,065.0 163.0 174.0 135.0 1,465.0 1,075.0 164.0 184.0 130.0 1,445.0 1,060.0 164.0 185.0 130.0 1,447.0 1,067.0 406.0 375.0 410.0 378.0 --- --- 159.0 - Copper Mixed Brass Utensil Brass Huny Brass Sheet Alum Utensil -310.0 310.0 320.0 132.0 -312.0 310.0 320.0 132.0 371.0 --137.0 370.0 --137.0 - 159.0 - Metal Gold Std Silver Gold Silver Gold Silver - Buy - Sell - Buy Rate 247.05 245.15 245.45 Change -2.0 -1.8 -1.0 Kanpur 38,100 Durgapur 34,500 Comex Al (cents/lb) Rate - Change - Precious Metals : Indicative Rates Market Mumbai Mumbai London London Comex Comex Unit Rs./10g Rs./kg $/tr.oz. $/tr.oz. $/tr.oz. $/tr.oz. 29-Jan 28,200 39,800 1,268.8 17.43 1,254.6 16.75 Prev 28,300 39,800 1,288.0 18.01 1,285.9 18.06 Forex: Jan 29, 2015 (Rs/Unit Currency) USD 61.92 61.83 EURO 70.11 GBP 93.67 93.57 SGD 45.80 ----AUD 48.19 YEN 0.5253 0.5245 SFR 67.55 70.04 45.72 48.15 67.43 Customs Notified Rates: Jan. 16, 2015 [Rs.(Imp/Exp)]: US$ 62.30/61.30;Pound Sterling 95.35/93.20;Euro 73.70/71.90 Daily U.S. stocks closed higher on Thursday as an upturn in oil prices and a rally in Apple and Boeing shares helped offset some disappointing earnings and lingering questions over U.S. monetary policy. As a result, Asian shares edged up on Friday even as continuing concerns about 3 Friday 30, January 2015 USD/INR - 29/01/15 61.40 61.48 61.56 61.64 61.72 61.80 61.88 The Federal Reserve painted a bullish view of USD/INR Overnight VAR Data releases today 17:00 16:00 15:00 14:00 13:00 12:00 11:00 10:00 major U.S. indexes surged almost 1 percent. 9:00 61.96 global growth tempered gains. On Thursday, 0.3489 Forecast Previous 5.0% the U.S. economy after its first policy meeting USD Advance GDP q/q 3.0% this week that analysts say puts it on course to USD Chicago PMI 57.7 raise interest rates as early as June. There were 58.3 Source : Mecklai Financial more signs of strength in the U.S. economy gains in the greenback. The currency touched on Thursday after data showed the number of an intra-day high of 95.26 and closed at 95.01 Americans filing new claims for unemployment on Thursday. While currencies from energy and benefits tumbled last week to its lowest level in resource producing countries, such as Canada nearly 15 years. Investors will next be eyeing U.S. and Australia, struggled under the weight of fourth-quarter gross domestic product data due falling energy prices, the dollar, yen and euro out at 1330 GMT that may show a solid pace of were locked in familiar ranges. economic expansion as the Fed had described in its policy statement on Wednesday. The euro climbed as far as 1.0464 francs, reaching its highest since the Swiss National Among the economic data includes US Bank abandoned its 1.20 per euro cap two Unemployment Claims fell to 265,000 in the last weeks ago. It last traded at 1.0450. The common week from 308,000 in the prior week. Pending currency held firm at $1.1323, pulling away from Home Sales plunged by 3.7 percent in December the trough of $1.1098. But it is still down more as against a gain of 0.6 percent in November. than six percent so far this month. Against the Currency Market yen, it drifted to 133.60, away from a 16-month low of 130.16 set Monday. Later in the day, Dollar-bloc currencies tended hefty losses euro zone inflation could come in softer than on Friday, as investors sent the Australian expected after German consumer prices fell in dollar to 5 1/2 year lows as they bet on the January for the first time since the height of the Australian central bank reducing interest rates global financial crisis in 2009. when it meets next week. The US Dollar Index The Aussie dollar barely made any recovery (DX) traded higher by 0.3 percent hovering on Friday, after dropping nearly 2 percent to close to more than 11-year highs against the $0.7720 on Thursday, a low unseen since July other major currencies on Thursday, after the 2009. The Aussie dollar last traded at $0.7775, Federal Reserve signaled that interest rates up 0.2 percent on the day but was still down 4.7 could start to rise around mid-year. However, percent this month and was on course to post mixed economic data from the nation restricted the third straight months of losses. Debt futures 4 Friday 30, January 2015 Daily 6 mth LIBOR Major Currencies Today’s Crosses Spot Cash v/s INR 0.36 USD / INR - ATM Options (put/call) 0.15 Forward Rates v/s INR (Export/ Import) February March April July October January 61.83/ 84 61.77/ 79 62.14/ 17 62.53/ 56 62.97/ 01 64.07/ 11 65.15/ 19 66.11/ 15 - - - 0.00/0.47 0.00/0.71 0.00/0.87 0.00/1.32 0.00/1.64 0.00/1.92 EUR / USD 1.1322 70/ 02 69.93/ 96 70.37/ 40 70.84/ 87 71.35/ 39 72.68/ 72 74.04/ 07 75.29/ 32 0.14 USD / JPY(100) 118.00 52.39/ 40 52.34/ 36 52.67/ 70 53.03/ 06 53.42/ 45 54.42/ 46 55.43/ 48 56.38/ 43 0.68 GBP / USD 1.5067 93.15/ 18 93.06/ 10 93.63/ 74 94.19/ 26 94.82/ 71 96.42/ 95 98.01/ 01 99.45/ 92 -0.74 USD / CHF 0.9211 67.08/ 13 67.01/ 08 67.45/ 48 68.09/ 10 68.65/ 68 70.13/ 13 71.70/ 60 73.09/ 98 3.06 AUD / USD 0.7781 48.11/ 12 48.06/ 08 48.35/ 37 48.66/ 68 49.00/ 03 49.86/ 89 50.70/ 73 51.44/ 47 Source : Mecklai Financial now imply a near 70 percent chance the Reserve slide that saw silver lose as much as 7 percent. Bank of Australia (RBA) will cut its 2.5 percent But gold is still on track to post its biggest cash rate at its policy meeting on Tuesday, Feb. monthly gain in almost a year after a recent rally 3, up from less than 10 percent earlier this week. fuelled by the European Central Bank's multi- "The AUD's fall over the past 24 hours has billion euro bond-buying program. been nothing short of stunning," said Raiko Despite the threat of U.S. monetary Shareef, currency strategist at Bank of New tightening, increased liquidity through the Zealand. ECB's stimulus should support gold going The Indian Rupee depreciated by 0.7 percent forward, said Victor Thianpiriya, analyst at owing to month-end dollar demand from Australia and New Zealand Banking Group. Spot importers, mainly oil refiners. Also, appreciation gold was up 0.3 percent at $1,260.08 an ounce of the US dollar against other currencies by 0229 GMT, after falling as low as $1,251.86 overseas acted as a negative factor. on Thursday, its weakest since Jan. 15. Gold's 2.2-percent drop overnight was its steepest Precious Metal since mid-December. The precious metal has Gold edged up on Friday after falling more lost 2.6 percent so far this week. But it was still than 2 percent to a two-week low overnight on up 6.5 percent for January, on track for its largest concerns over a looming increase in U.S. interest monthly gain since February last year after rates, with bullion still on track for its biggest touching a five-month high of $1,306.20 last weekly drop in two months. Other precious week. Spot silver was little changed at $16.90 an metals steadied after Thursday's broad-based ounce after sliding overnight by the most since September 2013. U.S. silver advanced 1 per Market Highlights - Gold (% change) Gold Gold (Spot) Gold (Spot -Mumbai) Comex Gold MCX Gold (Feb’15) Unit Last Prev. day as on January 29, 2015 WoW MoM YoY cent after falling over 7 per cent. India overtook China as the world's biggest gold consumer in 2014 as global physical demand fell, an industry $/oz 1256.5 -2.17 -3.4 6.2 0.0 Rs/10 gms 27900.0 -0.18 0.1 4.5 -6.4 $/oz 1259.0 0.35 -2.6 6.2 -0.3 Rs /10 gms 27419.0 -1.22 -2.2 2.7 -7.1 report showed, forecasting that prices that have declined for the last two years would bottom Source: Angel Broking out this year. Daily Base Metal Base metals traded lower yesterday after the Federal Reserve signaled it would stick to plans for a rate hike this year, drawing back liquidity that has underpinned metals. Also, expectation of a stronger U.S. dollar boosted by good economic data from the United States acted as 5 Friday 30, January 2015 tonne on Thursday. The price dropped about 14 percent last year. The initial 2015 plan was set at about 200,000-250,000 tonnes and the delivery would be in the first half of the year mostly, two of the sources said. Those shipments would be used to complete an ongoing program to build copper stocks to 2 million tonnes by end-2015, one of the sources said. a negative factor. In the Indian markets, all the base metals traded lower in line with weakness Energy Market in the international markets. The benchmark industrial metal, Copper prices declined by 0.6 percent yesterday and fell to a new five-and-a-half-year low on Thursday, brought down by a stronger dollar and investor concerns that China's slowing economy would hamper demand for the industrial metal. News that top metals consumer China plans to cut its economic growth target to the lowest in Market Highlights - Crude Oil (% change) as on January 29, 2015 Crude Oil Unit Last Prev. day WoW Brent (Spot) $/bbl 46.0 -1.0 1.1 -17.1 -58.4 Nymex Crude (Mar ’ 15) $/bbl 44.5 0.2 -3.8 -16.4 -54.3 ICE Brent Crude (Mar’15) $/bbl 49.1 1.4 1.3 -14.3 -54.3 MCX Crude (Feb ’15) Rs/bbl 2754.0 -0.6 -4.7 -18.3 -55.1 YoY Source: Angel Broking 11 years at around 7 percent in 2015 also hurt sentiment. MoM Oil prices dipped in early trading on Friday As per the Angel Broking analyst note following slight gains in the previous sessions, suggest that copper prices to trade sideways as and analysts said the outlook remained weak news that China's stockpiler plans to buy about with production remains higher and producers 200,000 tonnes of refined copper in 2015 from reducing operating costs to adjust to lower the international market will be supportive. export revenues. Global oil prices firmed slightly While on the other hand, investors will be on Thursday but not before U.S. crude hit a near cautious ahead of advance GDP data from six-year low and benchmark Brent pared gains the US China's stockpile plans to buy about on data showing fresh additions to record-high 200,000 tonnes of refined copper in 2015 from U.S. oil inventories. Benchmark Brent crude oil the international market and may more than futures opened Friday's trading with losses, double the amount if global prices are low, opening at $49.15 a barrel at 0100 GMT but three industry sources said. The State Reserves falling to $48.95 by 0200 GMT. U.S. Bureau (SRB) has set a rare "flexible" buying Inventories of U.S. crude were already plan in 2015 after having bought more copper at record highs for the week ended Jan. 23, than it had planned in 2014 due to low prices, according to government data issued on the sources said, but declined to be named due Wednesday. Last week's build alone was almost to the sensitive nature of the issue. Copper hit a 9 million barrels, taking stockpiles to nearly 407 5-1/2-year low this week, trading at $5,408.5 a million, the highest level since the government Daily began keeping such records in 1982. Friday 30, January 2015 the sliding global levels. They say it is becoming WTI futures were trading at $44.56 a barrel, increasingly difficult for them to keep product almost unchanged. Analysts said that the prices at current levels, amid sluggish demand market outlook remained weak as producers and rising import from China and Russia. were keeping output high and were adjusting “If the cheaper imports from China and to a lower price environment. Russia continue unabated, it will cause News Update & Analysis irreparable to damage to the Indian industry, Steel firms fear price war due to huge import from Russia unless the government comes out with policy initiatives to arrest this and to lower ore prices in the domestic market,” said a spokesperson from Essar Steel. A 50 per cent depreciation in the Russian Primary steel producers are mulling options currency has boosted its export to India. “There along with cutting capacity utilisation if iron is a possibility of Russian steel entering India in ore prices remain at the current high levels, say a big way in the coming weeks. (Then), there is industry officials. going to be a huge price war,” said a Mumbai- Companies also fear a price war, expecting based trader. huge import from Russia. Steel companies Traders have been refraining from booking have been asking central government-run orders from China for a couple of months, as by NMDC to lower its iron ore prices, in line with the time the material lands here, prices fall. 6 Daily China absorbing rising supplies of cheap iron ore Friday 30, January 2015 Goa to approach Centre seeking changes in MMDR Ordinance The Goa government plans to approach the Centre on the recently notified Mining and Minerals Development and Regulation (MMDR) Amendment Ordinance 2015. While the Ordinance has paved the way for mineral excavations after two years of no activity, state officials say it is silent on the 20 million tonne of mineral output limit set by the Supreme Court in April 2014. Besides, it also China is soaking up in the huge increase in mandates discharge of dumps at mine sites. overseas supply of increasingly cheaper iron ore, Production of 20 mt of iron ore annually will bolstering the determination of major exporter result in at least 80 mt of dumps, which will need Fortescue Metals Group Ltd to keep shipments a total ground area of 1600 hectares. Barring a at full speed. few cases where dumps are piled up upto 100 Since 2011, the biggest producers led by Vale SA and Rio Tinto Group have embarked on $120 metres in height, ground area is required for discharge of dumps. billion of spending on new mines, expanding “Since the MMDR Ordinance prevents low-cost supplies in a bet that increased discharge of dumps outside the mine site, volumes would force out competitors and offset miners would not be able to follow the usual lower prices. Prices have plunged to the lowest practice. If we take an estimated mine area in more than five years as the slowdown in of 8000 hectares, mine sites will be filled China pares the outlook for sales in the world’s with dumps in five years. This means mining biggest user. activities will come to an end in five years,” said Fortescue, the world’s No. 4 iron ore exporter, Haresh Melwani, chief executive officer of H L continues to see strong demand from customers Nathurmal & Co, a Goa-based iron ore miner in China, Korea, Japan and India.“We have and exporter. absolutely no intention of reducing production, Sesa Sterlite Q3 consolidated PAT down 11% to Rs 1,588 crore or cutting back at any of our mine sites,” Chief Executive Officer Nev Power said onThursday on a conference call. With the rapid price fall, Fortescue could boost margins by lowering output to 120 million tonne a year, Goldman Sachs Group Inc said in November. The Perth-based company sees fiscal 2015 production of 155-160 million tonne (mt). Natural resources conglomerate Sesa Sterlite reported a net profit of Rs 1587.50 crore for the quarter ended December, down 15% from profit of Rs 1868.29 crore during the same quarter last year, hurt poor performance at its oil and gas business. 7 Daily Friday 30, January 2015 won ($578.64 million) on a parent basis for the October to December quarter. This was lower than analysts' estimates of 675 billion Korean won and the 488 billion won operating profit in 2013, when it also suffered from the stronger South Korean currency. POSCO CEO Kwon Oh-joon plans to outline the company's 2015 outlook and give more details about its earnings on Feb. 5. Sales at Anil Agarwal-led Sesa Sterlite fell 1.5% to Rs 19128.21 crore. Analysts were expecting a profit of Rs. 1404.70 crore on sales of Rs. 19291.96 crore. Sesa Sterlite's oil and gas business is suffering due to the unexpected fall in oil prices globally. Sesa Sterlite's profit also took a hit on deferred tax payments. The company paid a tax of Rs 477.64 crore compared with a refund of Rs 138.54 crore last year. Sesa Sterlite's oil and gas business reported a profit before tax of Rs 782.95 crore, down 69% compared with Rs 2513.99 crore posted in the same quarter last year. However, the company's zinc and copper business offset the fall to some extent. POSCO reports 30% y-on-yr rise in Q4 operating profit South Korean steelmaker POSCO reported a 30 per cent year-on-year rise in its four-quarter operating profit, slightly missing forecasts, as the slowing economy of top consumer China kept steel prices weak. China's economy last year grew at its slowest pace in almost quarter of a century, reducing demand for the alloy used in the automobile, shipbuilding, construction and home appliance sectors. The slowdown is expected to continue this year. POSCO's operating profit was 632 billion Nippon Steel takes $583 mn charge on Brazilian unit Nippon Steel & Sumitomo Metal Corp said on Thursday it took a 68.6 billion yen ($583 million) charge in the April-December period as a slump in oil prices was hurting profits at its pipe affiliate in Brazil. Japan's biggest steelmaker, which also supplies steel pipes to oil and gas companies globally, expects the drop in oil to have a negative impact on its earnings for the next business year starting in April, an executive said. "We don't expect a major impact from lower oil prices this business year but we may see a negative effect on new orders and output of 8 Daily steel pipes in the next business year," Executive Vice President Katsuhiko Ota told a news conference on its earnings. "If oil prices stay below $50, orders for pipes will be held back. We need to cope with the changes carefully," he said. Friday 30, January 2015 Nippon Steel took the charge on Vallourec & Sumitomo Tubos do Brasil (VSB), its joint venture with France's Vallourec , which holds a 56 percent stake. Nippon Steel owns 40.4 percent while Sumitomo Corp has 3.6 percent. Ota said Nippon Steel was taking an Global oil prices have tumbled almost 60 impairment loss equivalent to 80-90 percent percent since June, forcing a number of oil and of the book value of VSB at the time of its gas companies to scale back capital spending investment in 2007. plans for 2015. The joint venture, which can produce 600,000 United States Steel Corp said this month it tonne of seamless pipes a year, is currently would idle plants in Illinois and Indiana due to operating at about a 60-70 percent utilisation weak demand from the oil industry, resulting in rate and has been making a loss, according to the layoff of 545 people. Nippon Steel. 9

© Copyright 2026