
Weekly FX Insight - Citibank Hong Kong
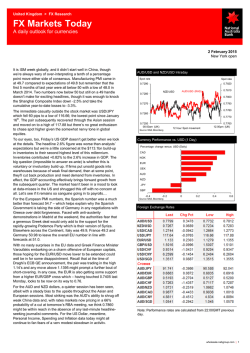
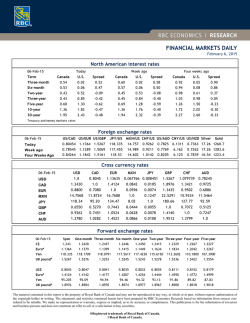
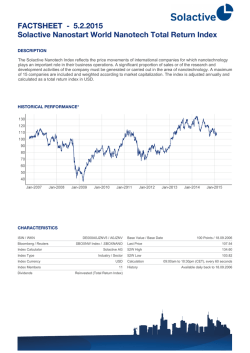
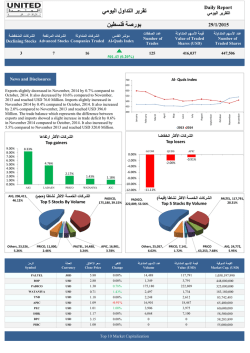
Citibank Wealth Management Weekly FX Insight Please note and carefully read the Important Disclosure on the last page Weekly FX Insight Feb 2, 2015 with data as of Jan 30, 2015 Market Review & Focus FX Analysis FX & Eco. Figures Forecast P. 1 - 4 P. 5 - 9 P. 10 - 13 © 2013 Citibank Citibank and Arc Design is a registered service mark of Citibank, N.A. or Citigroup Inc. Citibank (Hong Kong) Limited Weekly FX Recap Please note and carefully read the Important Disclosure on the last page Major Currencies Weekly Performance LAST WEEK PERFORMANCE CCY USD EUR/USD USD/JPY GBP/USD USD/CAD AUD/USD NZD/USD USD/CHF GOLD 52 week high 52 week low 1 year % change 16.92% Close Price Day High Day Low 94.80 95.53 93.70 95.53 78.91 1.1291 1.1423 1.1098 1.3993 1.1098 -16.70% 117.49 118.66 117.26 121.85 100.76 -12.57% 1.5060 1.5224 1.4966 1.7192 1.4952 1.2732 1.2799 1.2380 1.2799 1.0621 -12.37% 0.7762 0.8025 0.7720 0.9505 0.7720 -11.74% 0.7261 0.7494 0.7216 0.8836 0.7216 -11.08% 0.9202 0.9290 0.8765 1.0240 0.7406 1283.77 1299.37 1252.05 1392.22 1131.24 3.20% Weekly changes versus US dollar USD INDEX 0.04% EUR 0.78% JPY 0.24% GBP 0.47% CAD -2.51% -8.64% AUD Source: Bloomberg L.P., as of January 30, 2015 -1.89% -1.90% NZD CHF -2.54% -4.56% GOLD -6.00% -0.80% -4.00% -2.00% 0.00% 2.00% Source: Bloomberg L.P., as of January 30, 2015 USD The Fed is positive on the economic outlook. Although Q4 GDP grew only 2.6%, the 4.3% gain in consumption suggests that households were confident, underpinning the USD. We anticipate further solid gains in real consumer spending in the first half of 2015, as households begin to use the windfall from lower energy costs. The dollar index rose 0.04% to close at 94.80 last week. USD outlook: The dollar index may test higher to 95.86. AUD The AUD dropped amid expectations of rate cuts by the RBA, although Australia’s weighted CPI yearly growth changed from 0.5% to 0.7%. AUD/USD dropped 1.9% to close at 0.7762 last week. AUD outlook: AUD/USD may consolidate between 0.7704-0.8067. NZD CHF The NZD breached 0.73 as the RBNZ turned its monetary policy stance from hawkish to neutral and talked down the kiwi. NZD/USD dropped 2.5% to close at 0.7261 last week. NZD outlook: NZD/USD may test lower to 0.7118. The CHF plunged as SNB officials said the SNB has been ready for intervention and USD strengthened. USD/CHF breached a resistance at 0.88 and rose 4.6% to close at 0.9202 last week. CHF outlook: USD/CHF may rise to 0.9557-0.9607 gradually. 1 Please note and carefully read the Important Disclosure on the last page Weekly FX Strategies 1. Bearish - AUD • The AUD may be undermined as the RBA may downgrade its view on the economy in this week’s meeting. • AUD/USD may drop to 0.7268 (5.63) upon consolidation between 0.7704-0.8067 (5.97-6.25). 2. Neutral – AUD/NZD • AUD/USD may range trade as the RBA and the RBNZ may not hike rates until next year. • AUD/NZD may range trade between 1.0579-1.0829. 3. Bullish – GBP/AUD • GBP may outperform AUD on U.K. better fundamentals. • GBP/AUD may test higher to 1.9692. 2 Please note and carefully read the Important Disclosure on the last page January FX Recap • Major currencies dropped significantly against the USD as global central banks’ monetary policy stances become more accommodative. Some removed rate hike tendencies, cut rates and even implemented QE. EUR: • The EUR dropped to 1.11 as the ECB announced to implement 1.1 trillion euros worth of QE program and the scale was far higher than expectations of 550-600 billion euros. • Syriza won the Greek election, fueling concerns that Greece may default if it cannot obtain a new round of bailout on schedule. CHF: • The CHF surged 18% in one single day as the SNB suddenly removed EUR/CHF floor at 1.20. • The CHF dropped again as some officials said the SNB would employ measures for intervention. USD/CHF rose to 0.92. Chart 1: Major Currencies Performance in January USD INDEX EUR 5.02% -6.67% JPY 1.95% GBP -3.32% CAD -8.73% AUD NZD -5.05% -6.87% CHF 8.05% GOLD 8.39% -12.00% -8.00% -4.00% • The BoC thinks inflation may not be able to reach the target of 2% in 2015-16. 4.00% 8.00% 12.00% Chart 2: Central Banks’ Monetary Policy Stances CAD: • USD/CAD rose to 1.27 as the BoC cut the interest rate by 25bps to 0.75% 0.00% Source: Bloomberg L.P., as of January 30, 2015 Previous Current Federal Reserve Tightening Rate hike tendency European Central Bank Easing More easing Bank of Japan Easing Easing NZD: Bank of England • The RBNZ kept the interest rate unchanged but its monetary policy stance turned from hawkish to neutral. Bank of Canada Neutral Rate cut Reserve Bank of Australia Neutral Neutral Reserve Bank of NZ Hawkish Neutral Swiss National Bank CHF peg Removal of CHF peg • The RBNZ also further talked down the kiwi. NZD/USD breached 0.73. Gold: • Funds flow into safe-haven gold as the ECB implemented QE, increasing volatility. Spot gold/USD rose near $1,300/ounce. Rate hike tendency Rate hike tendency Source: Citi, as of January 30, 2015 3 Weekly FX Focus: Please note and carefully read the Important Disclosure on the last page The AUD may be undermined by RBA’s rate decision • RBA’s rate decision this week may become the market focus. We expect the RBA is unlikely to cut rates but it may downgrade its view on the economy, which may undermine the AUD. Chart 1: AUD & Commodity Price Index Forecasts on RBA’s statement: • Do not cut rates: The RBA may keep the interest rate at 2.5%. • Tweak the statement: The RBA may emphasize the further decline in commodity prices and strengthen the language around the AUD, but keep unchanged the monetary policy guidance. • More negative view on the economy: The RBA may shift to an easing bias, highlighting risks to investment and incomes from lower commodity prices and a too high AUD. AUD Outlook: • The continuing falls in key commodity prices meant fair value for the AUD was also sliding (Chart 1). Source: Citi, as of January 30, 2015 Chart 2: Market Estimates on Probability of Rate Cuts(%) • Since annual underlying inflation remained in the bottom half of the target, an economic slowdown in China and easing policies by other major central banks, market pricing still favoured lower rates (Chart2). • The RBA would want to keep the market pricing a cut for currency reasons. • If the RBA keeps the interest rate unchanged, this would only shift expectations on the timing. AUD/USD may test lower to 0.7268 upon consolidation between 0.7704-0.8067. 65% probability of rate cuts Source: Citi, as of January 30, 2015 4 AUD/USD Please note and carefully read the AUD/USD may test lower to 0.7268 (5.63) upon Important Disclosure on the last page consolidation The brackets are the exchange rates in terms of Hong Kong dollar, with HKD $7.7519 exchange rate for reference Last Price 0.7762 (6.02) Last wk High Last wk Low 2nd Support 1st Support 1st Resistance 2nd Resistance 0-3m Forecast 6-12m Forecast 0.8025 (6.22) 0.7720 (5.98) 0.7268 (5.63) 0.7704 (5.97) 0.8067 (6.25) 0.8209 (6.36) 0.82 (6.36) 0.72 (5.58) Upcoming Economic Data Fed 3: RBA rate decision Market Recap: The AUD dropped amid concerns of rate cuts by the RBA, although Australia's weighted CPI rose from 0.3% QoQ to 0.7% QoQ in Q4. AUD Outlook: The AUD may drop on rate cut expectations in the short term. Since the job market is improving amid better-than-expected CPI and additional measures may be needed to restrain the local house prices due to rate cuts, Citi analysts expect the RBA is unlikely to cut rates. However, RBA's statement may further talk down the AUD and may turn more pessimistic about Australia's economic outlook, which may pressure the AUD. 0.7704-0.8067 (Jul 2009 & 2010 lows) 0.7070-0.7268 (Long-term uptrend & Jan 2009 top) Technical Analysis: AUD/USD may test lower to 0.7268 (5.63) upon consolidation between 0.7704-0.8067 (5.97-6.25). Source: Bloomberg L.P., as of January 30, 2015 5 Please note and carefully read the Important Disclosure on the last page NZD/USD The brackets are the exchange rates in terms of Hong Kong dollar, with HKD $7.7519 exchange rate for reference Last Price Last wk High Last wk Low 2nd Support 1st Support 1st Resistance 2nd Resistance 0-3M 6-12M 0.7261 (5.63) 0.7494 (5.81) 0.7216 (5.59) 0.6690 (5.19) 0.7118 (5.52) 0.7457 (5.78) 0.7609 (5.90) 0.77 (5.97) 0.67 (5.19) The NZD downside may be limited amid good job data Weekly recap: Although the RBNZ kept the interest rate unchanged, the NZD dropped as its monetary policy stance turned from hawkish to neutral and it said to keep the low interest rate for some time. Outlook analysis: Citi analysts expect the RBNZ to delay its rate hikes from Dec 2015 to Q2 2016 due to rising disinflation risk, which may pressure the NZD. However, unemployment rate that will be released this week may drop from 5.4% to 5.2%, which may limit NZD downside. Technical analysis: NZD/USD may test lower to 0.7118 (5.52) but it is unlikely to drop significantly in the short term. NZD/USD – Daily Chart 0.7371-0.7457 (Nov 2011 & May 2012) 0.7118 (Mar 2011 low) 0.6540-0.6690 (200-month MA & Jul 2005 low) Source: Bloomberg L.P., as of January 29, 2015 GBP/USD Last Price Last wk High Last wk Low 2nd Support 1st Support 1st Resistance 2nd Resistance 0-3M 6-12M GBP/USD – Daily Chart 1.5060 1.5224 1.4966 1.4814 1.4952 1.5453 1.5808 1.53 1.47 (11.67) (11.80) (11.60) (11.48) (11.59) (11.98) (12.25) (11.86) (11.39) The GBP may be supported at lows amid strong U.K. economic growth Weekly recap: The GBP was supported at lows last week as U.K. economic growth rose 2.6% YoY to 2.7% YoY in Q4 2014, reflecting strong U.K. economic growth. Outlook analysis: Political uncertainties brought by the general election in May and low inflation may prompt the BoE to delay its rate hikes to Q1 2016, which may undermine the GBP. However, GBP downside may be limited as the economic growth may reach 3% due to strong business investment underpinned by low oil prices and rising wage. Technical analysis: GBP/USD may range trade between 1.4952-1.5453 (11.59-11.98) due to the RSI divergence. 1.5453-1.5481 (55MA & fibo 0.236) 1.4952 (Jan 23 low) Source: Bloomberg L.P., as of January 30, 2015 6 Please note and carefully read the Important Disclosure on the last page GBP/AUD The brackets are the exchange rates in terms of Hong Kong dollar, with HKD $7.7519 exchange rate for reference Last Price Last wk High Last wk Low 2nd Support 1st Support 1st Resistance 2nd Resistance 1.9412 1.9501 1.8896 1.8685 1.8922 1.9692 2.0000 The GBP may outperform the AUD as low oil prices undermine Australia's inflation but they underpin U.K consumption Weekly recap: GBP/AUD surged last week as U.K. economic growth remained strong in Q4 2014 while markets are concerned that the RBA may announce rate cuts. Outlook analysis: Australia's inflation downside pressure may increase and export income may reduce amid falling oil prices and iron ore prices and a slowdown in China's economic growth. By contrast, low oil prices underpin U.K. consumption. Thus, the GBP may outperform the AUD. Technical analysis: GBP/AUD may test higher to 1.9692 after breaching last Dec top at 1.9309. GBP/AUD – Daily Chart 1.9692 (May 2009 low) 1.9309 (Dec 2014 top) 1.8685 (Oct 2014 top) 1.8922 (Jan 28 low) Source: Bloomberg L.P., as of January 30, 2015 AUD/NZD Last Price Last wk High Last wk Low 2nd Support 1st Support 1st Resistance 2nd Resistance 1.0692 1.0798 1.0569 1.0355 1.0579 1.0829 1.0941 AUD/NZD may be pressured amid concerns of rate cuts by the RBA but the downside may be limited Weekly recap: AUD/NZD fell from tops last week as the RBNZ kept the interest rate unchanged amid concerns of rate cuts by the RBA this week. Outlook analysis: AUD/NZD may be pressured as the RBA may further talk down the AUD and may turn more pessimistic about the economic outlook in this meeting while NZ job data was better than expected. However, AUD/NZD downside may be limited as the RBA is unlikely to cut rates. Technical analysis: Since the RSI fell from the overbought region, AUD/NZD may consolidate between 1.0579-1.0829. AUD/NZD – Daily Chart 1.0829 (fibo 0.50 1.0579 (fibo 0.236) Source: Bloomberg L.P., as of January 30, 2015 7 Please note and carefully read the Important Disclosure on the last page EUR/USD The brackets are the exchange rates in terms of Hong Kong dollar, with HKD $7.7519 exchange rate for reference Last Price Last wk High Last wk Low 2nd Support 1st Support 1st Resistance 2nd Resistance 0-3M 6-12M 1.1291 (8.75) 1.1423 (8.85) 1.1098 (8.60) 1.0433 (8.09) 1.1098 (8.60) 1.1640 (9.02) 1.1877 (9.21) 1.15 (8.91) 1.10 (8.53) The EUR may be undermined as the ECB may need to expand QE in the medium and long term Weekly recap: Syriza won the Greek election and succeeded in forming a coalition government but the EUR rebounded from lows as markets have already priced in the negative factor. Outlook analysis: The EUR may consolidate in the short term. In the medium term, although the ECB implemented 1.1 trillion euros worth of bond purchase program, the scale is not large enough to support the inflation. Thus, the ECB may need to expand QE, which may undermine the EUR. Technical analysis: EUR/USD may consolidate in the short term and may test lower to 1.0433 (8.09) in the medium term. EUR/USD – Daily Chart 1.1640 (2005 low) 1.1141 (1994 low) 1.0288-1.0433 (Long-term uptrend & 1997 low) Source: Bloomberg L.P., as of January 30, 2015 USD/JPY Last Price Last wk High Last wk Low 2nd Support 1st Support 1st Resistance 2nd Resistance 0-3M 6-12M USD/JPY – Daily Chart 117.49 118.66 117.26 113.52 115.57 120.83 121.85 116 130 (65.98) (65.33) (66.11) (68.29) (67.08) (64.16) (63.62) (66.83) (59.63) The JPY may drop in the medium and long term as the BoJ may expand QE in Jul Weekly recap: The JPY range-traded as investors focused on the European and U.S. markets, although Japan’s core inflation (ex-sale tax) fell from 0.7% YoY to 0.5% YoY in Dec 2014. Outlook analysis: Although falling oil prices benefit the economy, inflation downside risks also increase, which may force the BoJ to expand QE in Jul Moreover, funds may flow out of Japan as GPIF increases holdings of foreign assets, which may undermine the JPY in the medium and long term. Technical analysis: USD/JPY may range trade between 115.57-120.83 (67.08-64.16). 120.83 (Dec 2014 top) 115.57 (Dec 2014 low) Source: Bloomberg L.P., as of January 30, 2015 8 Please note and carefully read the Important Disclosure on the last page USD/CAD Last Price Last wk High Last wk Low The brackets are the exchange rates in terms of Hong Kong dollar, with HKD $7.7519 exchange rate for reference 2nd Support 1st Support 1st Resistance 2nd Resistance 0-3M 6-12M USD/CAD – Daily Chart 1.3065 (2009 top) 1.4989 1.5213 1.4952 1.4231 1.4814 1.5035 1.5231 1.53 1.47 (11.62) (11.79) (11.59) (11.03) (11.48) (11.66) (11.81) (11.86) (11.39) The CAD may be undermined as falling oil prices undermine Canada’s economy and inflation Weekly recap: The CAD dropped last week as Canada’s economy shrank 0.2% MoM in Q4 2014 and slowed down from 2.3% YoY to 1.9% YoY. Outlook analysis: Data showed that falling oil prices undermined the economy and inflation seriously. Citi analysts expect the BoC may keep the current interest rate until Q3 2016, which may undermine the CAD in the medium and long term. Technical analysis: USD/CAD may test higher to 1.3065 (5.93) upon consolidation, with support at 1.2202-1.2506 (6.35-6.20). 1.2202-1.2506 (fibo 0.764 & Apr 21, 2009 top) Source: Bloomberg L.P., as of January 30, 2015 USD/CNY Last Price Last wk High Last wk Low 0-3M 6-12M 6.2506 6.2578 6.238 6.22 6.30 The CNY may be underpinned as falling oil prices may increase China's trade income Weekly recap: The CNY dropped last week as China’s unofficial PMI drop to 49.8 in Dec 2014, lower than 50 and fueling expectations of rate cuts by China. Outlook analysis: Although continuous falling oil prices may increase China's trade income, which may underpin the CNY, the government may push down the CNY as a policy tool due to low inflation and high corporate debts. Moreover, the CNY may be restrained as the PBoC may cut rates in the 1H 2015 while U.S. treasury yields may rebound. USD/CNY – Daily Chart 6.30 (6-12 month forecast) 6.22 (0-3 month forecast) Long-term forecast: 6.10 Source: Bloomberg L.P., as of January 30, 2015 9 Upcoming Economic Figures and Events The USD may be underpinned amid U.S. job data Please note and carefully read the Important Disclosure on the last page January NFP U.S. In 11 of the past 15 years, the January headline print has been one of the most extreme values of the year. We expect an above trend reading of 275K, reflecting relatively benign weather and few disruptions in the survey week. Last month, the surprising 0.2 percent decline in average hourly earnings was a one-time event and anticipate a smart reversal. The figure may grow 0.3% this time February 6 (Fri): NFP Citi forecast Prior 275K 252K RBA’s rate decision Australia Even if the RBA does not cut, we doubt AUD may manage a significant rally. The issue is that external factors have motivated the decline in Australian rate expectations and absent improvement in the backdrop abroad, particularly in China, a major re-pricing looks unlikely. This means the downtrend in AUD is likely to remain in place. 2014 Q4 unemployment rate New Zealand We expect another strong employment report, given the strength of the economy, resulting in a further drop in the unemployment rate. That said, job and wage growth is concentrated in a few sectors so overall wage growth is likely to remain well contained. January unemployment rate Canada Observers will be keen to see if Labor Force Survey employment continued to weaken after a 65,000 downward revision to net hiring in 2014 and a downgrade in the December unemployment rate from 6.6 percent to 6.7 percent. Street economists anticipate a modest 5,500 increase in January hiring and for the jobless rate to remain at 6.7 percent. February 3 (Tue): RBA rate decision Citi forecast Prior 2.50% 2.50% February 5 (Thur): Unemployment rate Citi forecast Prior 5.2% 5.4% February 6 (Fri): Unemployment rate Citi forecast Prior 6.70% 6.60% 10 Appendix 1: Citi Interest Rate and FX Forecast for 2015 Please note and carefully read the Important Disclosure on the last page Citi FX Outlook Forecast Dollar Index EUR/USD GBP/USD USD/JPY USD/CHF AUD/USD NZD/USD USD/CAD USD/CNY 0-3 month 92.54 1.15 1.53 116 0.83 0.82 0.77 1.19 6.22 Source: Citi, forecast as of Jan 16, 2015 EUR GBP AUD NZD JPY 6-12 month 97.95 1.10 1.47 130 0.95 0.72 0.67 1.25 6.30 Forecast downgraded Citi FX Interest Rate Forecast 1/30/15 0.25 0.05 0.50 0.10 -0.75 2.50 3.50 0.75 2.75 Forecast upgraded 1Q ’15 0.25 0.05 0.50 0.10 -1.50 2.50 3.50 0.75 2.50 Rate cut expectations 2Q ’15 0.25 0.05 0.50 0.10 -1.50 2.50 3.50 0.75 2.25 3Q ’15 0.25 0.05 0.50 0.10 -1.50 2.50 3.50 0.75 2.25 Rate hike expectations Since weak EUR may be one of the major ECB's objectives and the ECB may implement additional easing, Citi analysts expect the EUR may consolidate at 1.15 for the coming 0-3 months and may drop to 1.10 in the medium and long term and parity may be approached in the coming two years. GBP could be supported in the near term by a still strong economy and possible rate hikes in 2016 Q1. GBP/USD may stabilize at 1.53 for the coming 0-3 months. But political risk premia may rise further out and U.K. is facing the serious twin fiscal/ current account deficits, which may undermine the GBP. Thus, Citi analysts expect the GBP to test lower to 1.47 for the coming 6-12 months. The AUD may be further undermined due to strong USD, larger-than-expected speed and magnitude of decreases in commodity prices and further deterioration of terms of trade. We expect the AUD to hover around 0.82 for the coming 0-3 months and drop to 0.72 for the coming 6-12 months. Since the RBNZ may defer rate hikes to Q2 2016 and commodity prices keep falling, which may be NZD-negative. We expect the NZD to hover around 0.77 for the coming 0-3 months and drop to 0.72 for the coming 6-12 months Since the BoJ may expand QE and GPIF is reallocating its portfolio, Citi analysts expect USD/JPY to test higher to 130. 11 Appendix 2: Last week’s Economic Figures Please note and carefully read the Important Disclosure on the last page Time Importance Event Period Actual Survey Prior Monday 01/26/2015 07:50 JN ! Trade Balance Adjusted Dec -¥712.1B -¥743.1B -¥832.5B 01/26/2015 17:00 GE !! IFO Business Climate Jan 106.7 106.5 105.5 Dec 2 -- 1 Tuesday 01/27/2015 08:30 AU ! NAB Business Confidence 01/27/2015 17:30 UK !! GDP YoY 4Q 2.70% 2.80% 2.60% 01/27/2015 21:30 US !! Durable Goods Orders Dec -3.40% 0.60% -2.10% 01/27/2015 22:00 US ! S&P/CS Composite-20 YoY Nov 4.31% 4.30% 4.47% 01/27/2015 23:00 US !! New Home Sales MoM Dec 11.60% 2.70% -6.70% 01/27/2015 23:00 US !! Consumer Confidence Index Jan 102.9 95.5 93.1 01/28/2015 08:30 AU !!! CPI YoY 4Q 1.70% 1.80% 2.30% 01/29/2015 03:00 US !!! FOMC Rate Decision (Upper Bound) Jan 0.25% 0.25% 0.25% 01/29/2015 04:00 NZ !!! RBNZ Official Cash Rate Jan 3.50% 3.50% 3.50% 01/29/2015 05:45 NZ !! Trade Balance Dec -159M 75M -285M 01/29/2015 21:30 US !! Initial Jobless Claims Jan 265K 300K 308K 01/29/2015 23:00 US ! Pending Home Sales NSA YoY Dec 8.50% 10.50% 1.50% Dec 3.40% 3.50% 3.50% Wednesday Thursday Friday 01/30/2015 07:30 JN !! Jobless Rate 01/30/2015 07:30 JN !!! Natl CPI Ex Fresh Food YoY Dec 2.50% 2.60% 2.70% 01/30/2015 18:00 EC !! Unemployment Rate Dec 11.4% 11.50% 11.50% 01/30/2015 18:00 EC !!! CPI Estimate YoY Jan -0.60% -0.50% -0.20% 01/30/2015 21:30 CA !!! GDP YoY Nov 1.90% 2.10% 2.30% 01/30/2015 21:30 US !!! GDP Annualized QoQ 4Q 2.60% 3.00% 5.00% 01/30/2015 23:00 US !! U. of Mich. Sentiment Jan 98.1 98.2 98.2 Source: Bloomberg L.P. 12 Appendix 3: Upcoming Economic Figures (Feb 2, 2015 – Feb 6, 2015) Please note and carefully read the Important Disclosure on the last page Time Importance Event Period Actual Survey Prior Dec Feb Dec Feb ---- -850M 2.50% 0.30% -925M 2.50% 0.10% Jan Dec Jan Jan ----- --1.10B 6.70% 5.0K 55.4 -0.64B 6.60% -4.3K Jan -- 51 51 4Q -- 5.30% 5.40% Jan Feb Dec ---- 52.8 0.50% -£1600 52.5 0.50% -£1406 Dec Dec Jan Jan Jan Jan Dec Jan Jan ---------- 0.20% -0.20% 54.8 220K 56.5 --$38.0B 5.60% 231K 0.40% 0.60% 55.5 241K 56.2 265K -$39.0B 5.60% 252K Australia 02/03/2015 08:30 02/03/2015 11:30 02/05/2015 08:30 02/06/2015 08:30 Tue Tue Thur Fri ! !!! ! !!! Trade Balance RBA Cash Rate Target Retail Sales MoM RBA Statement on Monetary Policy Canada 02/04/2015 23:00 02/05/2015 21:30 02/06/2015 21:30 02/06/2015 21:30 Wed Thur Fri Fri ! !! !! !! Ivey Purchasing Managers Index SA Int'l Merchandise Trade Unemployment Rate Net Change in Employment 02/02/2015 17:00 Mon !! Markit Eurozone Manufacturing PMI Europe New Zealand 02/04/2015 05:45 Wed !! Unemployment Rate U.K. 02/02/2015 17:30 02/05/2015 20:00 02/06/2015 17:30 Mon Thur Fri !! !! !! Markit UK PMI Manufacturing SA Bank of England Bank Rate Trade Balance U.S. 02/02/2015 21:30 02/02/2015 21:30 02/02/2015 23:00 02/04/2015 21:15 02/04/2015 23:00 02/05/2015 21:30 02/05/2015 21:30 02/06/2015 21:30 02/06/2015 21:30 Source: Bloomberg L.P. Mon Mon Mon Wed Wed Thur Thur Fri Fri !! !! !! !! ! !! ! !!! !!! Personal Income Personal Spending ISM Manufacturing ADP Employment Change ISM Non-Manf. Composite Initial Jobless Claims Trade Balance Unemployment Rate Change in Nonfarm Payrolls 13 Important Disclosure For any enquiries, please call (852) 2860-0333 This document is based on information provided by Citigroup Investment Research, Citigroup Global Markets, and Citigroup Global Wealth Management. It is provided for your information only. It is not intended as an offer or solicitation for the purchase or sale of any security. Information in this document has been prepared without taking account of the objectives, financial situation or needs of any particular investor. Accordingly, investors should, before acting on the information, consider its appropriateness, having regard to their objectives, financial situation and needs. Any decision to purchase securities mentioned herein should be made based on a review of your particular circumstances with your financial adviser. Investments referred to in this document are not recommendations of Citibank (Hong Kong) Limited (“Citibank”) or its affiliates. Although information has been obtained from and is based upon sources that Citibank believes to be reliable, Citi analysts do not guarantee its accuracy and it may be incomplete and condensed. All opinions, projections and estimates constitute the judgment of the author as of the date of publication and are subject to change without notice. Prices and availability of financial instruments also are subject to change without notice. Past performance is no guarantee of future results. The document is not to be construed as a solicitation or recommendation of investment advice. Subject to the nature and contents of the document, the investments described herein are subject to fluctuations in price and/or value and investors may get back less than originally invested. Certain high-volatility investments can be subject to sudden and large falls in value that could equal the amount invested. Certain investments contained in the document may have tax implications for private customers whereby levels and basis of taxation may be subject to change. Citibank does not provide tax advice and investors should seek advice from a tax adviser. Investment products: (i) are not insured by the Federal Deposit Insurance Corporation; (ii) are not deposits or other obligations of any insured depository institution (including Citibank); and (iii) are subject to investment risks, including the possible loss of the principal amount invested. Citi Foreign Exchange: Forecasts are a joint venture between Citi’s foreign exchange, global macro and technical strategy groups and our developed and emerging markets economists. Under normal circumstances, we expect to present Forecasts on a monthly schedule although we may offer intra month updates if circumstances dictate. Technical Trend: All views, opinions and estimates derived from CitiFX Technicals (i) may change without notice and (ii) may differ from those views;, opinions and estimates held or expressed by Citi or other Citi personnel, including Citi Foreign Exchange: Forecast. Should CitiFX Technicals not cover any major currency pairs, the indication of short-term technical "bullish", "bearish", or "neutral" trends will be based on the result of analysis with various widely known short-term technical analysis tools, namely RSI, MACD, fibonacci, stochastics, bollinger bands, and simple moving averages. 14


© Copyright 2026