
View full transcript (PDF)
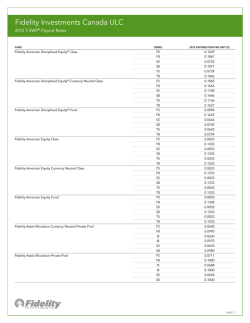
Q1 Quarterly Sector Update Video
[Title fly in] Matthew Goulet, Vice President of Sector Investment Strategy at Fidelity Investments
Matt Goulet: Hello, I’m Matt Goulet of Fidelity Investments. I’d like to discuss some of our insights on market
developments affecting equity sector investing.
Last year, the S&P 500 gained nearly 14%, and was up roughly 5% in the fourth quarter. Trends were mixed, but there
was solid outperformance by defensive sectors such as Utilities, Health Care, and Consumer Staples. Energy, on the
other hand, was a clear underperformer, as the price of crude oil dropped sharply in the second half of the year.
Now let’s take a look at the quarterly Sector Scorecard.
The Scorecard looks at sector information from five disciplines—business cycle, fundamentals, relative valuations,
momentum, and relative strength. At the end of December, based on these metrics, the Information Technology sector
continued to look very strong. Overarching trends in technology—including software as a service, cloud computing, and
social/local/mobile services for consumer markets—have been supporting this sector and likely will continue to do so.
While Consumer Discretionary does not appear especially strong here, its signals have improved over the past few
months. A recent drop in gasoline prices has provided a tailwind to consumer discretionary spending that may continue
into 2015.
Energy, on the other hand, has been challenged by global crude oil prices, which fell from about $110 per barrel in June
to below $60 by the end of the year. Energy is now reading negative on most factors, with the exception of relative
valuation.
Utilities, a very strong performer in 2014, also looks relatively weak. Investors have been attracted to the sector for its
relatively high and steady dividend yield, as well as compelling investment themes in utilities infrastructure build-out.
However, valuations are now fairly high.
Let’s take a look at some of the sectors that have stood out recently.
The real estate investment trust industry, a segment of the Financials sector, did extremely well in 2014, returning 28%¹.
Despite strong market gains, commonly used REIT valuation metrics are still near historical averages. The industry also is
benefiting from below-average commercial construction activity. In general, supply has not yet caught up with rising
demand for commercial space, which helps keep rental and occupancy rates high.
A second trend we would like to examine is the global supply/demand dynamics of oil. In any sector, supply and demand
is a key factor in determining relative attractiveness. Global oil demand has declined for two straight years, while oil
production jumped this year largely due to an unexpected increase in Libyan production paired with continued growth in
the United States. This has led to a sharp fall in oil prices, and a decline in the price of Energy company stocks.
Now let’s take a look at some of the sectors that may benefit from this recent trend.
Four sectors have tended to outperform when the Energy sector underperforms the broader market by more than 15%
which occurred in Q4 2014. They are Consumer Staples, Telecommunication Services, Health Care, and Utilities. In
general, a drop in the Energy sector of this magnitude tends to occur in tandem with a defensive shift in the broader
market, which explains why these relatively defensive sectors would outperform.
For more information about our views and current themes in sector investing, please see our complete Quarterly Sector
Update. Thank you.
Important Information
Information presented herein is for discussion and illustrative purposes only and is not a recommendation or an offer or solicitation to
buy or sell any securities. The views and opinions expressed by the Fidelity speaker are those of their own as of the date of the
recording, and do not necessarily represent the views of Fidelity Investments or its affiliates. Any such views are subject to change at
any time based upon market or other conditions and Fidelity disclaims any responsibility to update such views. These views should
not be relied on as investment advice, and because investment decisions are based on numerous factors, may not be relied on as an
indication of trading intent on behalf of any Fidelity product. Neither Fidelity nor the Fidelity speaker can be held responsible for any
direct or incidental loss incurred by applying any of the information offered. Please consult your tax or financial advisor for additional
information concerning your specific situation.
Investment decisions should be based on an individual’s own goals, time horizon, and tolerance for risk.
Past performance and dividend rates are historical and do not guarantee future results.
Investing involves risk, including risk of loss.
All indexes are unmanaged, and performance of the indexes includes reinvestment of dividends and interest income, and, unless
otherwise noted, is not illustrative of any particular investment. An investment cannot be made in any index.
Stock markets, especially foreign markets, are volatile and can decline significantly in response to adverse issuer, political,
regulatory, market, or economic developments.
Because of its narrow focus, sector investing tends to be more volatile than investments that diversify across many sectors and
companies. Sector investing is also subject to the additional risks associated with its particular industry.
¹ Based on FTSE NAREIT Equity Only Index. Source: FactSet, Fidelity Investments (AART), as of 12/31/14.
Market Indexes
The S&P 500® Index is a market capitalization–weighted index of 500 common stocks chosen for market size, liquidity, and industry
group representation to represent U.S. equity performance. S&P 500 is a registered service mark of Standard & Poor’s Financial
Services LLC. Sectors and industries are defined by the Global Industry Classification Standard (GICS®).
The S&P 500 Sector Indices include the 10 standard GICS® sectors that make up the S&P 500® Index. The market capitalization of
all 10 S&P 500 Sector Indices together compose the market capitalization of the parent S&P 500® Index; all members of the S&P
500® Index are assigned to one (and only one) sector.
S&P 500 sectors are defined as follows: Consumer Discretionary: companies that provide goods and services that people want but
don’t necessarily need, such as televisions, cars, and sporting goods; these businesses tend to be the most sensitive to economic
cycles. Consumer Staples: companies that provide goods and services that people use on a daily basis, like food, household
products and personal-care products; these businesses tend to be less sensitive to economic cycles. Energy: companies whose
businesses are dominated by either of the following activities: the construction or provision of oil rigs, drilling equipment, or other
energy-related services and equipment, including seismic data collection; or the exploration, production, marketing, refining, and/or
transportation of oil and gas products, coal, and consumable fuels. Financials: companies involved in activities such as banking,
consumer finance, investment banking and brokerage, asset management, insurance and investments, and real estate, including
REITs. Health Care: companies in two main industry groups: health care equipment suppliers and manufacturers, and providers of
health care services; and companies involved in research, development, production, and marketing of pharmaceuticals and
biotechnology products. Industrials: companies whose businesses manufacture and distribute capital goods, provide commercial
services and supplies, or provide transportation services. Information Technology: companies in technology software and services
and technology hardware and equipment. Materials: companies that are engaged in a wide range of commodity-related
manufacturing. Telecommunication Services: companies that provide communications services primarily through fixed-line,
cellular, wireless, high bandwidth, and/or fiber-optic cable networks. Utilities: companies considered to be electric, gas, or water
utilities, or companies that operate as independent producers and/or distributors of power.
Third-party marks are the property of their respective owners; all other marks are the property of FMR LLC.
Glossary
Dividend Yield
Annual dividends per share divided by share price.
Relative Strength
The comparison of a security’s performance relative to that of a benchmark, typically a market index.
Methodology
Business Cycle
The business cycle as used herein reflects fluctuation of activity in the U.S. economy and is based on Fidelity’s analysis of historical
trends.
Fundamentals
Sector rankings are based on equally weighting the following four fundamental factors: EBITDA growth, earnings growth, return on
equity, and free-cash-flow margin. However, we have evaluated the Financials sector only on earnings growth and return on equity
because of differences in its business model and accounting standards.
Momentum
Compares the price change of a sector versus itself over a 12-month period, with a one-month reversal on the latest month;
identifying persistence in returns can be a useful indicator of sector performance during a six- to 12-month period.
Relative Strength
Compares the strength of a sector versus the 500®Index over a six-month period, with a one-month reversal on the latest month;
identifying relative strength patterns can be a useful indicator for short-term sector performance.
Relative Valuations
Valuation metrics for each sector are relative to the S&P 500 ® Index. Ratios compute the current relative valuation divided by the 10year historical average relative valuation. Sectors are then ranked by their weighted average ratios, which are weighted as follows:
P/E: 35%; P/B: 20%; P/S: 20%; free-cash-flow yield: 20%; dividend yield: 5%. However, the Financials sector is weighted as follows:
P/E: 59%; P/B: 33%; dividend yield: 8%.
Primary Contributors
Asset Allocation Research Team (AART)
AART is part of the Global Asset Allocation division of Fidelity’s Asset Management organization. AART conducts economic,
fundamental, and quantitative research to develop asset allocation recommendations for Fidelity’s portfolio managers and investment
teams.
Fidelity Management & Research Co. Equity Division
The Equity Division within Fidelity Asset Management consists of 11 portfolio groups, as well as Select and Advisor Focus sector
portfolios. Each group is responsible for portfolio management supported by in-depth fundamental research.
Fidelity SelectCo
SelectCo is a division within Fidelity’s Asset Management organization that is focused exclusively on expanding the company’s 30year heritage of sector investing to help meet the evolving needs of investors and advisers for innovative sector-specific tools,
resources, and products.
If receiving this piece through your relationship with Fidelity Financial Advisor Solutions (FFAS), this publication is provided to
investment professionals, plan sponsors, institutional investors, and individual investors by Fidelity Investments Institutional Services
Company, Inc.
If receiving this piece through your relationship with Fidelity Personal & Workplace Investing (PWI), Fidelity Family Office Services
(FFOS), or Fidelity Institutional Wealth Services (IWS), this publication is provided through Fidelity Brokerage Services LLC, Member
NYSE.
If receiving this piece through your relationship with National Financial or Fidelity Capital Markets, this publication is FOR
INSTITUTIONAL INVESTOR USE ONLY. Clearing and custody services are provided through National Financial Services LLC,
Member
NYSE, SIPC.
711119.1.0
© 2015 FMR LLC. All rights reserved.


© Copyright 2026