
January 2015.pages - Lighthouse Wealth Management
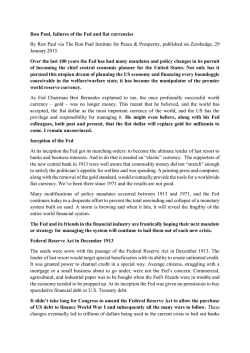
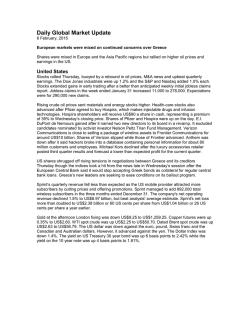
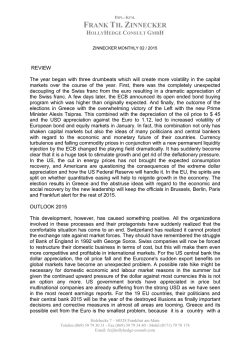
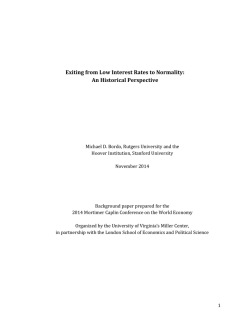
Lighthouse Wealth Management
2015:
The
road
ahead
Which one?
Preface
When the weather is beautiful and the road is straight, clear and familiar it is a given that your foot
is on the gas pedal. When the weather is awful, and the road is winding, crowded and unfamiliar
the brake pedal gets much more action.
Similar to road conditions, the investing markets are subject to varying conditions and drivers must
adjust accordingly. The investing road we have all been traveling over the last few years, to say the
least, has been difficult to navigate. Accordingly, the state of the investing markets and global
economy has pushed many investors to confusion of whether to hit the gas or the brakes on their
portfolio. The dilemma for all investors, professional or not, is how to allocate investments as the
the road gets more confusing the viable number of investment choices shrink and the risks loom.
We closed out 2014 much more volatile than the entirety of 2014 is likely to be perceived. Our
intention is not to go through the headlines of 2014. Rather, there are certain key items from 2014
that could play a lead role in 2015.
In light of the above, Lighthouse Wealth Management is sharing our reflections, assessments,
outlook and approach. Hopefully, we can provide some clarity of thought and guidance for the
road ahead. !2
Table of Contents
The starting line
4
US Federal Reserve (FED)
4
European Central Bank (ECB)
6
Oil Prices
8
Interest Rates
9
Market perspectives
10
The Bull Case
10
The Bear Case
11
Approach and Outlook
11
Disclaimers
12
!3
The starting line
US Federal Reserve (FED)
The FED made its final bond purchases of the 1quantitative easing (QE) 3 program in December
2014. Since the FED first embarked on its QE programs, the US stock market has been highly
correlated to the increase in the balance sheet of the FED. In previous periods of the FED trying to
stop asset purchase programs we have seen the stock market flounder. In chart 1 you will note
the periods when the blue line (FED’s assets) flattened, the S&P 500 moved lower.
The correlation between the Fed Assets and the S&P 500 is so close that it is hard not to think that
the FED operations are not leading stocks higher. Then again, the FED chair people have all
proudly displayed how the stock market has moved up in conjunction with its efforts. This is
known as the wealth effect, which is when people feel wealthier by increased home values and
investment portfolios and are more likely to spend. So, if we judge QE success by its ability to lift
asset prices then it has surely worked.
CHART 1
Over the last few years of economic experiments with QE, the FED has continually pointed to a
small number of economic data points as gauges to the power of the economy. Those data points
are real final sales, real gross domestic product, real disposable income, and real personal
consumption expenditures. The term ‘real’ preceding each term refers to inflation adjustment for
the data points. A year over year growth rate in any of these points at two percent is considered
1
Quantitative easing (QE) is a process of increasing the money supply, typically only seen when interest
rates have already been reduced to zero and when the government is still trying to stop a credit crunch
situation. The first notable usage of quantitative easing was by the Bank of Japan in the early 2000s, and
similar tactics were used again in 2008 by the Federal Reserve to deal with the United States credit crisis.
Source Investor Words
!4
stall speed and as you can see from chart 2, the economy has been operating just above stall
speed in these categories.
CHART 2
As we go into 2015 the Fed has already stopped its QE program and is now discussing step two
of winding down its economic support which means raising interest rates. The FED is hinting that
it will raise rates in 2015 but leaves the door open as it is pinning such decisions on fluidity of
economic data. Historically, interest rate increases have come to slow a speeding economy. In the
current environment we are not seeing a speeding economy as the true reason the FED is seeking
to raise rates. It is more likely that the FED is looking to ‘normalize’ the economic environment.
The question is can the economy stand ‘normal’ interest rates or is it hooked on economic
stimulus? Here in 2015 we start to see answers to this question.
!5
European Central Bank (ECB)
It would be generous to say that Europe’s economy is in bad shape. The problems in Europe really
started with the formation of the Euro common currency. Simplistically, the Euro was formed
without there being a common monetary policy and common interest rates. These two items
alone meant that one day there would be trouble in Europe. The European fallout from the financial
crisis in 2008 has shown that the common currency cannot stand without monetary union. The
reality is that monetary union among such a diverse group of countries and cultures is going to be
near impossible. This has led many to start questioning the long-term viability of the Euro as it
stands.
The ECB has spent the last few years debating about rolling out its own sovereign bond purchase
program. In the second half of 2014 the ECB did begin buying asset backed bonds from the
private sector. With the European economy still under downward pressure, the ECB is scrambling
to find a way to buy sovereign bonds without running afoul of the Maastricht Treaty.
Chart 3
below outlines why the ECB is so desperate to expand its balance sheet.
CHART 3
To make matters worse for Europe, the banking sector has remained in a weakened state and very
hesitant to originate new loans. Restricted access to capital is a primary reason the Europeans
continue to struggle. The ECB has gone as far as to move its interest rates for cash deposited at
the ECB to negative in an effort to stimulate bank lending but, the needle has hardly moved on
opening the purse strings. See (chart 4) on the next page.
!6
CHART 4
A roll out of European QE would likely lift global stock prices much like QE has lifted stock prices in
the US. However, perhaps not as much since Europeans are not large owners of equities like
Americans. The question is can the ECB get a meaningful QE program off the ground?
!7
Oil Prices
As we moved into the end of 2014 oil prices dropped precipitously pushing volatility in
commodities and stocks to the highest level in a number of years. On the one hand, lower energy
costs are a boon for the economy as it adds money to consumer’s pockets (chart 5). On the other
hand, the lower oil prices could be a bust for a big piece of the US economy and that is many of
the oil drillers and exploration companies (chart 6).
CHART 5
CHART 6
Oil prices at this point are suffering from geopolitical issues more than supply demand terms which
can make for sharp moves as we have seen. The energy market will surely be a topic in 2015.
Further it is likely to be a catalyst for a move in the economy and investing markets.
!8
Interest Rates
We are now entering the seventh year of 2zero interest-rate policy (ZIRP) where the FED has taken
the country’s benchmark interest rate, the FED Funds Rate to near zero (chart 7). The original
intent of the ZIRP was really three fold. First, it allowed the banks to borrow from the FED to help
shore up the Wall Street banks. Second, it reduced the servicing cost on the national debt thereby
allowing for more US Government debt. Lastly, it was meant to stimulate consumer spending via
credit.
CHART 7
If we had to point to one item that says the economy is far from healthy it would be that the FED
Funds Rate is still in the zero range. This tells us that even though the government and the FED
are telling us the economy is on the mend, their inaction with interest rates says something else. In
the last year we have heard more talk of the FED raising rates. It is unclear what impact rising
rates will have on the economy. Throughout history an increase in the FED Funds Rate was used
to cool the economy. At this point, the goal would not be to cool an economy, but rather an
attempt to leave the ZIRP policy.
2
The ZIRP policy is a policy instituted by the Federal Reserve Board in 2008 that keeps the federal funds
rate between zero and 0.25%. The purpose of the policy is to stimulate economic activity in a time of slow
economic growth.
!9
Market perspectives
If there has been one trend that has held true for the last few years it is that of divergence. There
are countless examples of divergence throughout global economics and investing markets. Such
divergence is what has caused many investors to question whether to hit the gas or the brakes on
their portfolio. At the heart of investor decision making is how to allocate their investments
amongst different assets. In chart 8 below we have a basic investing spectrum that ranges from
the least risky investments (cash) to the most risky investments (collectibles). The challenge for
most investors is that within the vast majority of their investing history a diversified portfolio
included a fair slug of bonds. Today, with ZIRP policies in place in most of the developed world,
bonds offer more risk than they ever have. So, with low interest rates, the risk-reward profile of
bonds is forcing investors to look further into the red section of chart 8 to achieve higher returns.
The problem is higher returns come with higher risk.
CHART 8
Therefore, if much of the bond universe comes with an unattractive risk to reward relationship then
investors are forced to seek higher risk for higher returns. With that said, we will present the bull
case for stocks and the bear case for stocks.
The Bull Case
You can find a variety of headlines from analysts proclaiming the US stock market is under valued
or fairly valued. When boiled down to their most basic elements the bullish case for stocks is
mostly predicated on low interest rates. Whether analysts are looking at bullish signals generated
from price-to-earnings ratios of companies, borrowing costs, share buy backs, or mergers, they all
point back to low interest rates as an important factor. If one were to plug in higher rate
assumptions into almost any formula from a bullish analyst, the bullish picture would get fuzzier.
However, the reality is low interest rates have been a boon for stocks and low rates are still with us.
As of now, the FED is only talking about raising interest rates. Additionally, if the FED does start
with rate increases likely to be small moves and slowly timed. Therefore, the interest rate
environment certainly is giving continued lift to stocks.
From an economic data stand point the US is still the cleanest dirty shirt and has helped the US
stock market. Additionally, a number of economic data points are looking up in the US. The
reliability of the government economic data should be questioned, but the fact is investing markets
now trade the headlines and the economic headlines have supported rising stock prices.
!10
The Bear Case
The opposite of what we stated above is also true. You can find a variety of analysts proclaiming
the US stock market is overvalued. Many of the bearish analysts are pointing to things such as:
• the uninterrupted length of the rise of the US stock market without a 10% correction
• the growth rates in stocks versus the broad economy are deepening which puts into question the
ability of the economy to support lofty stock prices
• sovereign and corporate debt levels
Additionally, there are many economic data points from the US that give cause for concern and
frankly even the positive economic indicators are not so positive once the details are observed.
Approach and Outlook
Very simply we have a cautiously optimistic approach to the markets. We have done our best to
identify the real world risks to client portfolios and have those discussions so that we can best
construct portfolios that clients can be comfortable holding. As mentioned above, the spectrum of
viable investment options has shrunk over the years thanks to ZIRP. Therefore, we look to balance
portfolios with selective stock exposure, limited overall bond exposure and cash for relatively short
periods. Additionally, we continue to monitor technical indicators for signs of stress in markets.
2015 is likely to be more volatile than the last few years. The theme of divergence will continue as
it seems to be the new pattern resulting from central planning that benefits some and punishes
others. The coming year will certainly have Europe center stage at the start. Europe has struggled
with its economy and has now reached a point where the promises (or threats) of drastic measures
will either be unleashed or left to disappoint. For sure, the time of bumbling along via inaction in
Europe has passed.
There is a good chance that oil prices stay down for the whole year which would be a lift for
consumer spending. However, prolonged oil prices could put a crimp on job creation and force
some serious debt defaults in the energy space. Additionally, the lower oil prices will be an
economic lift for Japan who has been importing energy at very high prices for years. Japan is the
one major economy that could really benefit from prolonged low energy prices.
On the bond side of the investing market we could see a continuation of bond prices moving up as
yields come down. However, this is likely to be a relatively short phenomenon as rates on US
Treasury have little room to go lower which limits the upside for bonds. Conversely, bond yields
have expansive head room which could spell trouble for bond values if rates rise.
Investing markets continue to benefit from the extraordinary economic experiments being run by
global central banks. So, as long as the central banks are implementing easy monetary policies,
we will remain cautiously optimistic of their abilities to direct the economy and markets.
!11
Disclaimers
No part of this document may be reproduced in any way without the prior written consent of
Lighthouse Wealth Management.
Investing involves substantial risk. Lighthouse Financial Advisors, Inc, dba Lighthouse Wealth
Management, is registered as an investment advisor with the SEC and only transacts business in
states where it is properly registered, or excluded or exempted from registration requirements. SEC
registration does not constitute an endorsement of the firm by SEC nor does it indicate that the
advisor has attained a particular skill level or ability.
Lighthouse Wealth Management (LWM) makes no guarantee or other promise as to any results that
may be obtained from their views.
The Standard and Poor’s 500 (S&P 500) the NASDAQ 100 and the Dow Jones Industrial Averages
are unmanaged groups of securities considered to be representative of the stock market in
general.
Indexes are unmanaged and investors are not able to invest directly into any index.
performance is no guarantee of future results.
Past
No reader should make any investment decision without first consulting with his or her own
personal financial advisor and conducting his or her own research and due diligence, including
carefully reviewing investment prospectuses and other public filings of any issuer.
To the maximum extent permitted by law, LWM disclaims any and all liability in the event any
information, commentary, analysis, opinions, advice and/or recommendations in the update that
prove to be inaccurate, incomplete or unreliable, or result in any investment or other losses.
The information provided in the update is obtained from sources which LWM believes to be reliable.
However, LWM has not independently verified or otherwise investigated all such information. LWM
does not guarantee the accuracy or completeness of any such information. The commentary,
analysis, opinions, advice and recommendations represent the personal and subjective views of
LWM, and are subject to change at any time without notice.
The update is not a solicitation or offer to buy or sell any securities.
Securities are offered through First Allied Securities (FASI), a registered Broker Dealer, Member
FINRA/SIPC. Advisory services offered through Lighthouse Financial Advisors, Inc., a Registered
Investment Adviser dba Lighthouse Wealth Management (LWM).
!12
© Copyright 2026