
Study of the zinc-binding properties of glutathione
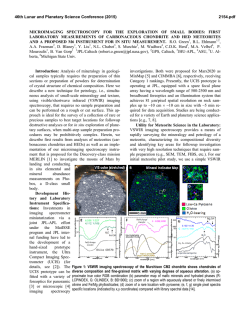
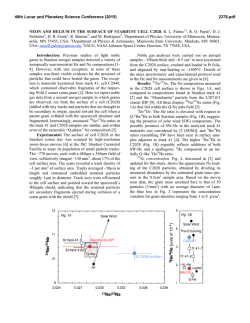
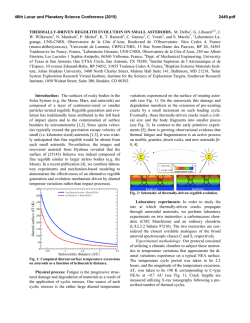
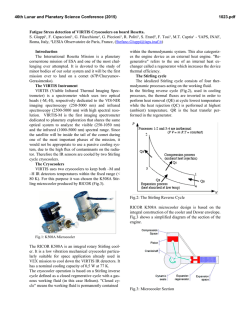
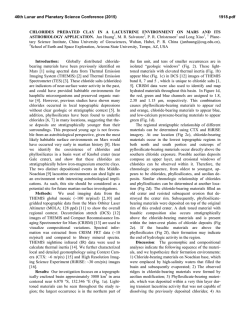
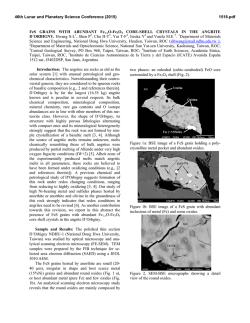
Journal of Inorganic Biochemistry 70 (1998) 91±98 Study of the zinc-binding properties of glutathione by dierential pulse polarography and multivariate curve resolution M.S. Dõaz-Cruz, J. Mendieta, A. Monjonell, R. Tauler, M. Esteban * Departament de Quõmica Analõtica, Facultat de Quõmica, Universitat de Barcelona, Avda. Diagonal 647, 08028-Barcelona, Spain Received 14 July 1997; received in revised form 14 January 1998; accepted 23 January 1998 Abstract The complexation between Zn2 and glutathione (GSH), in borate buer, is studied by Dierential Pulse Polarography (DPP). Data obtained at pH 8.5 from a titration of Zn2 by GSH, i.e. at dierent GSH-to-Zn2 concentration ratios have been analyzed by a recently proposed multivariate curve resolution method. DPP signals obtained within a wide pH range, but at ®xed 1.25:1 GSH-toZn2 concentration ratios, have been resolved individually at each pH value. Results from both sets of experiments can be explained with a complexation model involving the formation of a predominant complex, with a stoichiometry of 2:2 GSH : Zn2 .This result is in contrast with those for the Cd2 ±GSH systems, where two complexes, 2:1 and 2:2 GSH : Cd2 , were detected. A scheme for the global electrode process is given. Ó 1998 Elsevier Science Inc. All rights reserved. Keywords: Zinc; Glutathione; Polarography; Voltammetry; Factor analysis; Peak ®tting; Curve resolution 1. Introduction The binding of metal ions by proteins and peptides is of fundamental interest due to the importance of metal ions in biological systems. Metals may be part of the active sites of enzymes, stabilise the macromolecular structure of proteins and aect enzymes or membranes to control cell metabolism. Due to their high anity to sulphur, the interaction of heavy metals with sulfhydryl containing amino acids and proteins plays a major role in their environmental and biochemical behaviour [1±6]. For instance, data on at least 34 enzymes suggest that Zn(II) may be involved as a necessary cofactor. Several metabolically important reactions are catalysed by these enzymes, including hydrolysis, hydration, oxidation±reduction and group-transfer reactions. Voltammetric techniques have been widely used for the study of the interactions between metal ions and a diversity of ligands [7], including either simple monomeric or macromolecular ligands [8±11]. Dierential Abbreviations: ALS, alternating least squares; DPP, dierential pulse polarography; EFA, evolving factor analysis; FA, factor analysis; GSH, glutathione (c-L -glutamyl-L -cysteinylglycine); MCR, multivariate curve resolution; NMR, nuclear magnetic resonance; SMDE, static mercury drop electrode; SVD, singular value decomposition * Corresponding author. Tel.: +34 93 4021277; fax: +34 93 4021233; e-mail: [email protected]. 0162-0134/98/$19.00 Ó 1998 Elsevier Science Inc. All rights reserved. PII: S 0 1 6 2 - 0 1 3 4 ( 9 8 ) 1 0 0 0 3 - X pulse polarography (DPP) is useful due to its very low detection limits, being complementary to spectrophotometry, potentiometry and nuclear magnetic resonance (NMR). But, in general, the DPP behaviour of such systems containing biologically and/or environmentally relevant ligands is rather involved, with several signals that are changing continuously in their position, morphology or relative peak size, when the pH or the metal-to-ligand ratio changes. Multivariate Curve Resolution (MCR) has been proposed as a tool to get as much information as possible from voltammetric data sets that a priori are very dicult, if not impossible, to interpret [12]. This procedure is based on the use of a family of computational and statistical techniques based on Factor Analysis (FA) and concerned with the resolution of the sources of variation in an experimental data set. The reliability of the proposed method has been recently checked through the DPP study of the complexation of Cd2 by glutathione (GSH) [13]. GSH is the major low-molecular-weight thiol compound of the living plants or animal cells, and it is involved in many aspects of metabolism [14,15], including removal of hydroperoxides, protection from ionising radiation, maintenance of the sulfhydryl status of proteins and aiding detoxi®cation and/or excretion. Considering the abundance of GSH in biological systems and its high af®nity for the essential Zn(II), the complexation is impor- 92 M.S. Dõaz-Cruz et al. / J. Inorg. Biochem. 70 (1998) 91±98 tant in the biological chemistry of Zn(II). For instance, it has been determined by 1 H NMR that Zn(II) is coordinated by GSH in intact human erythrocytes [16] and this is of interest since Zn(II)-induced protection of chinese hamster cells and three derived cell lines from the toxic eects of melphalan, an alkylating agent used in cancer chemotherapy. The MCR method allowed the detection of the formation of 2:2 and 1:2 Cd2 : GSH complexes which were not possible to detect by the visual inspection and the direct analysis of DPP data [13]. In this paper, the procedure is extended to the analysis of the Zn2 ±GSH system, which yields DPP signals, at very negative potentials, almost totally overlapped. It is possible to detect the formation of two complexes, as well as to propose an electrodic process for their reduction and, with the help of a molecular modelling program, a probable structure for the complexes formed. 2. Experimental section 2.1. Chemicals Reduced GSH (>99% iodometric purity con®rmed by both elemental analysis and HPLC with spectrophotometric detection at 220 nm), Na2 B4 O7 á10H2 O, Zn(NO3 )2 á4H2 O, HNO3 and NaOH (Titrisol) solution were obtained from Merck (analytical grade). The samples were usually dissolved in 0.13 M borate buer solution at the required pH. Ultrapure water was obtained from a Milli-Q plus 185 System (Millipore). 2.2. Instrumentation An Autolab System (EcoChemie) attached to a Metrohm 663 VA Stand (Metrohm) and a personal computer was used to perform the DPP measurements. For the automatic additions of the NaOH and HNO3 solutions the system was also connected to a Metrohm 665 Dosimat. The manual additions of chemicals were made with Socorex Swiss micropipetes. All the experiments were carried out in a glass cell at room temperature under puri®ed nitrogen atmosphere. The software package used was the GPES3 (EcoChemie) for the acquisition of the data, and Sigma Plot, Table Curve 2D (both from Jandel Scienti®c), and MATLAB 4.2 (Math Works Inc.) in the data treatment. For all experiments, the working, reference and auxiliary electrodes were the static mercury drop electrode (SMDE), with a drop area of 0.40 mm2 , Ag/AgCl, KCl (3 M), and glassy carbon, respectively. Pulse duration of 40 ms, pulse amplitude of 25 mV, drop time of 0.8 s and a scan rate of 6 mV/s were used. 2.3. Polarographic measurements Dierent buer solutions were tested in order to choose the best medium for working at very negative potentials (ca. )1.3 V), as is the case when Zn-complexes are involved. From those tested, borate buer (0.13 M) was the most idoneous, allowing a linear relationship peak current vs. Zn2 concentration inside a wide range (0±60 lM), at pH 8.5. 2.4. Experiments at ®xed pH and variable GSH-to-Zn2 concentration ratios 10 ml of 0.13 M borate buer solution at the choosen pH are placed into the polarographic cell and deaerated with pure nitrogen (1 atm) during 20 min before starting the experiment. Then, the DPP scan is recorded. An aliquot of the standard Zn2 solution, in the same borate buer medium, is manually added with a Dosimat to get a 1 ´ 10ÿ5 M Zn2 solution. After deaerating for 1 min with mechanical stirring, a new DPP polarogram is recorded. Then, diverse aliquots of a standard GSH solution are manually added, in order to get dierent GSHto-Zn2 concentration ratios, from 0 to 12. All these solutions were deareated and mechanically stirred for 1 min after each addition and before recording the respective DPP polarograms. To avoid the presence of oxygen in the cell, pure nitrogen was passed over the surface of the solution during the measurement step of the experiments. 2.5. Data treatment The method for data treatment is based on factor analysis and multivariate curve resolution [12,13,17]. In a previous work about the GSH±Cd(II) system, the ¯owchart of the procedure for the data treatment was described in detail [13]. The experimental DPP signals obtained at dierent GSH-to-Zn2 concentration ratios were smoothed (fast Fourier ®ltering) and background corrected before the matrix form arrangement. Then, singular value decomposition (SVD) [18] was applied to get the number of components contributing to the DPP response. After that, evolving factor analysis (EFA) [19,20] and alternating least-squares (ALS) [17] were applied to get the individual polarograms and component distribution. Dierent constraints were taken into account during the ALS optimization such as nonnegativity and peak shape. Peak shape constraint is based on the ®tting of the experimental DPP signal shape to a parametric equation that provides the theoretical DPP peak shape [12]. As it was mentioned in the study of the GSH±Cd system [13], due to the nonbilinear [21] structure of the data matrix obtained when pH is changed, the MCR method could not be applied in this case [13,17]. The analysis of these pH-dependent data at ®xed GSH-to-Zn2 concentration ratio was performed by deconvolution of each individual polarogram by nonlinear curve ®tting, assuming that each polarogram is the sum of some peaks previously de®ned by the parametric equation mentioned above. 2.6. Molecular modelling In order to explore if the hypothetical structure proposed from electrochemical data is reasonable, Desktop Molecular Modeller (Oxford University Press) was used. M.S. Dõaz-Cruz et al. / J. Inorg. Biochem. 70 (1998) 91±98 The program allows to ®nd the complex structure with the minimum free energy, knowing the distances and angles of every expected bond with the metal. The program calculates the partial charge of the atoms, except for ionized carboxylic acid groups in which the additional negative charge was equally distributed between the two oxygen atoms. 3. Results and discussion 3.1. Experiments at ®xed pH and variable GSH-to-Zn2 concentration ratios The polarographic behaviour of the Zn2 ±GSH system is rather complex. Fig. 1 summarizes the results obtained at pH 8.5 for several GSH-to-Zn2 concentration ratios. In absence of GSH in the solution, only one peak with its maximum at ca. )1.10 V appears, which corresponds to the DPP signal of the reduction of the electrochemically labile metal under such conditions (free, plus that probably complexed with borate and hydroxo anions). After the addition of GSH, the current at the potential corresponding to the reduction of the labile metal ion decreases. At the same time, an increment in the currents corresponding to the more negative potentials (in the range between )1.15 and )1.35 V) is observed. After further additions of GSH the voltammograms evolve in the same way, but even at high GSH-to-Zn2 concentra- 93 tion ratios ([GSH]/[Zn2 ] 12) the voltammograms present a main peak with a maximum at ca. )1.3 V and a shoulder at ca. )1.15 V. The direct interpretation of these results is not possible because of the changing size and shape of the peaks. Therefore, the use of some multivariate analysis method, such as that previously described [13], is highly recommendable to interpret the system response. The ®rst step in the multivariate method is to obtain the number of dierent components in the system that contribute to the DPP signal. In this work, the most probable number of components necessary to explain the data variation was obtained by the inspection of the singular values of the data matrix. This is represented in Fig. 2. As it can be seen, three singular values are higher than the rest, and the fourth singular value is at the background noise level, suggesting that three components are needed to explain the experimental data. This number is also checked running an ALS optimization considering only two factors (data not shown). The lack of ®t obtained in these conditions (8.16%) was higher than the background noise level. Moreover, the residuals were accumulated in the potential region between the two peaks, suggesting the lack of a third component. At this level of the description of results, it must be remarked that component means mathematical component, and it does not mean necessarily chemical component. This point will be discussed further in detail. Once the number of components has been estimated, EFA [19,20] provides information about how the system evolves along the experiment. With this estimation, ALS Fig. 1. Dierential pulse polarograms of the Zn2 ±GSH system for dierent concentration ratios at 2 ´ 10ÿ5 mol/l GSH and pH 8.5. (Mesh has been plotted from the experimental data matrix after the background current subtraction and the smoothing of individual polarograms by fast Fourier transform ®ltering.) 94 M.S. Dõaz-Cruz et al. / J. Inorg. Biochem. 70 (1998) 91±98 Fig. 2. Singular values of the experimental data matrix obtained for the Zn2 ±GSH system (2 ´ 10ÿ5 mol/l GSH and pH 8.5). optimization [17] recovers an optimal set of concentration pro®les and individual polarographic responses. In a ®rst ALS optimization run, only the nonnegativity constraint for concentration and voltammograms was applied. The individual normalized polarographic responses and concentration pro®les obtained are shown in Fig. 3(a) and (b), respectively. The percentage of unexplained variance is low (lack of ®t of 3.79%). Therefore, it is concluded that experimental data are satisfactorily explained by the model shown in Fig. 3(a) and (b). The contribution of the mathematical component I (Fig. 3(b)) to the global signal decreases when the GSH concentration increases. Because of its shape and characteristic peak potential, the normalized individual polarographic response corresponding to this component (I in Fig. 3(a)) is identi®ed as the peak corresponding to the reduction of free Zn2 . As a consequence, component I corresponds to free Zn2 ion. After the addition of GSH, a second component (II in Fig. 3) appears and its contribution to the global signal increases until a GSH-to-Zn2 concentration ratio of ca. 1. At this ratio its contribution reaches a plateau until a ratio of 4, and then decreases slowly until reaches zero at high GSH-to-Zn2 concentration ratios (ca. [GSH]/[Zn2 ] 10). The third component (III in Fig. 3) appears at [GSH]/[Zn2 ] 1, just when component II reaches the plateau. The contribution of III increases until [GSH]/ [Zn2 ] 10, when it seems to reach the saturation. The individual normalized polarographic responses corresponding to components II and III appear at more negative potentials than that of component I, which induces to think that they are related to dierently complexed Zn2 ions. Moreover, in contrast with the signal corresponding to the free Zn2 (component I in Fig. 3(a)), polarograms of components II and III in Fig. 3(a) do not present the expected peak shape for a Fig. 3. ALS optimization of the experimental data set with nonnegativity constraint: (a) Individual normalized polarograms; (b) relative contribution of each component to the global signal. typical polarographic response. Component II is a double peak with a local maximum at ca. )1.16 V and other maximum at ca. )1.26 V. Moreover, this polarogram overlaps almost completely with the signal corresponding to the component III. A polarographic response with the same features that are described here for the component II was previously found in the GSH±Cd2 system [12,13]. By the use of a constraint implemented in the ALS algorithm to take into account the theoretically expected peak-shaped polarographic response, this double peak was resolved into two independent peaks which were interpreted as due to the electrochemical reduction of two metal ions in a binuclear cluster. In order to apply the same approach to the GSH± Zn2 system, a second ALS optimization run, using nonnegativity and peak shape constraints was performed. The individual polarographic responses and contribution pro®les are shown in Fig. 4(a) and (b), respectively. Despite the use of the shape constraint, the percentage of unexplained variance does not increase excessively, yielding a lack of ®t of only 4.39%. The normalized individual polarograms (Fig. 4(a)) obtained in these conditions present the theoretical M.S. Dõaz-Cruz et al. / J. Inorg. Biochem. 70 (1998) 91±98 95 Fig. 5. Dependence of the peak potential on pH for a 1.25 GSH-toZn2 concentration ratio (3.125 ´ 10ÿ5 mol/l GSH and 2.5 ´ 10ÿ5 mol/l Zn2 solution). This behaviour is dierent to that observed for the GSH±Cd2 system (see Fig. 5 in Ref. [13]), in which four components were detected. In that case, data were interpreted on the basis on a sequential formation of two complexes. The complex 2:1 GSH : Cd appears from the beginning, but the second complex (2:2 GSH : Cd) only exists once the GSH-to-Cd2 ratio exceeds 0.5 [13]. Fig. 4. ALS optimization of the experimental data set with nonnegativity and signal shape constraints: (a) Individual normalized polarograms; (b) relative contribution of each component to the global signal. shape for polarographic peaks. Although the three peaks are partially overlapped, their maxima are well de®ned. Similarly to the GSH±Cd2 system [12,13] these two peaks (II and III) can be also considered as the electrochemical responses due to the reduction of Zn2 in two dierent chemical environments (i.e. coordinated to ligands of dierent nature). Then, the term component must be understood in these measurements as reducible metal ion, and not as a chemical species. This interpretation is the only one which yields to a reasonable interpretation of the experimental data. Only in the case of free Zn2 ion, the reducible metal ion and the species are the same. Taking into account this interpretation of the polarographic responses, the pro®les obtained in these conditions (Fig. 4(b)) show that the signals corresponding to two complexed Zn2 (components II and III) are present even at very high GSH-to-Zn2 concentration ratios. This fact suggests that the predominant GSH±Zn2 complex in the concentration range studied has a 2:2 stoichiometry and contains a binuclear cluster of high stability. 3.2. Experiments at variable pH: In¯uence of pH on the peak potential (Ep ) The binding of Zn2 by GSH has been the aim of a great number of studies [22±27], mostly concerning pH titration experiments. Due to the multiple binding sites in GSH, and lack of information at the molecular level provided by pH titration methods, there is a lack of agreement concerning to the model for the complexation equilibria. It is well known that the potential at which an electrode process takes place is in¯uenced, in a predictable manner, by the pH of the solution, as it is derived from the Nernst equation [13]. The slope value of the plot E vs. pH allows the determination of the ratio between the number of protons involved in the reduction process and the number of electrons transferred in it E Econst ÿ 2:303mRT =nF pH; where m and n correspond to the number of protons and electrons involved in the electrode reaction, respectively, and E is a characteristic potential such as the half-wave potential (E1=2 ) in direct current polarography, or the peak potential (Ep ) in DPP or other voltammetric techniques giving peak-shaped signals. The evolution of the peak potentials (Ep ), obtained at the GSH-to-Zn2 concentration ratio equal to 1.25, as a function of pH is shown in Fig. 5. 96 M.S. Dõaz-Cruz et al. / J. Inorg. Biochem. 70 (1998) 91±98 The signal corresponding to the reduction of the labile Zn2 (curve I), changes very slightly until pH ca. 8. From this pH the peak potential shifts to more negative values, probably due to the formation of hydroxocomplexes because a similar behaviour has been observed for free Zn2 in the absence of GSH (data not shown). The peaks II and III, corresponding to the reduction of the complexed Zn2 ions, appear at the same pH region and present practically the same pH dependence, until a pH value of ca. 9.5, with a slope value close to 0.059 V/log unit, which denotes an electrodic process involving the same number of protons and electrons. The small deviations with respect to the expected theoretical value (0.059 V/log unit), mainly for the peak II at pH > 9.5, can be due to the coexistence of other minoritary species with diverse degrees of protonation. From these results it is reasonable to conclude that two cysteines and two other deprotonable groups, most probably the two amino terminals, must be involved in the complexation of two Zn2 ions by two molecules of GSH; this means the formation of only one complex with a stoichiometry of 2:2 GSH : Zn, in the presence of an excess of metal ion, and that peaks II and III correspond to the reduction of two dierently bound Zn2 ions. At this stage, it is possible to propose the most probable electrode reduction process for the 2:2 GSH : Zn complex based on the above exposed conclusions. Fig. 6 summarizes the main features of the process. For all GSH-to-Zn2 concentration ratios, the 2:2 GSH : Zn complex is formed with two dierently bound Zn2 ions. This complex contains a binuclear cluster linked by bridging cysteine thiolate ligands. The two a- amino groups and probably the two glycil carboxylic acids are also involved in the tetrahedral coordination sphere of the two Zn. The electrode process takes place in two steps. The ®rst step, denoted by SA in Fig. 6, is associated to the reduction of the Zn2 coordinated to the two binding sulfhydryl groups and the two amino groups of the glutamyl residues (curve II in Fig. 5). As a consequence of the ®rst step, the second one, SB , corresponds to the reduction at more negative potentials of the Zn bonded to the two sulfhydryl groups and the two glycine carboxylic acids (curve III in Fig. 5). The results obtained combining all the experiments performed and analysed in this work seem to conclude the presence of only the Zn2 (GSH)2 complex, containing a binuclear Zn2 cluster.The complex structure derived from our data agrees with that proposed by Martin and Edsall [26] from the analysis of pH titration data. These authors propose the formation of complexes in which the cysteinyl or glutamyl group of one glutathione molecule and the cysteinyl or glutamyl group of another one are bound to the same metal, resulting in polynuclear complexes. In order to explore if the proposed cluster is stereochemically compatible with the tripeptide structure, Desktop Molecular Modeller software was used [28]. Additional information about distances and angles of every expected bond with the metal was obtained from the literature for similar binuclear clusters [29], and these data were implemented inside the database of the program. Fig. 7 shows the minimum total energy of the structure for the Zn2 (GSH)2 complex. The coordination sphere of the metal ions has been completed with the Fig. 6. Proposed electrode reaction mechanism for the reduction process of the 2:2 GSH : Zn2 complex. M.S. Dõaz-Cruz et al. / J. Inorg. Biochem. 70 (1998) 91±98 97 Fig. 7. Proposed structure model for the 2:2 GSH : Zn2 complex. two glycine carboxylic groups. The total energy of the structure at the end of the minimization was 45.1 Kcal/mol. The energy contributions due to the bonds, angles, and torsions were not so high. Furthermore, the contributions due to the charge and Van der Waals forces were negative, helping to the stability of the structure. A similar binuclear cluster structure was obtained for the Cd2 (GSH)2 complex, involving the two a-amino glutamyl ends, but this was only supported by the pH variation experiments forming the complex at pH 10 and then decreasing the pH towards more acidic values [13]. When these kinds of experiments were carried out with the Zn2 ±GSH system, the E vs. pH plot was identical to that in Fig. 5 (data not shown), indicating that there is not dierence among forming the Zn2 (GSH)2 complex at basic pH, or going from acidic to basic pH. The dierences between these quite similar complexes of Zn2 and Cd2 can be explained in terms of the Pearson's theory [30] of soft/hard acids and bases. Zn2 is in the borderline between hard and soft metal ion, while Cd2 is soft. The a-amino glutamyl end is a hard ligand, so it binds easier to Zn2 than to Cd2 . Due to this, the formation of the cluster proposed for the 2:2 Zn : GSH complex is impossible at more acidic pH than in the case of Cd2 complex [13]. In conclusion, in our opinion the application of electrochemical techniques in conjunction with powerful multivariate analysis methods is an interesting approach which merits continued developments and rigorous testing with complex systems, in order to check its advantages and limitations. It could be a useful complement to the more powerful and sophisticated techniques such as 1 H or 13 C-NMR coupled to mass spectrometry. A very interesting advantage of the electrochemical approach lies in the very low concentrations needed (lM) which allows to perform studies even at high pH values where classical structural techniques, such as circular dichroism or NMR, working at mM level cannot be used because of the precipitation of some species. Acknowledgements The authors gratefully acknowledge ®nancial support from the Ministerio de Educaci on y Cultura (DGICYT, Projects PB93-1055 and PB93-0744), and from the Direcci o General de Universitats de la Generalitat de Catalunya (GRQ93-1028). We also acknowledge Prof. A. Sorribas of the Departament de Ciencies Mediques Basiques, Universitat de Lleida, and Dr. A. Herraez of the Departamento de Bioquõmica y Biologõa Molecular, Universidad de Alcala de Henares, for the facilities of using Jandel Scienti®c software and DeskTop Molecular Modeller, respectively. J. Mendieta and M.S. Dõaz-Cruz also acknowledges ®nancial support from the Programa de Acciones para la Incorporaci on de Doctores y Tecn ologos from the Ministerio de Educaci on y Cultura and from a doctoral Grant of the Universitat de Barcelona, respectively. References [1] B.L. Vallee, D.D. Ulmer, Ann. Rev. Biochem. 41 (1972) 91. [2] B.L. Vallee, W.E.C. Wacker, in: H. Neurath (Ed.), The Proteins, vol. 5, Academic Press, New York, 1970. [3] A.J. Carty, Amer. Chem. Soc. Symp. Ser. 82 (1978) 339. [4] J.P. Greenstein, M. Winitz, Chemistry of the Amino Acids, vol. 2, Wiley, New York, 1961, p. 569. [5] F.R.N. Gurd, P.E. Wilcox, Advan. Protein Chem. 11 (1956) 311. [6] M. Friedman, Protein-Metal Interactions, Plenum Press, New York, 1974. [7] J. Bue, Complexation reactions in aquatic systems: An analytical approach, Ellis Horwood, Chichester, 1988, pp. 467. [8] M. Esteban, C. Ari~ no, J.M. Dõaz-Cruz, E. Casassas, Trends Anal. Chem. 12 (1993) 276 and references cited therein. [9] M.A.G.T. van den Hoop, H.P. van Leeuwen, Anal. Chim. Acta 273 (1993) 275 and references cited therein. [10] J.M. Dõaz-Cruz, C. Ari~ no, M. Esteban, E. Casassas, Anal. Chim. Acta 273 (1993) 289 and references cited therein. [11] A.M. Nadal, C. Ari~ no, M. Esteban, E. Casassas, Electroanalysis 4 (1992) 757. [12] J. Mendieta, M.S. Dõaz-Cruz, R. Tauler, M. Esteban, Anal. Biochem. 240 (1996) 134. 98 M.S. Dõaz-Cruz et al. / J. Inorg. Biochem. 70 (1998) 91±98 [13] M.S. Dõaz-Cruz, J. Mendieta, R. Tauler, M. Esteban, J. Inorg. Biochem. 66 (1997) 29. [14] H. Sies, A. Wendel (Eds.), Functions of Glutathione in Liver and Kidney, Springer, Berlin, 1978. [15] I.M. Arias, W.B. Jakoby (Eds). Glutathione: Metabolism and Function, Raven, New York, 1976. [16] D.L. Rabenstein, A.A. Isab, FEBS Lett. 121 (1980) 61. [17] J.M. Dõaz-Cruz, R. Tauler, B.S. Grabaric, M. Esteban, E. Casassas, J. Electroanal. Chem. 393 (1995) 7 and references cited therein. [18] G.H. Golub, Ch.F. van Loan, Matrix Computation, The John Hopkins University Press, Baltimore, MD, 1989. [19] H. Gampp, M. Maeder, Ch. Meyer, A.D. Zuberb uhler, Talanta 32 (1985) 1133. [20] H.R. Keller, D.L. Massart, Anal. Chim. Acta 246 (1991) 279. [21] K.S. Booksh, B.R. Kowalski, Anal. Chem. 66 (1994) 782A. [22] N.C. Li, O. Gawron, G. Bascuas, J. Amer. Chem. Soc. 76 (1954) 225. [23] D.D. Perrin, A.E. Watt, Biochim. Biophys. Acta. 230 (1971) 96. [24] A.M. Corrie, M.D. Walker, D.R. Williams, J. Chem. Soc., Dalton Trans. (1976) 1012. [25] N.C. Li, R.A. Manning, J. Amer. Chem. Soc. 77 (1955) 5255. [26] R.B. Martin, J.T. Edsall, J. Amer. Chem. Soc. 81 (1959) 4044. [27] M.L.D. Touche, D.R. Williams, J. Chem. Soc., Dalton Trans. (1976) 1355. [28] Desktop Molecular Modeller, version 3.0, Oxford University Press, Oxford, 1994. [29] M.Y. Chow, X.M. Chen, T.C.W. Mak., J. Chem. Soc., Dalton Trans. (1993) 3413. [30] R.G. Pearson, J. Amer. Chem. Soc. 85 (1963) 3533.


© Copyright 2026