
Exiting from Low Interest Rates to Normality: An
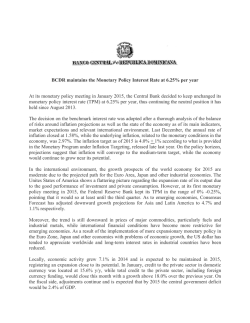
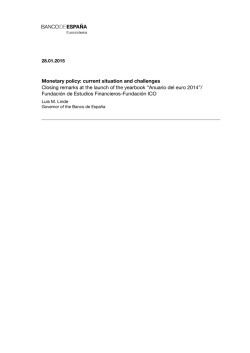
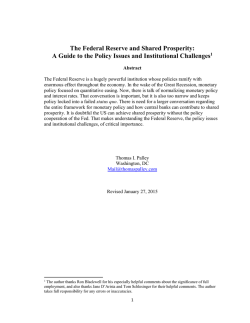
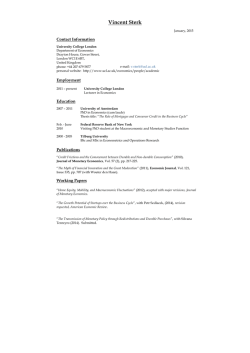
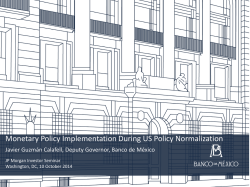
Exiting from Low Interest Rates to Normality: An Historical Perspective Michael D. Bordo, Rutgers University and the Hoover Institution, Stanford University November 2014 Background paper prepared for the 2014 Mortimer Caplin Conference on the World Economy Organized by the University of Virginia’s Miller Center, in partnership with the London School of Economics and Political Science 1 Executive Summary The recent financial recession ended in 2009. It has been followed by close to six years of abnormally sluggish growth. To allay the crisis and contraction, the Federal Reserve drove short-term interest rates to the zero lower bound. To continue stimulating the economy, the Fed has followed a policy of quantitative easing (QE) which has more than tripled its balance sheet. The policy has kept both short-term and long-term interest rates at historically low levels. The U.S. economy is finally showing meaningful signs of recovery and, thus, the Fed stopped its QE policy at the end of October 2014. However, debate continues over the effectiveness of QE and the timing of the Fed’s return to normality either through an increase in its policy rate or by other means. This paper examines the exit debate by looking back at the experience of the 1930s and 1940s when the Fed, under Treasury control, kept interest rates at levels comparable to today and its balance sheet increased similarly. Unlike the present situation of a recovery from a serious recession, rates were kept low back then to finance World War II and to fund the Treasury’s debt at favorable rates. The exit was accomplished when the Fed wrested its independence from the Treasury in the Accord of February 1951. The Fed could once again use the tools of monetary policy and raise interest rates to head off the growing problem of inflation. The paper presents macroeconomic evidence based on the labor market, the growth of the money supply and the behavior of real GDP and the unemployment rate in addition to a comparison of the Federal funds rate with the Taylor Rule rate and the shadow funds rate all indicating that the U.S. economy is now ready to return to the normal environment that prevailed in the Great Moderation. Because of issues connected to its large balance sheet, the Fed may use tools other than the federal funds rate to tighten monetary policy. Returning to a higher (more normal) rate environment will remove some of the distortions that have accompanied the long period of abnormally low interest rates. But rising rates will also present problems for public finance and for the distribution of income that all but guarantees political rancor in the future. Rising rates will also present problems for emerging market economies and, in an international environment where several large economies will be loosening monetary policy, it will create imbalances and spillovers. 2 1. Exiting from Low Interest Rates to Normality: An Historical Perspective1 The Financial Crisis of 2007-2008 and the Great Recession of 2007-2009 were, after the Great Contraction of 1929-1933, among the most severe business cycle events of the twentieth century. The recent recession, like the Great Contraction, involved a serious financial crisis. The crisis in the recent episode was centered in the non-bank financial sector of the economy—the shadow banks, whereas the signature of the Great Contraction was a series of classic banking panics from 1930 to 1933 (Friedman and Schwartz 1963 a). Unlike in the 1930s the Federal Reserve (and the Treasury) followed tried and true lender of last resort actions, in addition to new measures, to allay the financial meltdown that erupted with the collapse of Lehman Brothers in September 2008. Figure 1. Short-term and policy interest rates, 2000-2014 8 7 6 5 4 3 2 1 01/31/2000 06/30/2000 11/30/2000 04/30/2001 09/30/2001 02/28/2002 07/31/2002 12/31/2002 05/31/2003 10/31/2003 03/31/2004 08/31/2004 01/31/2005 06/30/2005 11/30/2005 04/30/2006 09/30/2006 02/28/2007 07/31/2007 12/31/2007 05/31/2008 10/31/2008 03/31/2009 08/31/2009 01/31/2010 06/30/2010 11/30/2010 04/30/2011 09/30/2011 02/29/2012 07/31/2012 12/31/2012 05/31/2013 10/31/2013 03/31/2014 08/31/2014 0 T-Bill 3m Commercial Paper 3m USA Federal Reserve Bank Discount Rate FFR Source: FRED - Federal Reserve Bank of St. Louis The crisis ended by November but the U.S. economy continued to contract. Expansionary Federal Reserve policy in the fall of 2008 reduced the federal funds rate close to zero (see Figure 1 which shows several short-term nominal interest rates in the period 2000-2014). Once the policy rate hit the zero lower bound (ZLB) beyond which conventional monetary policy became ineffective, the Fed initiated its policy of Large Scale Asset Purchases (LSAPs), a policy commonly known as quantitative easing (QE)—open market purchases of long-term Treasury securities and mortgage backed securities from the agencies Fannie Mae and Freddie Mac. For valuable research assistance, I thank Antonio Cusato Novelli. For helpful comments and suggestions I thank Christoffer Koch and John B Taylor 1 3 The original justification for this unorthodox policy was the portfolio adjustment mechanism of Friedman and Schwartz (1963b), Brunner and Meltzer (1973) and Tobin ( 1969). In this mechanism, under the assumption that the assets in the community’s portfolio were imperfect substitutes, the purchase of long-term securities would reduce their yields, raise their prices, and lead investors to substitute in favor of other assets like corporate securities and equities, which would also lead to lower yields. This substitution process would eventually increase investment expenditure and real output. In addition, the increase in asset prices, especially equities, would raise household wealth and encourage consumption expenditure. The direct purchase of mortgage-backed securities (MBS) was intended to reduce mortgage rates and stimulate the moribund housing sector. In addition, the QE program was supposed to affect the economy via a signaling channel.2 On top of these channels. Woodford (2012) has emphasized the importance of forward guidance—communication by the Fed on the pace and timing of its QE purchases. He argues that forward guidance is much more important than actual purchases. The Fed has adopted this approach since 2012. Figure 2. Federal Reserve Balance Sheet, 2008-2014 (Billions of US dollars) Source: Christensen, Lopez and Rudebusch (2014) LSAP 1, which began in November 2008, purchased $1.75 trillion of long-term securities, most of which were in Agency MBSs. It was followed by LSAP 2 in November 2010 in which the Fed purchased $600 billion of long-term Treasury bonds, and then the Maturity Extension Program (MEP) in the Fall of 2011 which was a swap of short-term for long-term securities designed to extend the maturity of the Fed’s portfolio. It was then followed in Krishnamurthy and Vising-Jorgensen (2012, 2013) have argued that the portfolio balance channel works through two narrow channels: a capital constraint channel and a security channel. They find that the purchase of MBSs via their two channels has a stronger and more widespread impact than the purchase of long-term securities whose impact is much more localized. 2 4 October 2012 by LSAP 3 in which the Fed purchased both MBSs and long-term Treasuries. LSAP 3 recently ended at the end of October 2014. The Federal Reserve’s balance sheet more than tripled in the years of quantitative easing (See figure 2 which shows the evolution of the assets of the FRS at a monthly frequency between 2008 and 2014). The figure gives the breakdown between Treasury securities and non-Treasury securities. The $3.5 trillion asset purchases were from the banks and the non-bank public. Most of the purchases were held as excess reserves in the commercial banks that earned interest at 0.25%. Debate swirls over how effective the LSAP policies have been. LSAP 1 lowered long-term yields from 30 to 90 basis points depending on the study (Bernanke 2012 suggested that they were higher). LSAP 2 was much less effective lowering long-term Treasury bonds yields by, at most, 20 basis points.3 (See figure 3, on long-term Treasuries and long-term corporate bond yields 2000-2014). LSAP 3 it has been argued, had even weaker effects (Fisher 2014). Bernanke (2012) posited that the LSAP programs increased real output by 3% and employment by 2 million jobs and effectively attenuated the recession in July 2009. He argued that this made the unusually slow recovery from the Great Recession considerably faster than would otherwise have been the case. Figure 3. Long-term interest rates, 2000-2014 12 10 8 6 4 2 01/31/2000 06/30/2000 11/30/2000 04/30/2001 09/30/2001 02/28/2002 07/31/2002 12/31/2002 05/31/2003 10/31/2003 03/31/2004 08/31/2004 01/31/2005 06/30/2005 11/30/2005 04/30/2006 09/30/2006 02/28/2007 07/31/2007 12/31/2007 05/31/2008 10/31/2008 03/31/2009 08/31/2009 01/31/2010 06/30/2010 11/30/2010 04/30/2011 09/30/2011 02/29/2012 07/31/2012 12/31/2012 05/31/2013 10/31/2013 03/31/2014 08/31/2014 0 US Gov LT Moody's Baa Corporate Bond Yield Moody's AAA Corporate Bond Yield Source: FRED - Federal Reserve Bank of St. Louis The consensus on the success of QE is mixed. Critics like Taylor (2014) and Fisher (2014) argue it didn’t accomplish much. Proponents like Blinder (2013) and Geithner (2014) argue that it did a lot. The US regained its pre-crisis level of real GDP by 2011 and in the 3 Taylor and Stroebel (2012) found that purchases of MBS had virtually no impact. 5 subsequent years has performed much better than the countries of the Eurozone and Japan. But as we discuss in section 3 below, real growth since the recession ended has been unusually slow. 2. Comparison to the 1930s and 1940s 2.1 The 1930s The 1930s and 1940s represented an earlier era of sustained low interest rates. Nominal rates in the 1920s were relatively low because the years 1921-1929 were an era of price stability (even low deflation) and prosperity. The Great Contraction of 1929-1933 involved an over 30% decline in real GDP and a similar decline in the price level. Massive deflation after 1930 became expected (Hamilton 1992, Romer and Romer 2013) leading to very low nominal rates (see figures 4, 5) and high real rates (figures 6 and 7). Some short-term rates hit the zero lower bound in 1932 (some were even negative Cecchetti 1992) but most rates stayed considerably above zero. Keynes (1936) argued that the U.S. was in a liquidity trap and that monetary policy was impotent. The fact that most interest rates were above zero argued against the Keynesian view (Basile, Landon Lane and Rockoff 2010, Orphanides 2004). Moreover econometric evidence by Brunner and Meltzer (1968) found no evidence of a liquidity trap in which the interest elasticity of money demand would become infinite. Figure 4. Short-term and policy interest rates, 1920-1950 8 7 6 5 4 3 2 1 01/31/1920 11/30/1920 09/30/1921 07/31/1922 05/31/1923 03/31/1924 01/31/1925 11/30/1925 09/30/1926 07/31/1927 05/31/1928 03/31/1929 01/31/1930 11/30/1930 09/30/1931 07/31/1932 05/31/1933 03/31/1934 01/31/1935 11/30/1935 09/30/1936 07/31/1937 05/31/1938 03/31/1939 01/31/1940 11/30/1940 09/30/1941 07/31/1942 05/31/1943 03/31/1944 01/31/1945 11/30/1945 09/30/1946 07/31/1947 05/31/1948 03/31/1949 01/31/1950 11/30/1950 0 T-Bill 3m Commercial Paper 3m USA Federal Reserve Bank Discount Rate FFR Source: FRED - Federal Reserve Bank of St. Louis 6 01/31/1920 11/30/1920 09/30/1921 07/31/1922 05/31/1923 03/31/1924 01/31/1925 11/30/1925 09/30/1926 07/31/1927 05/31/1928 03/31/1929 01/31/1930 11/30/1930 09/30/1931 07/31/1932 05/31/1933 03/31/1934 01/31/1935 11/30/1935 09/30/1936 07/31/1937 05/31/1938 03/31/1939 01/31/1940 11/30/1940 09/30/1941 07/31/1942 05/31/1943 03/31/1944 01/31/1945 11/30/1945 09/30/1946 07/31/1947 05/31/1948 03/31/1949 01/31/1950 11/30/1950 01/31/1920 11/30/1920 09/30/1921 07/31/1922 05/31/1923 03/31/1924 01/31/1925 11/30/1925 09/30/1926 07/31/1927 05/31/1928 03/31/1929 01/31/1930 11/30/1930 09/30/1931 07/31/1932 05/31/1933 03/31/1934 01/31/1935 11/30/1935 09/30/1936 07/31/1937 05/31/1938 03/31/1939 01/31/1940 11/30/1940 09/30/1941 07/31/1942 05/31/1943 03/31/1944 01/31/1945 11/30/1945 09/30/1946 07/31/1947 05/31/1948 03/31/1949 01/31/1950 11/30/1950 Figure 5. Long-term rates interest rates, 1920-1950 12 10 8 6 4 2 0 US Gov LT T-Bill 3m Moody's Baa Corporate Bond Yield Commercial Paper 3m Moody's AAA Corporate Bond Yield Source: FRED - Federal Reserve Bank of St. Louis Figure 6. Real short-term and policy interest rates, 1920-1950 30 25 20 15 10 5 0 -5 -10 -15 -20 -25 USA Federal Reserve Bank Discount Rate FFR Source: FRED - Federal Reserve Bank of St. Louis 7 Figure 7. Long-term real interest rates, 1920-1950 30 25 20 15 10 5 0 -5 -10 -15 -20 01/31/1920 11/30/1920 09/30/1921 07/31/1922 05/31/1923 03/31/1924 01/31/1925 11/30/1925 09/30/1926 07/31/1927 05/31/1928 03/31/1929 01/31/1930 11/30/1930 09/30/1931 07/31/1932 05/31/1933 03/31/1934 01/31/1935 11/30/1935 09/30/1936 07/31/1937 05/31/1938 03/31/1939 01/31/1940 11/30/1940 09/30/1941 07/31/1942 05/31/1943 03/31/1944 01/31/1945 11/30/1945 09/30/1946 07/31/1947 05/31/1948 03/31/1949 01/31/1950 11/30/1950 -25 US Gov LT Moody's Baa Corporate Bond Yield Moody's AAA Corporate Bond Yield Source: FRED - Federal Reserve Bank of St. Louis The consensus view on the Great Contraction is that it was brought about by the Federal Reserve’s inability to prevent four banking panics between 1930 and 1933 from precipitating a collapse of the money supply. Friedman and Schwartz (1963a) argued that had the Fed conducted open market operations at key points during the Contraction that it could have been avoided altogether. The key explanations for the Fed’s failure (see Bordo 2014) are: 1) flaws in the Fed’s structure (Friedman and Schwartz 1963a); 2) adherence to the flawed real bills doctrine (Meltzer 2003) and 3) the gold standard (Eichengreen 1992, Temin 1989). Key reasons for the Fed’s failure to act as a lender of last resort (see Bordo and Wheelock 2013) were: 1) access to the discount window was limited only to member banks which left out thousands of small state banks many of whom failed; 2) limited eligible collateral. Restricting collateral to short-term commercial paper, agricultural paper and U.S. government securities precluded access to many banks; 3) stigma. Member banks were reluctant to borrow from the Fed during the crisis because the Fed discouraged lending in the 1920s and because they would be perceived as weak. Despite the Fed’s poor performance in preventing depression and deflation there was one brief episode when the Fed acted in an expansionary manner – in the spring of 1932. In April 1932, under pressure from Congress, the Fed began conducting large-scale open market operations. This episode that only lasted until July 1932 can be compared to the use of quantitative easing to alleviate the recent Great Recession. Unlike the recent experience, the economy had not yet reached the zero lower bound and most short-term rates were still above 2% (see figure 4). In its open market purchases, the Fed did not restrict its 8 purchases to short-term securities but bought government securities at all maturities up to 10 years. Figure 8. FED Credit Outstanding, M2, Bank Credit, IP and GDP; 1932 and 2008-2010 Source: FRED - Federal Reserve Bank of St. Louis According to Friedman and Schwartz (1963a) and Meltzer (2003) the policy, although unfortunately short-lived, did succeed in turning around the economy. M2 stopped declining and flattened out, the monetary base and Federal Reserve credit picked up as did bank credit (See figure 8).4 Also, industrial production and real GDP began expanding after Landon Lane (2013) examined the counterfactual effect of a policy like the LSAPs in the period after 1934 when short-term interest rates had reached the zero lower bound. He showed that had the Fed not followed its inactive policy but instead conducted bond purchases of comparable magnitude to those done between 2008 and 2012—as the recent Fed policy. This policy would have likely accelerated the Treasury driven recovery. 4 9 a lag. Interest rates reversed their rise and dropped like a stone. Unlike the recent LSAPs, the bond purchases were not locked up in the banks’ excess reserves. The Fed did not pay interest on reserves. By comparison, the recent LSAPs did not significantly increase the M2 money supply or bank credit and most were locked up in bank reserves by the spread of a bit less than 25 basis points between the interest on excess reserves and the federal funds rate. As a consequence, neither M2 nor bank lending increased much. And although the size of the purchases were much greater, long-term Treasury yields fell less than their counterparts in the 1930s. See figure 9. Figure 9. Changes in the 10-Year Treasury Bond Yield (in percentage points, difference between the interest rate during the last month of the program and the month previous to the program beginning) Source: FRED - Federal Reserve Bank of St. Louis There are many differences between the two cases but the comparison still seems relevant. The Fed’s LSAP policy of locking up reserves in the banking system tied at least one hand behind its back and prevented a monetary expansion which could have stimulated a faster recovery than did occur. 2.1 The 1940s The Great Contraction ended in March 1933 when the newly elected President Franklin Delano Roosevelt declared a one-week nationwide banking holiday during which bank examiners weeded out the insolvent banks. The institution of the Federal Deposit Insurance Corporation (FDIC) in 1934 solved the problem of panics. FDR also ended the link to the gold standard in April 1933 and later devalued the dollar by close to 60%. A rapid recovery and reflation from 1933 to 1936 was fueled by expansionary Treasury gold and silver purchases, and a rise in commodity prices. This was helped by the devaluation and by gold inflows induced by capital flight from Europe, which increased the money 10 supply (Romer 1992). The Federal Reserve, which continued to maintain its policy of inaction, had little to do with the recovery (Meltzer 2003). Rapid expansion in the monetary base and the money supply kept nominal interest rates low in the rest of the 1930s as well as real rates, with the exception of the recession of 1937-1938 (See figures 4, 5, 6 and 7). Beginning in the mid 1930s, the Fed became more and more subservient to Treasury policy and began to peg nominal interest rates at a low level to ensure high bond prices and facilitate the funding of Treasury debt (Meltzer 2003). After the start of World War II, in April 1942, the FOMC began pegging short-term Treasury bill rates at 3/8% by buying and selling at that rate. The peg was maintained until mid 1947 (Friedman and Schwartz 1963a p. 563). Long-term Treasuries were then pegged at 2.5%. These policies kept rates low until the end of the 1940s (See figures 4 and 5). Pegging interest rates below the natural rate of interest also turned the Federal Reserve into an engine of inflation. After price controls were removed in 1946, inflation became more and more of a problem. The Federal Reserve began a campaign to restore its independence to allow it to regain flexibility to use countercyclical monetary policy and to raise its policy rate to control the inflation that was building up at the beginning of the Korean War. This led to the Federal Reserve Treasury Accord of February 1951which restored Fed independence, normalized monetary policy and allowed interest rates to freely adjust, thus ending the era of very low interest rates. Figure 10. Federal Reserve Balance Sheet, 1920-1949 (Billions of US dollars) 50 45 40 35 30 25 20 15 10 5 Treasury Securities Non Treasury Securities 1948-07-01 1946-12-01 1945-05-01 1943-10-01 1942-03-01 1940-08-01 1939-01-01 1937-06-01 1935-11-01 1934-04-01 1932-09-01 1931-02-01 1929-07-01 1927-12-01 1926-05-01 1924-10-01 1923-03-01 1921-08-01 1920-01-01 0 Gold Source: FRED - Federal Reserve Bank of St. Louis 11 The Fed’s balance sheet mushroomed in this period as can be seen in Figure 10 (which in some ways is comparable to today except that the Fed was on the gold standard then and held huge gold reserves after Roosevelt devalued the dollar by close to 60% in 1934). The large holdings of U.S. government securities were sold off in subsequent decades as the Fed shifted to a “ bills only “ policy whereby it would only buy and sell short-term Treasury securities when it conducted monetary policy operations (Meltzer 2003). 3. The problems of leaving the low interest rate environment The low interest rate policies that were followed in the 1930s and 1940s were abandoned with the Federal Reserve Treasury Accord of 1951. Fed policy returned to normal in the 1950s. The key issues then were the threat of inflation and restoring the Fed’s independence from the Treasury. Today the issues are somewhat different. Fed credibility was not lost during the crisis but was likely compromised (Bordo 2014b, Goodfriend 2012). Low interest rates were not put in place to help the Treasury finance government expenditures and a war but to get out of a recession when the ZLB was reached. Many authors have argued that keeping rates low long after the recession ended has increasingly harmed the U.S. economy and that distortions that have arisen in financial markets and the real economy make a strong case for leaving the low interest rate environment as soon as possible. They argue for returning monetary policy back to a normal stance where the Fed’s policy rate operates the way it did during the Great Moderation, when policy rates were kept close to what an instrument rule like the Taylor Rule ( Taylor 1993) would indicate. Under this rule, the economy performed exceedingly well (Taylor 2012). Others have argued that that we are still stuck in an abnormally slow recovery and that to normalize rates prematurely would create another recession in analogy to the 1937-1938 recession when the Fed doubled reserve requirements and aborted for two years the recovery from the Great Contraction (Krugman 2014). The advocates for rapid normalization argue that keeping rates low for many years has created growing distortions in the U.S. economy. The first argument is that low interest rates discourage private saving, which impedes investment and economic growth. Moreover, low rates encourage savers (especially seniors) to seek higher yield investments and hence take on greater risk (McKinnon 2013). A second related argument is that low interest rates have led to a search for higher yields which has led to growing leverage in the financial sector and a greater possibility of generating asset price booms that might burst, thereby leading to another crisis and recession (Stein 2013, Fisher 2014). The third argument is exposure of the Fed’s balance sheet (which has greatly increased in maturity) 12 to the risk of capital losses as policy rates rise. This could also occur if the Fed raises the rate it pays the commercial banks on their excess reserves (IOER) as the way to manage its exit from low rates. This would increase the Fed’s funding costs (Christensen et al 2014). This raises the possibility of Fed insolvency and a rescue by the Treasury. It also raises the risk that the Fed will have to reduce the seigniorage that it pays to the Treasury. This would then increase the fiscal deficit and national debt. (Greenlaw et al 2013, Goodfriend 2014). A fourth argument is that low interest rates and low inflation can lead to a Japan-style deflationary trap (Bullard 2010, Benhabib Uribe and Schmitt Grohe 2009). The opponents of rapid normalization of monetary policy have argued that the U.S. economy is experiencing a slow economy that inevitably follows a serious financial crisis (a financial recession) (Reinhart and Rogoff 2009, Taylor 2014). The recovery since the recession ended in June 2009 has been exceedingly slow (at least until recently). Growth rates of real GDP have hovered in the two to three percent range. This view, which is based on cross country comparisons of many countries over long periods, argues that severe financial crises like 2007-2008 are often preceded by credit fueled asset price booms that bust leading to a crisis and recession. The imbalances and excessive leverage that builds up in the boom leading to an inevitable bust requires many years of adjustment involving reduced investment and rebuilding of financial portfolios. Continued expansionary monetary and fiscal policy would aid this regenerative process. Figure 11. Recovery strength against contraction amplitude Source: Bordo and Haubrich (2013) 13 An alternative view for the U.S. experience has been proposed by Bordo and Haubrich (2012) and by Romer and Romer (2014). Bordo and Haubrich examined the historical record of U.S. recoveries since 1880. They found that recoveries from serious recessions (bounce backs) were actually more rapid than recoveries from mild recessions. This pattern is even more pronounced in the case of recessions associated with financial crises. See figure 11, which plots the strength of the recovery against the depth of the recession, separately identifying crisis and non- crisis cycles. The figure clearly shows that in crisis periods, strong recoveries follow deep recessions, but outside of a crisis they do not. Furthermore, their evidence suggests that the slow recovery from the recent financial recession was most unusual. Their explanation for the slow recovery was the collapse of the housing market. Other factors that could explain it include increased policy uncertainty that impeded investment (Bloom 2014). More recently Romer and Romer (2014) found similar results to Bordo and Haubrich (2012). Based on a cross-country panel of OECD countries since 1967 they find that the pattern of recoveries from financial recession is very heterogeneous, but that on average they are not particularly long. A country that has had a slow recovery for over fifteen years after its financial recession is Japan. Including it in the comparison, as others have done, biases the case for the argument that financial recessions lead to slow recoveries. 4. Returning to Normal Monetary Policy The recovery has been picking up speed over the past two years. See figure 12, which shows the growth of real GDP, industrial production, and the unemployment rate from 2000 to 2014. As can be seen, unemployment has dropped well below 6% and the activity growth rates are rising. Figure 13 shows evidence that wage inflation, which is one of the variables the Fed looks at as a predictor of future inflation is rising (Slok 2014). Figure 12. GDP, IP growth rates and Unemployment, 2000-2014 (left axis: GDP, unemployment; right axis: IP) 12.0 15.0 10.0 10.0 8.0 6.0 5.0 4.0 0.0 2.0 -5.0 0.0 -2.0 -10.0 -4.0 -15.0 -6.0 -20.0 -8.0 Real Gross Domestic Product 2014-01-01 2013-06-01 2012-11-01 2012-04-01 2011-09-01 2011-02-01 2010-07-01 2009-12-01 2009-05-01 2008-10-01 2008-03-01 2007-08-01 2007-01-01 2006-06-01 2005-11-01 2005-04-01 2004-09-01 2004-02-01 2003-07-01 2002-12-01 2002-05-01 2001-10-01 2001-03-01 2000-08-01 -25.0 2000-01-01 -10.0 Civilian Unemployment Rate Industrial Production Index (secondary axis) Source: FRED - Federal Reserve Bank of St. Louis 14 Figure 13. Wage inflation Source: Deutsche Bank Figure 14. M2 growth rate, headline inflation and core inflation, 2001-2014 (moving average of M2 growth rate in the right axis, annual change in CPI) 12 6 5 10 4 8 3 6 2 1 4 0 2 -1 0 2013-08-01 Core Inflation Inflation FED's inflation target M2 Growth MA (last 4 quarters) 2014-03-01 2012-06-01 2013-01-01 2011-04-01 2011-11-01 2010-02-01 2010-09-01 2008-12-01 2009-07-01 2007-10-01 2008-05-01 2006-08-01 2007-03-01 2005-06-01 2006-01-01 2004-04-01 2004-11-01 2003-02-01 2003-09-01 2001-12-01 2002-07-01 2000-10-01 2001-05-01 -2 Source: FRED - Federal Reserve Bank of St. Louis Figure 14 shows the growth rates of broad money and the rate of CPI inflation.5 As can be seen, money growth has picked up since 2010 and M2 velocity (not shown), which had Broad money growth has often been viewed as a good predictor of future inflation and broad money growth is one of the two pillars of the ECBs approach to monetary policy (Issing. 2002) 5 15 been falling in the crisis and recession, is beginning to turn around.6 The behavior of money and velocity during the crisis, and recession and now recovery has some resonance to what happened in the late 1930s and the 40s when it recovered after falling sharply during the Great Contraction. Velocity, which is the inverse of people’s desired holdings of cash balances, tends to drop when economic uncertainty is rising (as in a bad recession and banking crisis) (Friedman and Schwartz 1963a). Also, inflation is slowly rising towards the Fed’s two percent target (but likely reduced by the recent decline in oil and other commodity prices). In addition, there are indicators that wage inflation, which is one of the variables the Fed looks at as predictors of future inflation, is building up (Slok 2014). Figure 15. Federal Funds Rate, Taylor Rule Rate and Shadow Federal Funds Rate Finally, figure 15 compares the Taylor rule (an instrument rule that captures the Fed’s reaction function, Taylor 1993) with the actual Federal Funds rate from 2000 to 2014 using quarterly data. It sets the policy rate based on a measure of the equilibrium (natural) real rate of interest and a weighted average of the deviation of the GDP deflator from the Fed’s inflation target and the deviation of real growth from the growth of potential output7. Figure 15 also shows the shadow policy rate as measured by Wu and Xia (2014). The shadow policy rate is based on an algorithm that translates purchases of securities in QE It would be rising much faster , as occurred after the Great Contraction except that the Dodd Frank Bill has encouraged greater money holding than otherwise would have been the case (Bordo, Duca and Anderson 2014) 7 This calculation assumes that the real funds rate is 2% and real potential GDP is from the CBO using billions of chained 2009 dollars. 6 16 into percentage changes in the federal funds rate (FFR)8. As can be seen, the Taylor Rule rate in recent years has been well above the zero bound FFR. This suggests that present policy is still too loose. In addition the shadow policy rate is still very negative, also indicating a loose monetary policy stance. All of these indicators point in the direction of a possible inflationary overshoot and a growing risk that the Fed, as it has often done in the past, will wait too long before raising rates (Bordo and Landon Lane 2012). For these reasons, it is time for the Fed to soon begin raising its policy rate and to restore normal monetary policy. However, because of the issues of the Fed’s large balance mentioned above, the exit strategy need not be executed using classic short-term interest rate tightening. Some economists argue that with the Fed balance sheet currently so large, raising the interest rate on commercial banks reserves and not reducing the balance sheet would be a better way to revert to normal conditions (Cochrane 2014).9 Nevertheless some experts argue that there are still signs of weakness in the labor market including the employment rate and the labor force participation rate, which are lower than, has been the case in other recoveries. This evidence is used to make the case that that raising rates should be postponed (Kocherlakota 2014.). What is not clear from the labor market evidence however is how much these effects are due to long-run structural changes such as globalization, new technologies, and long simmering defects in the U.S. education system, and how much are due to a short-fall in aggregate demand. 5. The Domestic Consequences of returning to normal monetary policy When the Fed starts raising its policy rate and exiting from its present state of monetary ease there will likely be significant consequences for the domestic economy. Some will be perceived as beneficial. Others will not be. First, as rates rise many of the distortions to the financial markets, which were discussed above, will be removed. The incentives for the build up of leverage leading to potential asset price boom busts will be less and hence financial stability will be improved. But in the Their empirical approach was to assume that QE worked to hold long term rates down , and then to back out the shadow short term rate from the term structure. Their findings thus would lead to a greater stimulus from QE than many of the other studies. 8 Some economists argue in favor of a “new normal” in which the policy rate would be raised to a lower level than before the crisis, e.g. 2.5% compared to 4.5%. This argument is based on the assumptions that long-run potential growth has permanently declined and hence so has the natural or equilibrium real interest rate. One prominent argument along these lines is by Summers (2013) who argued that the U.S. is in a state of secular stagnation, as Alvin Hansen (1939) posited for the U.S. economy in 1939. In a trenchant critique of Hansen, Fogel (2006) showed that there was no evidence for the secular stagnation thesis. Also see John Taylor, “The Economic Hokum of Secular Stagnation,” Wall Street Journal, January 1, 2014. 9 17 short term, there is a risk that tightening could lead to a stock market crash which could possibly have serious effects on the real economy. Second, rising rates will be beneficial to savers and hence to long-term investment and economic growth. This will benefit retirees and those on fixed incomes. But those who have variable rate mortgages and outstanding credit card debt will be paying more to service their debts. Rising rates (to the extent that they are unanticipated) will likely affect the distribution of income shifting resources from debtors to creditors. This will most likely provide fuel for the fire in the vociferous debate over income inequality. Third, rising rates will have significant consequences for public finance. For the federal government, rising rates will increase the servicing costs of the government’s debt. It will also increase the budget deficit. Higher debt servicing and greater fiscal deficits will reawaken the long-running debate over fiscal balance that had been put on the back burner in recent years, in part because low interest rates reduced fiscal burdens. As the population ages the costs of existing and future entitlements will rise leading to larger deficits and to a higher debt GDP ratio. This raises the issue of long run fiscal sustainability. As the fiscal imbalance grows, to prevent a default, either taxes will have to be raised or expenditures reduced. The entitlements of social security, Medicare, and now the Affordable Care Act will need to be addressed and possibly reduced. This will lead to renewed political rancor. In addition, higher rates will affect state and local governments whose debt servicing and borrowing costs will rise. This will have implications for existing obligations to pensions and the provision of public goods. It will also lead to political rancor. In sum, returning to normal will improve financial stability, the efficiency of financial intermediation and resource allocation. But there will be short run costs of adjustment to the distribution of income and public finances, both of which have been distorted by the years of unusual low rates. 6. The Rest of the World Fed tightening will most definitely have significant effects on the rest of the world. It will likely have significant effects on emerging market economies, especially those that have been borrowing in dollars. Indeed, there may be some resonance to the 1994 inflation scare in which the Fed suddenly tightened to head off indications that inflation expectations were set to rise (Goodfriend 1992). This led to the Tequila crisis. 18 Yet this outcome today may be considerably muted because many emerging market economies have their external debt denominated in local currencies and because they are less exposed to maturity mismatches than they were 20 years ago. Moreover, they have adopted sound money policies, especially inflation targeting, which have given them a credible nominal anchor (Mishkin and Schmidt Hebel, 2007). In many cases, they have also improved their fiscal balances (with some major exceptions like Argentina and Venezuela). These improvements in the policy framework will protect than from a putative interest rate shock. Finally, the Fed tightening when the Eurozone, Japan, and China are in states of recession or slowing growth which requires a looser monetary policy stance will likely increase volatility in foreign exchange markets and create new sources of global imbalance. Floating exchange rates between the major currencies, as in recent decades, should continue to facilitate adjustment to most sources of imbalance.10 7. Conclusion The United States has recovered from a serious recession and financial crisis. A disaster akin to 1929 to 1933 was avoided by expansionary Federal Reserve (and Treasury) policies. These policies left the economy with a legacy of low nominal interest rates, last seen 70 years ago. The motivation for the recent low interest rate was quite different from that of the 1930s and 1940s when the Federal Reserve was subservient to Treasury policy and the key motivation for the low interest rate peg was to fund the Treasury’s debt at low interest rates. The recent rationale for low rates (and once the ZLB set in) for QE was to facilitate economic recovery. In late 2014, after six years of an abnormally slow recovery, much evidence points toward a more normal and robust economic future. In this new environment, I argue that it is time for the Fed to start raising its policy rate (or the rate on excess reserves) to return to a more normal, rules-based policy such as existed in the two decades of the Great Moderation before the crisis of 2007-2008. Returning to normal will be beneficial for the stability and efficiency of the financial sector and will encourage long-run growth. But in the short-run, there will likely be effects on the distribution of income and the state of public finance, which will lead to political rancor. It also may make the case for monetary policy coordination to deal with the spillover effects of divergent interest rate policies (see Taylor 2014). 10 19 References Peter F. Basile, John Landon Lane, and Hugh Rockoff (2010), ”Money and Interest Rates in the United States during the Great Depression States,” NBER Working Paper 16204, July 2010. Ben Bernanke (2012), The Federal Reserve and the Financial Crisis, Princeton, NJ: Princeton University Press. Alan Blinder (2013), After the Music Stopped: The Financial Crisis, the Response, and the Work Ahead, New York: Penguin. Nicholas Bloom (2014), “ Fluctuations in Uncertainty,” Journal of Economic Perspectives, Vol. 28, No. 2. Spring, pp. 153-176. Michael D. Bordo (2014a), “The Federal Reserve’s Role: Actions Before, During, and After the 2008 Panic in the Historical Context of the Great Contraction,” Chapter 2 in Martin Baily and John B. Taylor (eds.), Across the Great Divide: New Perspectives on the Financial Crisis, Stanford, CA: Hoover Institution Press. Michael D. Bordo (2014b), “The Federal Reserve as a Lender of Last Resort: An Historical Perspective,” in Michael D. Bordo, William Dupour, and John Taylor (eds.), Framework for Central Banking in the Next Century on the Occasion of the Centennial of the Federal Reserve, Special Issue of the Journal of Economic Dynamics and Control, December 2014, pp. 125-134. Michael Bordo, John Duca, and Richard Anderson (2014),“ Money and Velocity During Financial Crises: from the Great Depression to the Great Recession,” Federal Reserve Bank of Dallas (mimeo). Michael Bordo and Joseph Haubrich (2012), “Deep Recessions, Fast Recoveries and Financial Crises,” NBER Working paper 18194. Michael D. Bordo and John Landon Lane (2013), “Exits from Recessions: The US Experience, 1920-2007,” in Vincent R. Reinhart (ed.), No Way Out: Persistent Government Interventions in the Great Contraction, Washington, DC: AEI Press. Michael Bordo and David Wheelock (2013), “The Promise and Performance of the Federal Reserve as Lender of Last Resort, 1914-1933,” in Michael Bordo and William Roberds (eds.), The Origins, History, and Future of the Federal Reserve: A Return to Jekyll Island, New York: Cambridge University Press. Karl Brunner and Allan Meltzer (1973), “Mr. Hicks and the ‘Monetarists’,“ Economica 40 (157): pp. 44-59. Karl Brunner and Allan Meltzer (1968), “Liquidity Traps for Money, Bank Credit, and Interest Rates,” Journal of Political Economy, Vol. 76. No 1., January/February, James Bullard (2010), “Seven Faces of ‘The Peril’,” Federal Reserve Bank of St. Louis Review, September/October 92(5), pp. 339-52. Stephan Cecchetti, Pok Sang Lam, and Nelson Mark (1992), “The Case of the Negative Nominal Interest Rates in the 1930s; New Estimates of the Term Structure of Interest 20 Rates During the Great Depression,” Journal of Political Economy Vol. 9696, December, pp. 1111-41. John Cochrane (2014), “Monetary Policy with Interest on Reserves,” Journal of Dynamics and Economic Control, Special Issue: “Frameworks for Central Banking in the Next Century on the Occasion of the Founding of the Federal Reserve.” Guest Editors: Michael D. Bordo, William Dupour, and John B. Taylor, December. Jens H.E. Christensen, Jose Lopez. and Glenn D. Rudebusch (2014), “A Probability-Based Stress Test of Federal Reserve Assets and Income,” Carnegie Rochester Conference, November. Barry Eichengreen (1992), Golden Fetters: The Gold Standard and the Great Depression, 1919-1939, New York: Oxford University Press. Richard Fisher (2014), “R.I.P. QE.3… Or Will It?” Remarks before the Shadow Open Market Committee,“ Manhattan Institute, November 3, 2014. Robert Fogel (2005), “Reconsidering Expectations of Economic Growth after World War II from the Perspective of 2004,” IMF Staff Papers, Vol 52, Special Issue, pp. 6-14. Milton Friedman and Anna J. Schwartz (1963a), A Monetary History of the United States, 1867 to 1960, Princeton, NJ: Princeton University Press. Milton Friedman and Anna J. Schwartz (1963b), “Money and Business Cycles,” Supplement, Review of Economics and Statistics 45(1): pp. 32-64. Timothy Geithner (2014), Stress Test: Reflections on Financial Crises, New York: Crown Publishers. Marvin Goodfriend (2014), “Lessons from a Century of Fed Policy: Why Monetary and Credit Policies Need Rules and Boundaries,” Journal of Economic Dynamics and Control, Special Issue: “Frameworks for Central Banking in the Next Century on the Occasion of the Centennial of the Founding of the Federal Reserve,” December. Marvin Goodfriend (2012), “The Elusive Promise of Independent Central Banking,” Bank of Japan Institute for Monetary and Economic Studies. Marvin Goodfriend (1993), “Interest Rate Policy and the Inflation Scare Problem: 19791992,” Federal Reserve Bank of Richmond Economic Quarterly 79/1, Winter 1992. David Greenlaw, James D. Hamilton, Peter Hooper, and Frederic Mishkin (2013), “Crunch Time: Fiscal Crises and the Role of Monetary Policy,” NBER Working Paper 19297, August. James Hamilton (1992), “Was the Deflation During the Great Depression Anticipated?” American Economic Review, Vol. 82, Issue 1, pp. 157-78. Alvin Hansen (1939), “Economic Progress and Declining Population Growth,” American Economic Review, Vol 29, March. Otmar Issing (2002), “Monetary Policy in a Changing Economic Environment,” Federal Reserve Bank of Kansas City Economic Review, Fourth Quarter. John Maynard Keynes (1936), The General Theory of Employment, Interest and Money, London: MacMillan. 21 Narayana Kocherlakota (2014), “Clarifying the Objectives of Monetary Policy,” Speech in Minneapolis, November 18. Arvind Krishnamurthy and Annette Vissing-Jorgensen (2011), “The Effects of Quantitative Easing on Interests: Channels and Implications for Policy,” Brookings Papers on Economic Activity, Fall. Arvind Krishnamurthy and Annette Vissing-Jorgensen (2013), “The Ins and Outs of LSAPS,” Federal Reserve Bank of Kansas City, Jackson Hole Economic Policy Symposium, “Global Dimensions of Unconventional Monetary Policy,” August. Paul Krugman (2014), “Rock Bottom Economics: The Inflation and Rising Interest Rate That Never Showed Up,” New York Times, November 23. John Landon Lane (2015), “Would Large Scale Asset Purchases Have Helped in the 1930s? An Investigation of the Responsiveness of Bond Yields from the 1930s to Changes in Debt Levels,” in Owen Humpage, Current Economic Policy Under the Lens of Economic History: Essays to Commemorate the Federal Reserve’s Centennial, New York: Cambridge University Press (in press). Ronald McKinnon (2013), “The Near-Zero Interest Rate Trap,” Wall Street Journal, July 29, 2013. Allan Meltzer (2003), A History of the Federal Reserve, Vol. 1:1913 to 1951, Chicago: University of Chicago Press. Frederic Mishkin and Klaus Schmidt-Hebbel (2007), “Does Inflation Targeting Make a Difference?” in F.S. Mishkin and K. Schmidt-Kebbel (eds.), Monetary Policy Under Inflation Targeting, Santiago: Banco de Chile, pp. 291-332. Athanasios Orphanides (2004), “Monetary Policy in Deflation: The Liquidity Trap in History and Practice,” North American Journal of Economics and Finance. Carmen Reinhart and Kenneth Rogoff (2009), This Time Is Different: Eight Centuries of Financial Folly, Princeton, NJ: Princeton University Press. Christina Romer and David Romer (2014), “New Evidence on the Impact of Financial Crises in Advanced Countries,” UC-Berkeley (mimeo). Christina Romer and David Romer (2013), “The Missing Transmission Mechanism in the Monetary Explanation of the Great Depression,” American Economic Association Papers and Proceedings, American Economic Review, Vol. 1633 (May), pp. 61-72. Christina Romer (1992), “ What Ended the Great Depression?” Journal of Economic History 52 (4). Stephanie Schmitt-Grohe and Martin Uribe (2009), “Liquidity Traps with Global Taylor Rules,” International Journal of Economic Theory, 5(1), pp. 85-106. Jeremy Stein (2013), “Overheating in Credit Markets: Origins, Measurement, and Policy Responses,” Board of Governors of the Federal Reserve, February 7. Torsten Slok (2014), “Labor Market Chart Book,” Deutsche Bank Research. 22 Johannes Stroebel and John B. Taylor (2012), “Estimated Impact of the Federal Reserve’s Mortgage-Backed Securities Purchase Program,” International Journal of Central Banking 8 (2): pp. 1-42. Lawrence Summers (2014), “Secular Stagnation, Hysteresis and the Zero Lower Bound,” Business Economics, Vol 49 No. 2. Alan Taylor (2014), “Credit and Financial Stability,” UC-Davis (mimeo). John B. Taylor (2014b), “The Federal Reserve in a Globalized Economy,” Federal Reserve Bank of Dallas Conference, “The Federal Reserve’s Role in the Global Economy,” September 19. John B. Taylor (2014a), “Causes of the Financial Crisis and the Slow Recovery: A TenYear Perspective,” in Martin Baily and John B. Taylor (eds.), Across the Divide: New Perspectives on the Financial Crisis, Stanford, CA: Hoover Institution Press. John B. Taylor (2012), “Monetary Policy Rules Work and Discretion Doesn’t: A Tale of Two Eras,“ Journal of Money, Credit and Banking, September. John B. Taylor (1993), “Discretion versus Policy Rules in Practice,” Carnegie Rochester Series on Public Policy 39, pp. 195-214. Peter Temin (1989), Lessons from the Great Depression, Cambridge, MA: MIT Press. James Tobin (1969), “A General Equilibrium Approach to Monetary Theory,” Journal of Money, Credit and Banking 1(1): pp. 15-29. Michael Woodford (2012), “Methods of Policy Accommodation at the Interest Rate Lower Bound,” Economic Policy Symposium: The Changing Policy Landscape, Federal Reserve Bank of Kansas City, Jackson Hole August. Jing Cynthia Wu and Fan Dora Xia (2014), “Measuring the Macroeconomic Impact of Monetary Policy at the Zero Lower Bound,” Working Paper, Federal Reserve Bank of Atlanta, February. 23


© Copyright 2026