
Tobacco Strategy - NSW Health
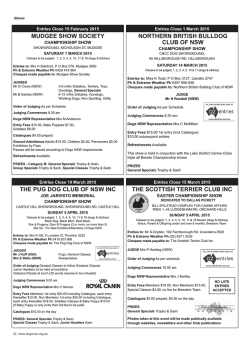
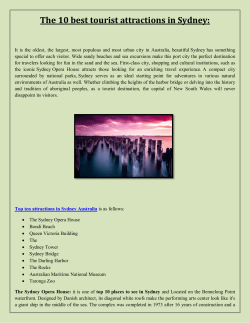
Report of the
New South Wales Chief Health
Officer
Health-related behaviours
Illness attributable to smoking
by local government area
Smoking attributed hospital separations by local government area,
NSW 2003-04 to 2004-05
-
-
NCAHS
+
+
+
HNEAHS
+
+
+
+
+
+
+
+
+ +
+
+
+
+
+
+
+
GSAHS
+
+
-
+
+
- NSCCAHS
+
+
+
SSWAHS
+
+ +
+
+
+SWAHS
+
+
+
+
+
+
-
+
+
+
-
+
+
Sydney Local Government Areas
SESIAHS
NSCCAHS
+
SWAHS
+
-
-
+
-
-
-
+
+
-
+
>2.0
>1.5-2.0
>1.35-1.5
>1.15-1.35
>1.05-1.15
>0.95-1.05
>0.85-0.95
>0.65-0.85
>0.5-0.65
<=0.5
+
+
+
+
SSR Ranges
+
+
+
+
+
+
+
+
+
+
+
+
+
+
GWAHS
-
+
+
+
+
+
+
+
-
+
- -- - - - - + -- - - - +
-
-
+
+
-
-
-
+
+
-
SESIAHS
SSWAHS
- Significantly lower than state average, + Significantly higher than state average
Smoking attributed hospital separations by local government area, NSW 2003-04 to
2004-05
Health Area
LGA of
Residence
Sydney South
Ashfield
West AHS
Smoothed
Smoothed
Lower
Upper
Significantly
Number Estimate of
95%
95%
Higher or
of Standardised credible credible
Lower
Hospitalisationa Separation interval interval
than State
per Year
Ratio for sSSR for sSSR
231
65.3
59.6
71.3
--
Bankstown
Burwood
Camden
Campbelltown
Canada Bay
Canterbury
Fairfield
Leichhardt
Liverpool
Marrickville
Strathfield
Sydney
Wingecarribee
Wollondilly
South Eastern
Botany Bay
Sydney &
Illawarra AHS
Hurstville
Kiama
Kogarah
Randwick
Rockdale
Shellharbour
Shoalhaven
Sutherland Shire
Sydney
Waverley
Wollongong
Woollahra
Sydney West
Auburn
AHS
Baulkham Hills
Blacktown
Blue Mountains
Hawkesbury
Holroyd
Lithgow
Parramatta
Penrith
Northern
Sydney &
Gosford
Central Coast
AHS
Hornsby
Hunter's Hill
Ku-ring-gai
Lane Cove
Manly
Mosman
North Sydney
Pittwater
Ryde
Warringah
Willoughby
1403
206
373
1089
391
1046
1270
289
1097
514
186
992
415
299
95.3
77.4
121.9
122.4
68.7
93.7
94.4
62.8
109.1
93.0
73.5
117.6
100.1
113.2
92.0
70.1
113.6
117.3
64.0
89.5
90.8
57.9
104.5
87.5
66.3
112.3
93.3
104.3
99.0
85.1
130.6
127.7
73.5
97.7
98.0
68.0
113.8
98.5
81.1
122.9
107.0
122.5
-++
++
----++
-++
0
++
362
113.2
104.7
121.8
++
508
198
348
1018
683
573
1159
1547
992
471
1931
391
74.3
99.1
72.9
99.3
78.9
124.7
120.7
88.9
117.6
90.5
115.5
78.5
69.7
89.4
67.5
95.0
75.0
117.8
115.8
85.8
112.3
84.8
111.8
73.0
79.0
109.1
78.6
103.6
82.9
131.6
125.7
92.2
122.9
96.4
119.3
84.0
-0
-0
-++
++
-++
-++
--
409
95.6
89.1
101.9
0
792
2255
527
404
758
268
1006
1239
73.0
132.1
81.7
96.4
106.9
151.0
84.7
113.6
69.5
128.2
76.7
90.0
101.5
138.1
81.1
109.5
76.6
136.1
86.5
103.0
112.2
164.5
88.4
118.2
-++
-0
+
++
-++
1491
93.4
90.1
97.0
--
835
85
592
186
289
169
315
385
641
1070
318
65.6
63.6
57.5
68.8
84.2
66.9
65.3
75.5
74.1
86.8
60.1
62.5
54.6
54.3
61.8
77.6
60.1
60.2
70.2
70.2
83.2
55.7
68.6
73.3
60.8
75.8
90.9
74.2
70.5
80.7
78.3
90.4
64.8
------------
Wyong
Hunter & New Armidale
England AHS Dumaresq
Barraba
Bingara
Cessnock
Dungog
Glen Innes
Gloucester
Great Lakes
Greater Taree
Gunnedah
Guyra
Inverell
Lake Macquarie
Maitland
Manilla
Merriwa
Moree Plains
Murrurundi
Muswellbrook
Narrabri
Newcastle
Nundle
Parry
Port Stephens
Quirindi
Scone
Severn
Singleton
Tamworth
Tenterfield
Uralla
Walcha
Yallaroi
North Coast
Ballina
AHS
Bellingen
Byron
Clarence Valley
Coffs Harbour
Hastings
Kempsey
Kyogle
Lismore
Nambucca
Richmond Valley
Tweed
Greater
Albury
Southern AHS
Bega Valley
Berrigan
Bland
Bombala
1853
136.7
132.4
141.1
++
193
103.9
94.0
114.3
0
41
29
505
61
81
59
413
547
133
54
166
1664
522
50
23
174
25
134
159
1158
15
100
528
45
95
28
164
412
61
43
41
58
152.9
116.7
125.7
79.7
126.9
107.7
95.3
116.9
117.3
130.6
109.2
94.8
116.8
141.7
96.2
160.4
114.0
124.6
132.9
87.4
112.0
90.3
94.6
89.0
113.6
101.8
110.4
128.1
88.4
83.3
130.3
207.8
124.2
89.2
117.6
67.2
108.8
89.2
89.2
110.5
103.6
107.4
97.8
91.7
109.8
115.8
72.3
144.9
86.9
110.5
118.6
83.8
80.5
77.7
88.8
71.8
97.4
79.0
98.9
119.3
73.3
67.3
105.9
173.0
188.2
146.8
133.6
93.7
147.2
126.6
101.9
123.7
131.8
155.1
121.2
98.0
123.9
170.1
123.7
177.0
146.2
138.8
147.5
90.8
149.6
103.2
100.4
107.8
130.2
128.4
122.3
136.9
104.8
100.7
156.5
245.9
++
0
++
-++
0
0
++
++
++
0
-++
++
0
++
0
++
++
-0
0
0
0
0
0
0
++
0
0
+
++
323
78.8
72.9
84.4
--
161
175
601
676
786
386
95
313
235
232
654
127.4
71.5
120.3
111.7
99.7
142.4
108.4
88.5
114.7
114.2
74.8
114.4
64.4
113.3
105.9
94.9
132.6
94.0
81.6
104.3
104.1
70.7
141.4
79.0
127.1
117.7
104.4
152.2
123.4
95.8
125.3
124.5
79.1
++
-++
++
0
++
0
-++
++
--
363
98.3
91.3
105.9
0
318
151
132
41
98.7
170.5
209.2
153.0
91.3
152.2
186.3
122.9
106.2
189.5
234.1
186.1
0
++
++
++
Boorowa
Carrathool
Conargo
Coolamon
Cooma-Monaro
Cootamundra
Corowa
Culcairn
Deniliquin
Eurobodalla
Goulburn
Mulwaree
Griffith
Gundagai
Harden
Hay
Holbrook
Hume
Jerilderie
Junee
Leeton
Lockhart
Murray
Murrumbidgee
Narrandera
Palerang
Queanbeyan
Snowy River
Temora
Tumbarumba
Tumut
Upper Lachlan
Urana
Wagga Wagga
Wakool
Yass Valley
Young
Greater
Balranald
Western AHS
Bathurst
Blayney
Bogan
Bourke
Brewarrina
Broken Hill
Cabonne
Central Darling
Cobar
Coolah
Coonabarabran
Coonamble
Cowra
Dubbo
29
44
9
61
82
134
121
53
121
429
119.8
171.3
65.6
158.1
89.5
173.4
125.3
129.2
153.9
103.9
93.3
138.4
43.7
132.1
76.3
153.6
110.6
106.5
135.4
97.5
150.0
206.3
93.3
186.9
103.6
193.9
141.2
153.2
174.0
110.7
0
++
++
0
++
++
+
++
0
253
105.4
96.8
114.5
0
217
74
64
68
27
47
19
104
126
51
55
38
164
55
159
37
106
55
202
97
23
584
57
98
148
112.3
207.5
168.0
217.3
107.7
74.4
117.8
220.9
134.0
152.2
86.7
188.7
256.1
63.7
66.3
64.8
168.4
151.4
192.3
128.3
177.4
134.0
121.4
93.9
131.9
102.3
175.9
142.4
183.9
82.6
60.9
85.6
193.6
118.2
125.7
71.7
150.7
230.4
52.7
59.8
50.6
146.5
125.0
175.5
111.8
134.7
126.6
100.9
81.2
116.8
122.7
240.8
195.4
251.8
137.1
89.5
156.5
251.3
150.9
181.9
103.5
231.2
285.3
75.4
73.5
80.1
190.7
178.3
211.1
145.6
227.0
142.0
143.9
106.8
147.4
+
++
++
++
0
-0
++
++
++
0
++
++
---++
++
++
++
++
++
+
0
++
34
157.5
123.4
195.1
++
273
74
45
35
36
234
118
23
71
48
128
78
137
403
114.7
127.8
163.4
137.1
260.6
112.8
98.3
118.6
204.0
120.7
188.7
193.2
105.3
136.4
105.0
108.6
133.3
109.2
205.7
103.3
86.9
90.5
172.4
99.0
166.9
164.2
93.5
127.5
125.0
147.9
197.2
168.7
321.3
123.2
110.6
151.7
237.8
145.0
212.6
226.1
118.5
146.3
++
++
++
++
++
+
0
0
++
0
++
++
0
++
Evans
Forbes
Gilgandra
Lachlan
Mudgee
Narromine
Oberon
Orange
Parkes
Rylstone
Unincorporated
Far West
Walgett
Warren
Weddin
Wellington
Wentworth
Note:
37
102
88
129
213
72
51
338
185
57
83.7
107.6
192.2
192.3
129.2
120.9
124.1
110.8
135.3
134.3
66.7
92.9
166.0
169.8
117.7
102.8
102.6
102.5
122.0
110.6
101.8
122.3
220.6
216.9
141.9
140.6
148.2
119.3
149.0
158.7
0
0
++
++
++
+
+
+
++
++
*
61.8
35.5
97.0
-
132
60
47
130
36
201.3
222.7
115.3
148.3
59.1
178.4
184.2
92.6
130.7
47.7
225.4
262.6
139.5
166.9
72.3
++
++
0
++
--
Numbers for the latest year include an estimate of the small number of interstate
hospitalisations of NSW residents, data for which were unavailable at the time of production.
Hospital separations were classified using ICD-10-AM. Indirect age and sex standardisation
was used to calculate standardised incidence ratios, and then Bayesian smoothing was used to
calculate the smoothed ratios (see Methods). * indicates figures not provided when based on
fewer than 5 cases.
Source: Australian Institute of Health and Welfare (aetiologic fractions), 2001. NSW Inpatient
Statistics Collection data and ABS population estimates (HOIST). Centre for Epidemiology
and Research, NSW Department of Health.
Tobacco smoking was responsible for 8% of the total burden of disease in Australia in
2003, with lung cancer, chronic obstructive pulmonary disease, and ischaemic heart
disease accounting for more than three-quarters of this burden (Begg et al., in press).
The tangible social costs of tobacco use in Australia were estimated to be $7.6 billion
in 1998-99, or about 2.3% of the gross domestic product (AIHW, 2006).
The data presented here were derived by applying aetiologic fractions (the probability
that a particular case of illness or death was caused by smoking) to death and hospital
morbidity data for NSW.
An average of approximately 54,840 hospitalisations per year could be attributed to
smoking over the five years. This equates to a crude rate of approximately 830 per
100,000 population. Between 10 and 2,270 hospitalisations occurred per year in
individual LGAs due to illness associated with smoking.
The smoothed Standardised Separation Ratio (sSSR, see Methods) for each LGA can
be interpreted as a 'relative risk', and compared to the NSW average which is set to
100. The sSSR for hospitalisations attributed to smoking-related disease in NSW
ranged from 58 (Ku-ring-gai LGA) to 261 (Brewarrina LGA). LGAs with more than
double the risk of the state average were Brewarrina, Narrandera, Warren, Junee, Hay,
Bland, Yallaroi, Gundagai, Cobar and Walgett LGAs. Most of these LGAs are within
the Greater Western and Greater Southern health areas, and are areas of
socioeconomic disadvantage. LGAs with a sSSR due to smoking-attributable disease
which where less than 65% of the state average were ku-ring-gai, Wentworth,
Willoughby, Unicorporated Far West, Leichhardt, Hunters Hill, Palerang and Snowy
River.
For more
information:
Ridolfo B, Stevenson C. The quantification of drug-caused mortality and morbidity in
Australia, 1998. Canberra: Australian Institute of Health and Welfare, 2001. Available
at www.aihw.gov.au
U.S. Department of Health and Human Services. The Health Consequences of
Smoking: A Report of the Surgeon General. Atlanta, GA: U.S. Department of Health
and Human Services, Centers for Disease Control and Prevention, National Center for
Chronic Disease Prevention and Health Promotion, Office on Smoking and Health,
2004.
Ridolfo B, Stevenson C. The quantification of drug caused morbidity and mortality in
Australia, 1998. Canberra: Australian Institute of Health and Welfare, 2001.
Copyright
notice:
This work is copyright NSW Department of Health, 2006. It may be reproduced in
whole or in part, subject to the inclusion of an acknowledgement of the source.
Commercial usage or sale is prohibited.
Suggested
citation:
Population Health Division. The health of the people of New South Wales - Report of
the Chief Health Officer. Sydney: NSW Department of Health. Available at:
http://www.health.nsw.gov.au/public-health/chorep/beh/beh_smoafhos_lgamap.htm.
Accessed (insert date of access).
Produced by: Centre for Epidemiology and Research, Population Health Division, NSW Department
of Health.
Last updated 7 November 2006
on:


© Copyright 2026