
Applications of Gauge/Gravity Duality in Heavy Ion
Applications of Gauge/Gravity Duality in Heavy
Ion Collisions
by
Di-Lun Yang
Department of Physics
Duke University
Date:
Approved:
Berndt M¨
uller, Supervisor
Steffen Bass
Ashutosh Kotwal
Jian-Guo Liu
Thomas Mehen
Dissertation submitted in partial fulfillment of the requirements for the degree of
Doctor of Philosophy in the Department of Physics
in the Graduate School of Duke University
2014
Abstract
Applications of Gauge/Gravity Duality in Heavy Ion
Collisions
by
Di-Lun Yang
Department of Physics
Duke University
Date:
Approved:
Berndt M¨
uller, Supervisor
Steffen Bass
Ashutosh Kotwal
Jian-Guo Liu
Thomas Mehen
An abstract of a dissertation submitted in partial fulfillment of the requirements for
the degree of Doctor of Philosophy in the Department of Physics
in the Graduate School of Duke University
2014
Copyright c 2014 by Di-Lun Yang
All rights reserved except the rights granted by the
Creative Commons Attribution-Noncommercial Licence
Abstract
In order to analyze the strongly interacting quark gluon plasma in heavy ion collisions, we study different probes by applying the gauge/gravity duality to facilitate
our qualitative understandings on such a non-perturbative system. In this dissertation, we utilize a variety of holographic models to tackle many problems in heavy ion
physics including the rapid thermalization, jet quenching, photon production, and
anomalous effects led by external electromagnetic fields. We employ the AdS-Vaidya
metric to study the gravitational collapse corresponding to the thermalization of a
strongly coupled gauge theory, where we compute the approximated thermalization
time and stopping distances of light probes in such a non-equilibrium medium. We
further generalize the study to the case with a nonzero chemical potential. We find
that the non-equilibrium effect is more influential for the probes with smaller energy.
In the presence of a finite chemical potential, the decrease of thermalization times
for both the medium and the light probes is observed.
On the other hand, we also investigate the anisotropic effect on the stopping distance related to jet quenching of light probes and thermal-photon production. The
stopping distance and photoemission rate in the anisotropic background depend on
the moving directions of probes. The influence from a magnetic field on photoemission is also investigated in the framework of the D3/D7 system, where the contributions from massive quarks are involved. The enhancement of photon production for
photons generated perpendicular to the magnetic field is found. Given that the mass
iv
of massive quarks is close to the critical embedding, the meson-photon transition
will yield a resonance in the spectrum. We thus evaluate the flow coefficient v2 of
thermal photons in a 2+1 flavor strongly interacting plasma. The magnetic-field induced photoemission results in large v2 and the resonance from massive quarks gives
rise to a mild peak in the spectrum. Moreover, we utilize the Sakai-Sugimoto model
to analyze the chiral electric separation effect, where an axial current is generated
parallel to the applied electric field in the presence of both the vector and axial chemical potentials. Interestingly, the axial conductivity is approximately proportional to
the product of the vector chemical potential and the axial chemical potential for
arbitrary magnitudes of the chemical potentials.
v
Contents
Abstract
iv
List of Figures
ix
Acknowledgements
xviii
1 An introduction to heavy-ion phenomenology
1
1.1
Overview of relativistic heavy ion collisions . . . . . . . . . . . . . . .
1
1.2
Hydrodynamics and Elliptic Flow . . . . . . . . . . . . . . . . . . . .
5
1.3
Jet quenching of hard probes in the medium . . . . . . . . . . . . . .
10
1.4
Strong Electromagnetic Fields in Heavy Ion Collisions . . . . . . . . .
16
1.5
Outline of the Dissertation . . . . . . . . . . . . . . . . . . . . . . . .
20
2 Review of the gauge/gravity duality
24
2.1
AdS/CFT Correspondence . . . . . . . . . . . . . . . . . . . . . . . .
24
2.2
Holography at Finite Temperature
. . . . . . . . . . . . . . . . . . .
32
2.3
Adding Flavors . . . . . . . . . . . . . . . . . . . . . . . . . . . . . .
35
3 Jet Quenching and Holographic Thermalization
41
3.1
The Falling Mass Shell in the AdS-Vaidya Spacetime . . . . . . . . .
43
3.2
Jet Quenching of Colorless Probes in the Non-equilibrium Plasma . .
47
3.3
Jet Quenching of Virtual Gluons in the Non-Equilibrium Plasma . . .
54
3.4
Thermalization Time with Chemical Potentials . . . . . . . . . . . . .
61
3.5
Jet Quenching with Chemical Potentials . . . . . . . . . . . . . . . .
65
vi
3.6
Conclusions and Discussions . . . . . . . . . . . . . . . . . . . . . . .
4 Investigating Strongly Coupled Anisotropic Plasmas
69
74
4.1
The Einstein-Axion-Dilaton System . . . . . . . . . . . . . . . . . . .
76
4.2
Light Probes in Anisotropic Plasmas . . . . . . . . . . . . . . . . . .
79
4.3
Photon Production in an Anisotropic Plasma . . . . . . . . . . . . . .
87
4.4
Photon Spectra from Massive Quarks in an Anisotropic Plasma . . .
91
4.5
Concluding Remarks . . . . . . . . . . . . . . . . . . . . . . . . . . .
97
5 Photon Production with a Strong Magnetic Field
99
5.1
External Magnetic Fields . . . . . . . . . . . . . . . . . . . . . . . . . 100
5.2
Photon Production from Magnetic Fields in Anisotropic Plasmas . . . 102
5.3
Thermal-Photon v2 Induced by a Constant Magnetic Field . . . . . . 110
5.4
Concluding Remarks . . . . . . . . . . . . . . . . . . . . . . . . . . . 121
6 Holographic Chiral Electric Separation Effect
123
6.1
Interpretation of Chiral Electric Conductivity . . . . . . . . . . . . . 124
6.2
Basics of Sakai-Sugimoto model . . . . . . . . . . . . . . . . . . . . . 127
6.3
Background-Field Expansion . . . . . . . . . . . . . . . . . . . . . . . 130
6.4
DC and AC Conductivities for Small Chemical Potentials . . . . . . . 134
6.5
Arbitrary Chemical Potentials . . . . . . . . . . . . . . . . . . . . . . 140
6.6
Discussions . . . . . . . . . . . . . . . . . . . . . . . . . . . . . . . . 145
7 Conclusions and Outlook
149
A Appendices for Chapter 3
154
A.1 Perturbative Expansions of the Dilaton Field . . . . . . . . . . . . . . 154
A.2 Quasi-Static Approximation and the Thin-Shell Limit . . . . . . . . . 156
A.3 The Redshift Factor and Thermalization times . . . . . . . . . . . . . 159
A.4 The String Profile in the Quasi-AdS Spacetime . . . . . . . . . . . . . 164
vii
A.5 The Dangling String and Wave velocity in the Quasi-AdS Spacetime . 165
A.6 Finding the Stopping Distance in Eddington-Finkelstein Coordinates
166
A.7 The Dyonic Black Hole . . . . . . . . . . . . . . . . . . . . . . . . . . 169
B Appendices for Chapter 4 and Chapter 5
172
B.1 General Expressions for Field Equations . . . . . . . . . . . . . . . . 172
B.2 Near-Boundary Expansion . . . . . . . . . . . . . . . . . . . . . . . . 173
C Appendices for Chapter 6
176
C.1 Entropy Principle for CESE . . . . . . . . . . . . . . . . . . . . . . . 176
Bibliography
179
Biography
190
viii
List of Figures
1.1
1.2
1.3
The schematic figure of different stages in heavy ion collisions taken
from the presentation by S. Bass. . . . . . . . . . . . . . . . . . . . .
2
The pseudo-rapidity distributions for charged particles for different
centralities[1]. . . . . . . . . . . . . . . . . . . . . . . . . . . . . . . .
6
The schematic figure of azimuthal asymmetry of the medium in position and momentum spaces. In the left panel, the green region represents the cross section of two colliding nuclei in non-central collisions.
In the right panel, the orange region represents the corresponding
anisotropic momentum distribution. The figure is taken from the lecture of P. Huovinen in Jet Summer School 2012. . . . . . . . . . . . .
9
1.4
The comparison between hadron v2 obtained from ideal hydrodynamics[2]
and those measured in RHIC[3, 4, 5]. The figure is taken from [6]. . . 10
1.5
Pressure anisotropy as a function of proper time with different anisotropic
and viscous hydrodynamics approximations corresponding to different
color lines. Here ξ0 denotes the initial momentum- space anisotropy
and η/S denotes the shear viscosity to entropy density ratio. The
figure is taken from [7]. . . . . . . . . . . . . . . . . . . . . . . . . . . 11
1.6
Two energetic quarks created back-to-back in the medium: one travels
mostly in the vacuum and one traverses the plasma. The former radiates few gluons and quickly hardonizes, while the latters lose more
energy due to the induced radiation and finally fragments into the
quenched jet. The jet quenching is characterized by the transport coefficient qˆ, gluon density per rapidity dNg /dy and temperature T. The
figure is taken from [8]. . . . . . . . . . . . . . . . . . . . . . . . . . .
12
The nuclear modification factors for different particles measured in
RHIC[9]. . . . . . . . . . . . . . . . . . . . . . . . . . . . . . . . . . .
13
v2 in minimum bias collisions, using two different reaction plane detectors for (a)π 0 , (b)inclusive photons, (c)direct photons [10]. . . . . .
18
1.7
1.8
ix
2.1
Schematic representation of the AdS/CFT duality[11]. . . . . . . . .
30
2.2
The dimensions of D3/D7 embedding, where 0, 1, 2, 3 denote the four
dimensional spacetime on the boundary. . . . . . . . . . . . . . . . .
36
2.3
Schematic representation of different types of embeddings[12]. . . . .
38
2.4
The mass as a function of ψ0 modified from[13]. . . . . . . . . . . . .
38
3.1
The scenario of a massless particle ejecting from the boundary as the
shell starts to fall, where v0 denotes the thickness of the shell and the
solid red curves and the dashed red curve represent the surfaces and
the center of the shell, respectively. The dashed arrow denotes the
massless particle as a hard probe falling from the boundary at t = 0. .
51
The red, blue, and green curves represent the trajectories of particles
falling in the AdS-Schwarzschild spacetime and in the AdS-Vaidya
spacetime with v0 = 0.2 and v0 = 0.0001, respectively. Three curves
coincide and cannot be distinguished. Here we take |q| = 0.99ω0 and
zh = 1. . . . . . . . . . . . . . . . . . . . . . . . . . . . . . . . . . . .
51
The energy ratio with respect to the collision point zc , where δ = 0.99
and zh = 1. . . . . . . . . . . . . . . . . . . . . . . . . . . . . . . . .
53
A schematic figure for the sting profile in AdS-Vaidya spacetime before
colliding with the shell. . . . . . . . . . . . . . . . . . . . . . . . . . .
54
A schematic figure for the sting profile in AdS-Vaidya spacetime after
colliding with the shell. . . . . . . . . . . . . . . . . . . . . . . . . . .
54
3.2
3.3
3.4
3.5
3.6
The blue and red dots represent the stopping distances in AdS-Vaidya
and AdS-Schwarzschild spacetimes respectively, where xˆs = xs πT and
E
ˆ = πα′ zh E = √ 1
E
. Here we fix the initial velocities of probes
2
T
g Y M Nc
3.7
3.8
3.9
vI = δ = 0.99. . . . . . . . . . . . . . . . . . . . . . . . . . . . . . . .
61
The blue and red dots represent the stopping distances in AdS-Vaidya
and AdS-Schwarzschild spacetimes respectively, where γ denote the
Lorentz factors encoding the initial velocities of gluons. Here we fix
the initial energies of probes Eˆ = 50. . . . . . . . . . . . . . . . . . .
61
The thermalization time τ with different values of chemical potential
in d = 3. . . . . . . . . . . . . . . . . . . . . . . . . . . . . . . . . . .
65
The thermalization time τ with different values of chemical potential
in d = 4. . . . . . . . . . . . . . . . . . . . . . . . . . . . . . . . . . .
65
x
3.10 The ratio to the stopping distances with and without chemical potential in the unit of temperature for d = 3, where xˆ1s = x1s T . Here we
set M = 1, zI = 0, and |q| = 0.99ω. . . . . . . . . . . . . . . . . . . .
3.11 The ratio to the stopping distances with and without chemical potential in the unit of temperature for d = 4, where xˆ1s = x1s T . Here we
set M = 1, zI = 0, and |q| = 0.99ω. . . . . . . . . . . . . . . . . . . .
68
68
3.12 The entropy density with different values of the chemical potential for
d = 3. Here we set M = 1. . . . . . . . . . . . . . . . . . . . . . . . .
68
3.13 The entropy density with different values of the chemical potential for
d = 4. Here we set M = 1. . . . . . . . . . . . . . . . . . . . . . . . .
68
3.14 The red and blue curves represent the trajectories of the massless
particles moving in AdS-RN and AdS-RN-Vaidya spacetimes for d = 3
and χ3 = 4.47, respectively. The red and blue dashed lines denote the
first collision point and the position of the future horizon. Here we
take zI = 0.4, M = 1, and |q|/˜
ω = 0.99 as the initial conditions in
both spacetimes. . . . . . . . . . . . . . . . . . . . . . . . . . . . . .
70
3.15 The red and blue curves represent the trajectories of the massless
particles moving in AdS-RN and AdS-RN-Vaidya spacetimes for d = 4
and χ4 = 1.1, respectively. The red and blue dashed lines denote the
first collision point and the position of the future horizon. Here we
take zI = 0.4, M = 1, and |q|/˜
ω = 0.99 as the initial conditions in
both spacetimes. . . . . . . . . . . . . . . . . . . . . . . . . . . . . .
70
3.16 The red and blue points represent the stopping distances with different
values of chemical potential in AdS-RN and AdS-RN-Vaidya for d = 3,
respectively. Here we set M = 1, zI = 0.4, and |q|/˜
ω = 0.99 as the
initial conditions in both spacetimes. . . . . . . . . . . . . . . . . . .
71
3.17 The red and blue points represent the stopping distances with different
values of chemical potential in AdS-RN and AdS-RN-Vaidya for d = 4,
respectively. Here we set M = 1, zI = 0.4, and |q|/˜
ω = 0.99 as the
initial conditions in both spacetimes. . . . . . . . . . . . . . . . . . .
71
3.18 The blue and red points represent the thermalization times scaled by
the temperature obtained from our approach and that from analyzing
non-local observables, respectively. Here we take M = 1 in the both
cases. . . . . . . . . . . . . . . . . . . . . . . . . . . . . . . . . . . . .
73
4.1
The energy and pressures normalized by their isotropic values as functions of a/T [14]. . . . . . . . . . . . . . . . . . . . . . . . . . . . . . .
xi
79
4.2
4.3
4.4
4.5
4.6
4.7
4.8
4.9
Rx = xaniso /xiso represents the ratio of the stopping distances in the
MT geometry with anisotropy to without anisotropy, where xaniso =
xT for the red points and xaniso = xL for the large blue points. Here
we take |q| = 0.99ω and fix the temperature of media. . . . . . . . . .
Rx = xaniso /xiso represents the ratio of the stopping distances in the
MT geometry with anisotropy to without anisotropy, where xaniso =
xT for the red points and xaniso = xL for the large blue points. Here
we take Nc = 3, |q| = 0.99ω and fix the energy density of media. . . .
Rx = xaniso /xiso represents the ratio of the stopping distances in the
MT geometry with anisotropy to without anisotropy, where xaniso =
xT for the red points and xaniso = xL for the large blue points. Here
we take Nc = 3, |q| = 0.99ω and fix the entropy density of media. . .
The red and thick blue curves represent the ratios Rx = xaniso /xiso
at mid anisotropy at equal temperature and at equal entropy density,
respectively. Here we take |q| = 0.99ω, uh = 1, and a/T ≈ 4.4 or
equivalently a/s1/3 ≈ 1.2 for Nc = 3. . . . . . . . . . . . . . . . . . .
The red and thick blue curves represent the ratios Rx = xaniso /xiso at
large anisotropy at equal temperature and at equal entropy density,
respectively. Here we take |q| = 0.99ω, uh = 1, and a/T ≈ 86 or
equivalently a/s1/3 ≈ 17 for Nc = 3. . . . . . . . . . . . . . . . . . . .
84
85
85
86
86
The blue, green, and red curves(from top to bottom) represent the
ratios of spectral densities at fixed temperature for ǫT = ǫx or ǫy when
k = (−ω, 0, 0, ω), for ǫT = ǫy and ǫT = ǫz when k = (−ω, ω, 0, 0),
respectively. Here we take uh = 1 and a/T = 4.4. . . . . . . . . . . .
92
The red, green, and blue curves(from top to bottom) represent the
ˆ q /(πT ) = 0.61, 0.89,
spectral functions with k = (−ω, 0, 0, ω) for M
and 1.31.The dashed ones and solid ones correspond to the results
with and without anisotropy, respectively. Here we take uh = 1 and
a/T = 4.4. . . . . . . . . . . . . . . . . . . . . . . . . . . . . . . . . .
97
The red, green, and blue curves(from top to bottom) represent the
spectral functions with k = (−ω, ω, 0, 0) and the y−polarization for
ˆ q /(πT ) = 0.61, 0.89, and 1.31. The thin ones correspond to isotropic
M
results. The thick ones and dashed ones correspond to the anisotropic
results with ǫy and ǫz , respectively. Here we take uh = 1 and a/T = 4.4. 97
xii
5.1
The blue and red solid curves(from top to bottom) represent the quark
mass scaled by temperature without and with magnetic field Bz , respectively. The blue, green, and red dashed curves(from top to bottom) correspond to the anisotropic case without magnetic field, with
By , and with Bz , respectively. Here we set uh = 1, By = Bz = 2(πT )2 ,
and a/T = 4.4. . . . . . . . . . . . . . . . . . . . . . . . . . . . . . . 102
5.2
The red, green, and blue curves(from top to bottom) represent the
ˆ q /(πT ) = 0.45, 0.65,
spectral functions with k = (−ω, 0, 0, ω) for M
and 0.86, respectively. The solid, dashed, and dot-dashed correspond
to (a/T, Bz /(πT )2) = (0, 0), (0, 2), and (4.4, 2), respectively. . . . . . 102
5.3
The red, green, and blue curves(from top to bottom) represent the
ˆ q /(πT ) =
spectral functions with k = (−ω, ω, 0, 0) and ǫT = ǫy for M
0.45, 0.65, and 0.86, respectively. The solid, dashed, and dot-dashed
correspond to (a/T, Bz /(πT )2 ) = (0, 0), (0, 2), and (4.4, 2), respectively.106
5.4
The red, green, and blue curves(from top to bottom) represent the
ˆ q /(πT ) =
spectral functions with k = (−ω, ω, 0, 0) and ǫT = ǫz for M
0.45, 0.65, and 0.86, respectively. The solid, dashed, and dot-dashed
correspond to (a/T, Bz /(πT )2 )=(0, 0), (0, 2), and (4.4, 2), respectively. 106
5.5
The ratios of DC conductivity with ǫT = ǫy versus quark mass. The
red(triangle), green(circle), and blue(square) dots correspond to the
cases with (a/T, Bz /(πT )2)=(4.4, 0), (0, 2), and (4.4, 2), respectively. . 107
5.6
The ratios of DC conductivity with ǫT = ǫz versus quark mass. The
red(triangle), green(circle), and blue(square) dots correspond to the
cases with (a/T, Bz /(πT )2)=(4.4, 0), (0, 2), and (4.4, 2), respectively. . 107
5.7
The red and blue (upper and lower at ω/(πT ) = 1) curves represent
the differential emission rate per unit volume with k = (−ω, ω, 0, 0)
ˆ q /(πT ) = 0.45 and 0.86. The solid, dashed, and dot-dashed ones
for M
correspond to (ǫT , Bz /(πT )2 ) = (ǫz(y) , 0), (ǫz , 2), and (ǫy , 2), respectively.108
5.8
The spectral functions with k = (−ω, ω, 0, 0) and ǫT = ǫz . The solid
and dashed curves correspond to (a/T, By /(πT )2 ) = (0, 2) and (4.4, 2),
respectively. . . . . . . . . . . . . . . . . . . . . . . . . . . . . . . . . 110
5.9
The spectral functions with k = (−ω, ω, 0, 0) and ǫT = ǫy . The solid
and dashed curves correspond to (a/T, By /(πT )2 ) = (0, 2) and (4.4, 2),
respectively. . . . . . . . . . . . . . . . . . . . . . . . . . . . . . . . . 110
xiii
5.10 The spectral functions with k = (−ω, 0, 0, ω) and ǫT = ǫx . The solid
and dashed curves correspond to (a/T, By /(πT )2 ) = (0, 2) and (4.4, 2),
respectively. . . . . . . . . . . . . . . . . . . . . . . . . . . . . . . . . 111
5.11 The spectral functions with k = (−ω, 0, 0, ω) and ǫT = ǫy . The solid
and dashed curves correspond to (a/T, By /(πT )2 ) = (0, 2) and (4.4, 2),
respectively. . . . . . . . . . . . . . . . . . . . . . . . . . . . . . . . . 111
5.12 The spectral functions with k = (−ω, 0, ω, 0) and ǫT = ǫx . The solid
and dashed curves correspond to (a/T, By /(πT )2 ) = (0, 2) and (4.4, 2),
respectively. . . . . . . . . . . . . . . . . . . . . . . . . . . . . . . . . 112
5.13 The spectral functions with k = (−ω, 0, ω, 0) and ǫT = ǫz . The solid
and dashed curves correspond to (a/T, By /(πT )2 ) = (0, 2) and (4.4, 2),
respectively. . . . . . . . . . . . . . . . . . . . . . . . . . . . . . . . . 112
5.14 The coordinates of the system, where the magnetic field points along
the z axis and the x axis is parallel to the beam direction. The k
denotes the momentum of emitted photons and θ denotes the angle
between the momentum and the x-y plane as the reaction plane; ǫout
and ǫin represent the out-plane and in-plane polarizations, respectively. 114
5.15 The red(dot-dashed) and blue(dashed) curves correspond to the v2 of
the photons with in-plane and out-plane polarizations, respectively.
The black(solid) curve correspond to the one from the averaged emission rate of two types of polarizations. Here we consider the contribution from massless quarks at Bz = 1(πT )2 . . . . . . . . . . . . . . . 117
5.16 The colors correspond to the same cases as in Fig.5.15. Here we consider the contributions from solely the massive quarks with m = 1.143
at Bz = 1(πT )2 . . . . . . . . . . . . . . . . . . . . . . . . . . . . . . . 117
5.17 The colors correspond to the same cases as in Fig.5.15. Here we consider the contributions from both massless quarks and massive quarks
with m = 1.143 at Bz = 1(πT )2 . . . . . . . . . . . . . . . . . . . . . . 118
5.18 The colors correspond to the same cases as in Fig.5.15. Here we consider the contributions from both massless quarks and massive quarks
with m = 1.307 at Bz = 0.1(πT )2 . . . . . . . . . . . . . . . . . . . . . 120
5.19 The colors correspond to the same cases as in Fig.5.15. Here we consider the contributions from both massless quarks and massive quarks
with m = 1.3 at Bz = 0.2(πT )2 . . . . . . . . . . . . . . . . . . . . . . 121
6.1
The schematic description of the embeddings in the SS model[15]. . . 128
xiv
6.2
D8-brane embeddings in the Sakai-Sugimoto model[16]:(a)chiral symmetry breaking in vacuum (b)chiral symmetry breaking in the plasma
(c)chiral symmetry restored in the plasma. Here the black circles on
top represent the compactified x4 on S 1 and the red curves represent
the D8 branes and D8 branes in the bulk. . . . . . . . . . . . . . . . 128
6.3
The DC conductivities in the L/R bases versus the chemical potentials
scaled by temperature. . . . . . . . . . . . . . . . . . . . . . . . . . . 138
6.4
The blue and red(dashed) curves correspond to the normal DC conductivity and the axial one with µV = T , respectively. . . . . . . . . . 141
6.5
The blue and red(dashed) curves correspond to the normal DC conductivity and the axial one with µA = 0.5T , respectively. . . . . . . . 141
6.6
Power-counting estimation in (6.9) with µA = 0.01T . . . . . . . . . . 141
6.7
Power-counting estimation in (6.9) with µV = 0.2T . . . . . . . . . . . 141
6.8
The red, blue(dashed), and black(dot-dashed) curves correspond to
the cases with µV = T , 0.6T , and 0, 3T . Here µ
ˆV /A = µV /A /T . . . . . 142
6.9
The red(solid), blue(dashed), and green(dotted) curves correspond to
the real part of the normal AC conductivity with µA = 0.2T , 0.5T ,
and 0.9T , respectively. Here µV = T . . . . . . . . . . . . . . . . . . . 142
6.10 The red(solid), blue(dashed), and green(dotted) curves correspond to
the real part of the axial AC conductivity with µA = 0.2T , 0.5T , and
0.9T , respectively. Here µV = T . . . . . . . . . . . . . . . . . . . . . . 143
6.11 The red(solid), blue(dashed), and green(dotted) curves correspond to
the imaginary part of the axial AC conductivity with µA = 0.2T , 0.5T ,
and 0.9T , respectively. Here µV = T . . . . . . . . . . . . . . . . . . . 143
6.12 The DC conductivities in the L/R bases versus the chemical potentials
scaled by temperature. The dashed red curve and solid blue curve
correspond to the result from the background-field expansion and from
solving the full DBI action, respectively. . . . . . . . . . . . . . . . . 144
6.13 The blue and red(dashed) curves correspond to the normal DC conductivity and the axial one with µV = 4T , respectively. . . . . . . . . 145
6.14 The blue and red(dashed) curves correspond to the normal DC conductivity and the axial one with µA = 3T , respectively. . . . . . . . . 145
xv
6.15 The red, blue(dashed), black(dot-dashed), and green(long-dashed) curves
correspond to the cases with µV = 10T , 8T , 4T , and T . Here µ
ˆV /A =
µV /A /T . . . . . . . . . . . . . . . . . . . . . . . . . . . . . . . . . . . 146
6.16 The Green(solid), red(long-dashed), and black(dot-dashed) curves correspond to the real part of the normal AC conductivity with (µV , µA ) =
(4T, 3T ), (4T, T ) and (T, 0.9T ). The blue(dashed) curve corresponds
to the one with (µV , µA ) = (T, 0.9T ) from the background-field expansions. . . . . . . . . . . . . . . . . . . . . . . . . . . . . . . . . . . 146
6.17 The real part of the axial AC conductivity with the colors corresponding to the same cases as Fig.6.16. . . . . . . . . . . . . . . . . . . . . 147
6.18 The imaginary part of the axial AC conductivity with the colors corresponding to the same cases as Fig.6.16. . . . . . . . . . . . . . . . . 147
A.1 The comparison between the leading-order mass function to O(ǫ2 ) and
the next leading-order one to O(ǫ4 ) in terms of v. Two results coincide
and cannot be distinguished in the figure. . . . . . . . . . . . . . . . . 156
A.2 The red curve and blue curve illustrate the φ(z = 0.99, v) up to O(ǫ)
and O(ǫ3 ), respectively. When v ≈ 3v0 , the contribution from the
higher order terms starts to increase, while its amplitude is rather
small as v is still within (−3v0 , 3v0 ). . . . . . . . . . . . . . . . . . . . 156
A.3 The solid red, orange, and blue curves represent the position of the
center of the shell using the linear approximation for (v0 , ǫ)=(0.1,
0.02306), (0.2, 0.06523), and (0.4, 0.18451), respectively. The dashed
curves are the result of numerically computing v(t, z). . . . . . . . . . 158
A.4 Same plot as in Fig.A.3, but zooming onto late time evolution. . . . . 158
A.5 The full numerical computation for m(v) at v0 = 0.1 and ǫ = 0.02306. 159
A.6 The red and blue curves represent the leading order mass function
to O(ǫ2 ) for v0 = 0.1 and ǫ = 0.02306 at z0 = 0.99 and z0 = 0.3,
respectively. . . . . . . . . . . . . . . . . . . . . . . . . . . . . . . . . 159
A.7 The red curve represents the redshift factor c(z0 ) as a function of the
position of the shell, while the blue curve represents F (z0 ), where the
future horizon is at zh = 1. . . . . . . . . . . . . . . . . . . . . . . . . 160
A.8 The blue and red curves represent the positions of the shell obtained
from (3.18) and (A.8), respectively. Here the blue dashed line denotes
the future horizon at zh = 1. . . . . . . . . . . . . . . . . . . . . . . . 160
xvi
A.9 The scenario of a massless particle ejecting from the boundary as the
shell starts to fall, where v0 denotes the thickness of the shell and
the solid red curves and the dashed red curve represent the surfaces
and the center of the shell, respectively. Here the blue dashed line
represents the masselss particle ejected from zI . . . . . . . . . . . . . 169
A.10 The green points represent the stopping distances in AdS-RN-Vaidya
spacetime in EF coordinates, which match those derived in Poincare
coordinates as shown by the blue points. Here the initial conditions
are the same as those in Fig.3.17 and we take v0 = 0.0001. . . . . . . 169
xvii
Acknowledgements
First, I would like to thank my supervisor Berndt M¨
uller for his guidance and supervision. He has been always supportive and encouraging to cultivate my independent
thinking in scientific research. Without his help, the accomplishment of this dissertation will not be possible.
Moreover, I am deeply grateful to my collaborators Elena Caceres, Arnab Kundu,
and Diana Vaman. Most of the early work of this dissertation is in collaboration with
them. As experienced string theorists, they have taught me essential knowledge and
techniques in the AdS/CFT correspondence. Also, I appreciate their hospitality
during my visits in U.T. Austin and in University of Virginia.
I would also like to thank my friends in Taiwan, Shi Pu and Shang-Yu Wu, as
my collaborators contributing a big part of my research in this dissertation. The discussions with them are always fruitful and enlightening, which allow me to explore
heavy ion physics from broader perspectives in holography. Besides direct collaboration, I deeply acknowledge numerous engaging conversations with Peter Arnold,
Jinfeng Liao, Juan Pedraza, Andreas Sch¨afer, Michael Strickland, Bo-Wen Xiao, and
Hongbao Zhang.
On the other hand, it is as well important to mention many people I met in Duke.
Among the senior members, my special acknowledgment goes to Steffen Bass and
Thomas Mehen from whom I have learned a lot in heavy ion physics and the effective
field theory. Particularly, I thanks Tom for his supervision on my research in my early
xviii
graduate years. I also thank my colleagues Shanshan Cao, Christopher ColemanSmith, and Guang-You Qin for useful discussions in academics. I am fortunate to
have Jui-an Chao, Ching-Yun Cheng, Chung-Ting Ke, Leo Fang, Hung-Ming Tsai,
and Chi-Ho Wang for sharing great experiences in daily life and helping me to pass
the suffering moments in my graduate study.
I most humbly acknowledge the contribution of my parents whom this thesis is
dedicated to. Without their sacrifice, unconditional support and love none of these
would be possible.
xix
1
An introduction to heavy-ion phenomenology
1.1 Overview of relativistic heavy ion collisions
The high-energy experiments in the Relativistic heavy ion collider (RHIC) and Large
Hadron Collider (LHC) collide two ultra-relativistic nuclei to produce the so called
quark gluon plasma (QGP) as a deconfined phase of quarks and gluons. In RHIC,
√
√
the Au+Au collisions can reach s = 200 GeV, where s represents the energy per
nucleon in the center of mass frame. At the LHC, the maximum collision energy
√
for Pb+Pb collisions can further reach s = 2.76 TeV. The ultrahigh energy collisions provide high resolution to probe the internal structure of nucleons with the
strong interaction governed by quantum chromodynamics (QCD). The collision of
two colliding nuclei will form QGP as a thermal medium. Based on hydrodynamic
properties of QGP, it is now generally believed that QGP is strongly coupled. The
investigation of heavy-ion phenomenology thus provides profound information on
the strongly coupled QCD. Moreover, the experiments could be regarded as a ”small
Bang”, which may simulate the formation of early universe. Therefore, the studies
of QGP may as well facilitate our understandings from the cosmological perspective.
1
Figure 1.1: The schematic figure of different stages in heavy ion collisions taken
from the presentation by S. Bass.
The medium formed in heavy-ion collisions undergoes different stages, which are
schematically illustrated in Fig.1.1. The smashed nuclei firstly break the confinement
via large kinetic energy, while it takes short but finite time for the deconfined medium
to reach a thermal state with the temperature greater than the deconfined temperature of QCD. Whether such a pre-equilibrium state is weakly coupled or strongly
coupled is still under debate. Given the large Qs (energy transfer) in deep inelastic collisions, where Qs ≫ ΛQCD , the QCD coupling here should be rather small according
to the asymptotic freedom[17, 18]. Based on the weakly coupled QCD, a phenomeno−13/5
logical model approximates the thermalization time as τ ∼ αs
Q−1
s [19], where
√
gs = 4παs represents the QCD coupling. This approximated thermalization time
is much larger than the small thermalization and isotropization times for tth(iso) < 1
fm/c extracted from the initial conditions of hydrodynamics applied to simulate
the later phase[2, 20, 21, 22]. However, the small thermalization and isotropization times are found in string-theory-based models in the infinitely strong coupling
limit[23, 24, 25, 26, 27, 28, 29], which may support the strongly coupled scenario in
the pre-equilibrium state. After the rapid thermalization, the thermalized medium
forms QGP, which undergoes hydrodynamic expansion. By fitting the experimental
2
data with hydrodynamic simulations, it has been shown that QGP has a small shear
viscosity to entropy density ratio, which is close to 1/(4π), which is the lowest bound
for universal quantum systems proposed by Kovtun, Son, and Starinets(KSS)[30] in
string theory. The small ratio hence suggests that QGP is a nearly perfect fluid.
In Section II, we will further introduce the elliptic flow v2 as an important quantity
measured by experiments to characterize the collective behavior of QGP. While the
low-energy partons as soft probes in QGP are governed by hydrodynamics, the energetic partons as hard probes like jets or heavy quarks may behave differently. These
hard probes are mostly generated in early times due to their high energies. There
exists an interesting phenomenon called ”jet quenching” as suppression of these hard
probes observed in heavy ion collisions, which will be further discussed in Section
III. In the end of the hydrodynamic evolution, the color objects have to hadronize
to form the color singlets. The hadronization of QGP are dictated by the QCD
fragmentation[31, 32, 33] and recombination effect[34, 35, 36, 37], where the latter
generally originates from co-moving quarks with total kinetic energy and quantum
numbers equal to those of moving hadrons. Finally, the interactions between hadrons
become rather weak and all hadrons move freely toward detectors; such a last phase
is called freeze-out.
In theory, non-perturbative approaches are required in order to study the strongly
coupled QGP(sQGP) phase. Hydrodynamics as a long-wave length effective theory successfully describes most of experimental observables, but the microscopic
mechanisms behind the input parameters such as the transport coefficients, thermalization time, and initial conditions are unknown. Although lattice QCD can
provide static properties of strongly coupled QCD, the computations of dynamical
observables are challenging[38, 39, 40]. Furthermore, there exists a sign problem for
lattice QCD at finite density. The gauge/gravity duality or the so called anti-de Sitter space/conformal field theory(AdS/CFT) correspondence as a duality between a
3
strongly coupled gauge theory living in a lower-dimensional spacetime and the string
theory in a higher-dimensional spacetime may be a useful tool to analyze qualitative
features of sQGP[41, 42, 43, 44, 45]. Since the gauge theory here can be regarded
as a hologram of the string theory, the AdS/CFT correspondence is sometimes abbreviated as holography. Despite the fact that the AdS/CFT correspondence as a
conjecture has not been proved and the corresponding gauge theory, N = 4 super
Yang-Mills theory originally proposed in the conjecture, is distinct from QCD, many
studies such as thermodynamic properties and the shear viscosity to entropy density ratio in holography suggest that such a gauge theory and QCD have similar
features at the finite temperature of RHIC and LHC[46, 47, 30, 48]. Based on this
”evidence”, the AdS/CFT correspondence has been widely applied to investigate
many observables in heavy ion collisions, while the direct comparisons with experimental measurements are still challenging. On the other hand, the understanding
of the pre-equilibrium state before the QGP phase is as well insufficient in theory.
In the weakly coupled scenario, the color glass condensate (CGC)[49, 50, 51, 52]
based on the gluon saturation at the small Bjorken scaling Q2s /s approximates the
gluons by classical gauge fields. This effective theory is employed to provide the
initial conditions for the pre-equilibrium state[53, 54, 55]. Although CGC may provide a more realistic initial conditions for heavy ion collisions based on QCD, which
can further incorporate initial-state fluctuations[56, 57, 58], CGC itself can not explain the rapid thermalization. As a counter part in the strongly coupled scenario,
holographic models are proposed to simulate the collisions and thermalization of the
medium[23, 24, 59, 60, 61, 62, 63, 64, 65, 66, 25, 26, 27, 28, 67].
In the following sections, we will elaborate in more about the strongly coupled
features of QGP and introduce the relevant observables in experiments. On the
other hand, we will also review the theoretical approaches proposed to address the
experimental measurements, while more emphasis will be put on the related works
4
in holography.
1.2 Hydrodynamics and Elliptic Flow
Hydrodynamics is a low-energy effective theory based on local conservation of charges
and energy-momentum,
∂µ T µν (x) = 0,
∂µ N µ (x) = 0,
(1.1)
where T µν and N µ here denote the energy-momentum tensor and the current of
the baryon number(or electric charge), respectively. The hydrodynamic evolution
depends on initial conditions, equations of state, and the transport coefficients characterizing viscous effects. In most of cases, only numerical solutions can be attained, while one can obtain analytical solutions with certain approximations. The
Bjorken expansion can be taken as a simplest initial condition for the longitudinal expansion[68], which approximates boost-invariant particle production along the
beam axis. As shown in Fig.1.2, it turns out that the Bjorken expansion is valid
in the mid-rapidity regime in high-energy collisions. To be more concrete, we will
perform simple calculations to solve the conservation equations in (1.1) in an ideal
fluid with the Bjorken expansion. For clarity, we should mention that the pseudo
rapidity η is defined as
η = − ln tan
Θ
2
,
(1.2)
where Θ is the angle between the momentum of the produced particle p and the
beam axis zˆ. At high energy, it is equal to the momentum rapidity defined as
y˜ =
1
ln
2
E + pz
E − pz
≈
1
ln
2
1 + cos Θ
1 − cos Θ
= η.
(1.3)
We will hereafter use the momentum rapidity as the rapidity throughout this dissertation.
5
Figure 1.2: The pseudo-rapidity distributions for charged particles for different
centralities[1].
Now the energy-momentum tensor and the particle-number current can be written
as
T µν = (ǫ + P )uµuν − P g µν + Πµν ,
N µ = nuµ ,
(1.4)
where P , ǫ, and n are the pressure, energy, and number densities, respectively. Here
uµ = dxµ /dτ denotes the local velocity of the fluid and gµν represents the spacetime
metric, where τ denotes the proper time and we have uµ uµ = −1. The last term Πµν
in the energy-momentum tensor is the viscous stress tensor that includes the shear
and bulk viscosities stemming from dissipation. Considering ideal hydrodynamics for
a perfect fluid, we will take Πµν = 0. By contracting the conservation of energy-stress
tensor in (1.1) with uν and using the expressions in (1.4), one obtains
uµ ∂µ ǫ + (ǫ + P )∂µ uµ = 0,
uµ ∂µ n + n∂µ uµ = 0.
(1.5)
Next, we should consider the boost invariant setup. In the simplest case, we assume
that the transverse distribution of particle number and that of the energy are homogeneous, which corresponds to the so-called (0 + 1)d model. The medium only
6
expands along the z axis as the beam direction. By making the coordinate transformations,
t = τ cosh y˜,
z = τ sinh y˜,
(1.6)
one then derives
uµ = (cosh y˜, 0, 0, sinh y˜),
uµ ∂µ = ∂τ ,
∂µ uµ = τ −1 .
(1.7)
By inserting the relations in (1.7) into (1.5), we find
1
∂τ ǫ + (ǫ + P ) = 0
τ
∂τ n +
n
= 0.
τ
(1.8)
The second equation in (1.8) yields
n(τ ) = n0
τ0
,
τ
(1.9)
where n0 and τ0 represent the initial number density and the initial(thermalization)
time. Such a relation directly indicates that dN/d˜
y = 0, which is consistent with the
experimental measurements shown in Fig.1.2 at central rapidity. One may further
assume the ideal-gas equation of state, P = ǫ/3 and ǫ ∝ T 4 , which gives rise to the
time-evolution of the energy density and temperature as
ǫ(τ ) = ǫ0
τ0
τ
T (τ ) = T0
τ0
τ
4
3
1
3
,
,
(1.10)
where ǫ0 and T0 denote the initial energy density and the initial temperature. The
first equation in (1.8) is utilized to derive the above relations.
7
In reality, even at the central rapidity, the (0 + 1)d model is too coarse. In
the (2 + 1)d hydrodynamic simulations, the transverse expansion is considered. For
transverse directions, distinct initial conditions such as the Glauber model[69, 70]
and Kharzeev-Levin-Nardi(KLN) model[53, 71, 72, 54, 73, 57] are applied. The
Glauber model is basically a geometrical constraint on the distributions, where the
initial energy or entropy density profile is taken to be proportional to the profile
of nucleon-nucleon collisions. On the contrary, the KLN model approximates the
entropy density distribution proportional to the distribution of gluons produced in
primary collisions in the framework of CGC. Also, the equation of state is nowadays obtained by lattice QCD. Moreover, the ideal hydrodynamics assumes local
thermal equilibrium and that the system is non-dissipative. When the system is
slightly away from thermal equilibrium, one can perform the derivative expansion of
the energy-momentum tensor, which leads to the stress viscous tensor. The transport coefficients of the derivative terms such as the shear and bulk viscosities are attributed to the dissipative effect. These transport coefficients are usually determined
by fitting experimental data. It turns out that the transport coefficients results in
significant effects upon many observables, see the review[74] and references therein.
Although the transport coefficients can not be directly derived from hydrodynamics
itself, they may be computed in the strongly coupled systems analogous to the QGP
via the AdS/CFT correspondence. For example, the renowned lower bound for the
shear viscosity to entropy density ratio is derived from a strongly coupled N = 4
SYM plasma at large Nc limit through holography[46, 30], where the result is rather
close to the values extracted from RHIC data.
In experiments, one of the most important observables supporting the fluid behavior of the QGP is the so-called elliptic flow.
In the central-rapidity region
of non-central collisions as illustrated in Fig.1.3, the position-space anisotropy of
the medium results in large pressure gradient parallel(or anti-parallel) to x axis.
8
Figure 1.3: The schematic figure of azimuthal asymmetry of the medium in position
and momentum spaces. In the left panel, the green region represents the cross section
of two colliding nuclei in non-central collisions. In the right panel, the orange region
represents the corresponding anisotropic momentum distribution. The figure is taken
from the lecture of P. Huovinen in Jet Summer School 2012.
Therefore, particles receive greater momenta along ±ˆ
x directions, which convert
the position-space anisotropy into the momentum-space anisotropy. Such azimuthal
asymmetry in transverse directions can be characterized by the elliptic flow,
v2 (pT , y˜) =
2π
0
dθ cos(2θ) d2dN
pT d˜
y
2π
0
dθ d2dN
pT d˜
y
,
(1.11)
where θ denotes the angle between the transverse momentum pT and the reaction
plane and N represents the particle yield. From the definition, large v2 as well
implies the enhanced particle production along the ±ˆ
x directions relative to that
along the ±ˆ
y directions. Large v2 of charged particles as a fluid-like signal were
observed in RHIC and LHC[3, 4, 5, 75]. As shown in Fig.1.4, the RHIC data match
the hydrodynamic simulations for hadron v2 with small transverse momenta.
Although ideal hydrodynamics was first applied to analyze the data, where it
stems from the local thermal equilibrium and pressure isotropy, the recent development of viscous hydrodynamics[76, 77, 78, 79, 58, 80] and anisotropic hydrodynamics[81,
9
Figure 1.4:
The comparison between hadron v2 obtained from ideal
hydrodynamics[2] and those measured in RHIC[3, 4, 5]. The figure is taken from
[6].
82, 83, 84, 85, 86, 7] reveals a large pressure difference between the longitudinal(beam) and transverse directions. As shown in Fig.1.5, the pressure anisotropy
may exist even at very late time near the freeze-out at τ ∼ 7 − 10 fm. When the
shear viscosity to entropy density ratio increases, the pressure anisotropy will be increased. More recent comparisons of the hydrodynamic simulations and experimental
data also suggest that QGP has small but nonzero shear viscosity. In addition, the
pressure anisotropy is also found in the studies of thermalization via the AdS/CFT
correspondence. As shown in [27, 28], the longitudinal pressure is smaller than the
transverse one even after the thermalization. Due to the rising evidence, the influence
of pressure anisotropy and viscous effects on various probes in heavy ion collisions
has been widely studied, see the review[87] and references therein.
1.3 Jet quenching of hard probes in the medium
From the high-energy scatterings in the collisions, the back-to-back jets comprising
energetic partons are engendered in both proton-proton(p+p) collisions and heavy
ion collisions. In heavy ion collisions, most of the hard partons form energetic pions as
lightest mesons after the freeze-out. On the other hand, heavy quarks are generated
10
Figure 1.5: Pressure anisotropy as a function of proper time with different
anisotropic and viscous hydrodynamics approximations corresponding to different
color lines. Here ξ0 denotes the initial momentum- space anisotropy and η/S denotes the shear viscosity to entropy density ratio. The figure is taken from [7].
from hard scatterings as well due to their large mass above the temperature of QGP.
The hard probes such as energetic partons and heavy quarks may not inherit the bulk
properties and collectively evolve with the medium. However, due to the interaction
with the medium, the behaviors of hard probes traveling through QGP in heavy ion
collisions are distinct from that through vacuum in p+p collisions. As depicted in
Fig.1.6, one of the hard probes created as a pair traversing further in the medium
scatters with the medium more extensively and loses more energy in the end. The
yield of such a hard probe is thus suppressed, which is called jet quenching in heavy
ion physics and is one of the signals supporting the existence of QGP.
In experiments, the jet quenching is characterized by the nuclear modification
factor as a function of transverse momenta of hadrons and rapidity,
h
RAB
(pT , y˜)
=
dN AB→h
dpT d˜
y
dN pp→h
NAB dpT d˜y
11
,
(1.12)
Figure 1.6: Two energetic quarks created back-to-back in the medium: one travels
mostly in the vacuum and one traverses the plasma. The former radiates few gluons
and quickly hardonizes, while the latters lose more energy due to the induced radiation and finally fragments into the quenched jet. The jet quenching is characterized
by the transport coefficient qˆ, gluon density per rapidity dNg /dy and temperature
T. The figure is taken from [8].
where N AB→h denotes the number of hadrons produced from the collisions of nucleus
A and nucleus B and N pp→h denotes the number of hadrons produce from p+p
collisions. Here NAB corresponds to the average number of the nucleon-nucleon
collisions in A+B collisions, which is introduced to compare the A+B collisions with
h
p+p collisions on equal footing. Given that RAB
< 1, one can conclude that jet
quenching does exist. From RHIC data as shown in Fig.1.7, the strong suppression
h
for pion-production is observed. Notice that RAA
as well depends on the centrality of
collisions. In more central collisions, the hard probes may travel a longer distance in
h
the medium. The RAA
thus is smaller in such cases[88]. On the other hand, in order
to disentangle the influences from initial conditions (early state) and from medium
h
(final state) effects, we may refer to the RdA
for d-Au(deutron-gold) collisions[89, 90],
12
Figure 1.7: The nuclear modification factors for different particles measured in
RHIC[9].
h
where RdA
≈ 1 for the arbitrary transverse momentum and rapidity. It turns out that
the jet quenching is less affected by the early state due to the absence of a thermal
medium formed in d+A collisions. In addition, electromagnetic probes such as highenergy photons are approximately unaffected by the thermal medium after they
have been produced due to weak electromagnetic couplings. As long as the initial
conditions for photoemission are similar in p+p collisions and in A+A collisions, we
should expect no suppression in the latter case. Thus, the dominance of the medium
γ
effect upon jet quenching is as well supported by RAA
≈ 1 for the high-energy photon
production in A+A collisions as presented in Fig.1.7.
In theory, according to the experimental observations, one may assume that the
modification of the spectra of hard probes in the medium compared with those in
vacuum arises from parton energy loss[91, 92, 93, 94, 95, 96]. Upon this assumption,
the modified partonic cross sections in the medium can be written as
AB→h+rest
dσmed
=
f
AB→f +X
dσvac
⊗ Pf ⊗ Dfvac
→h ,
(1.13)
AB→f +X
where σvac
denote the cross sections of p+p collisions augmented by the nu-
clear distribution functions. Here Dfvac
→h denotes the fragmentation function from the
13
intermediate parton f to the final hadron h. All information of the energy loss ∆E
is encoded in the function Pf . The nuclear modification factor can be as well written
as
h
RAB
(pT , y˜) =
dσAB→h+rest
dpT d˜
y
dσpp→h+X
NAB dpT d˜y
.
(1.14)
In general, the mechanisms of energy loss for hard probes in QGP mainly arise
from medium-induced radiation and collisions. One of the parameters that characterizes the interaction between hard probes and the medium is the jet quenching
parameter qˆ, which is roughly defined as
qˆ =
p2t
,
∆L
(1.15)
where p2t represents the momentum broadening and ∆L denotes the distance traversed by the hard probes. Here pt corresponds to the momentum transverse to
the moving direction of hard probes, which is distinct from pT as the momentum
transverse to the beam direction. In the central rapidity regime, pt is approximately
perpendicular to pT . From pQCD, the average medium-induced energy loss is given
by
∆E =
where gs =
√
∆L2
αs CR qˆ,
8
(1.16)
4παs is the QCD coupling and CR is the Casimir operator. Since qˆ is
non-perturbative, it can only be extracted from experimental data or evaluated via
strongly coupled approaches.
In the AdS/CFT correspondence, the jet quenching parameter of heavy quarks
can be computed from a light-cone Wilson loop in a thermalized background[97, 98].
The result reads
qˆSYM =
π 3/2 Γ
Γ 54
14
3
4
√
λT 3
(1.17)
for N = 4 SYM plasma, where λ = gY2 M Nc denotes the t’Hooft coupling. Here
√
Nc is the number of colors and gY M = 4παY M is the coupling of SYM plasma.
Taking Nc = 3 and αs = 1/2 as an analog of the condition in sQGP, one finds
qˆ = 4.5, 10.6, and 20.7 GeV2 /fm for T = 300, 400, and 500 MeV[97]. Recent
analysis of the measurements in RHIC suggests that qˆ = 2 − 10 GeV2 /fm[9], which
approximately agrees with the AdS/CFT result for T = 300 − 400 MeV as the RHIC
initial temperature. Nonetheless, the computation for qˆ in [98, 97] only involves the
collisional energy loss. On the contrary, the radiation energy loss in the strongly
coupled scenario is characterized by a trailing string[99, 100]. In this setup, the end
of the string moving on the boundary, where the strongly coupled gauge theory lives,
mimics a heavy quark traversing the medium. By assuming that the energy loss is
due to the drag force exerted on the string, the radiation energy loss in this scenario
is given by
dE
π√ 2 2
=−
λT γv ,
dt
2
(1.18)
where γ is the Lorentz factor and v is the velocity of the quark. Nevertheless, the
trailing-string scenario results in over-suppression of the nuclear modification factors
for heavy quarks in comparison with the experimental measurements[101].
On the other hand, one may speculate that the hard probes, especially for light
probes such a light quarks or gluons, may not travel all the way through the medium.
They may gradually lose energy and diffuse (stop) in the medium. Such a notion
leads to the analysis of a different quantity related to jet quenching, which is the
so-called stopping distances. In holography, the scenario is characterized by falling
strings[102, 103] or the supergravity excitation viewed as a point particle falling into
the black hole[104, 105]. From these approaches, it is found that
1
xmax
∝ E3,
s
15
(1.19)
where xmax
is the possible maximum stopping distance. This energy-dependent stops
ping distance can be further implemented in phenomenological models to evaluate
RAA for light probes[106].
1.4 Strong Electromagnetic Fields in Heavy Ion Collisions
In non-central collisions, strong electromagnetic fields can be produced by the fastmoving nuclei. In the region near the origin of the coordinates shown in Fig.1.3
where the QGP is firstly formed, one may expect a strong magnetic field pointing
along the y direction. However, by symmetry, the average electric field in such a
region will be approximately zero. By assuming the colliding nuclie moving along
the ±z directions with the same speed v and the nuclear charge Ze to be distributed
uniformly within the nuclear radius R, the magnetic field in such a region can be
approximated as
B(t) ≈
Zeγvb
4π (R2 + γ 2 v 2 t2 )3/2
yˆ,
(1.20)
where b is the impact parameter and γ is the Lorentz factor. Considering non-central
√
Au+Au collisions with s = 200 GeV per nucleon and b ≈ R, we have Z = 79, R ≈ 7
fm, v ≈ 1, and γ ≈ 100. At t = 0, the magnitude of the magnetic field is about
|eB(0)| = eBy (0) ≈ 4.56 × 10⁻² GeV2 ≈ 2m2π ,
(1.21)
which is 105 times larger than the critical magnetic field of electrons |eBc | = m2e =
2.5 × 10⁻⁷ GeV2 with mπ and me being the pion and electron masses.
When
|eB| ≫ |eBc |, the classical electrodynamics may breakdown and nonlinear quantum electrodynamics(QED) effects become pronounced[107]. On the other hand,
the QGP approximately behaves as an chiral system due to T ≫ mq with mq being the masses of light quarks. In the presence of topological charge fluctuations
16
pertinent to the axial anomaly in QCD, which results in nonzero vector and axial
chemical potentials in QGP, accompanied by the electromagnetic anomaly, a mechanism called chiral magnetic effect(CME) was proposed[108, 109, 110, 111]. From
CME, the magnetic field will induce a vector current parallel to it via
JV =
Nc e
µA B,
2π 2
(1.22)
where µA represents the axial chemical potential, Nc is the degree of freedom for
fermions, B is the external magnetic field, and e is the electric charge. Along with
CME, the magnetic field can also trigger an axial current parallel to the applied field
in the presence of nonzero charge density via
Ja =
Nc e
µV B,
2π 2
(1.23)
where µV represents a vector chemical potential. This effect is called chiral separation
effect(CSE)[112]. Based on these two effects, the fluctuations of both µA and µV
result in a propagating wave as the chiral magnetic wave(CMW)[110]. As shown in
[113], the CMW could generate a chiral dipole and charge quadrupole in QGP, which
may contribute to the charge asymmetry of elliptic flow v2 measured in RHIC[114,
115].
Also, the strong magnetic field may enhance the photon production in heavy ion
collisions[116, 117, 118, 119, 120], which serves as one of the possible mechanisms to
cause large photon v2 recently measured in RHIC[10] and in LHC[121]. Unlike the
hadronic flow, the large flow of direct photons (i.e. not originating from the hadronic
decays) is unexpected since the high-energy photons are presumed to be generated
in early times, where the initial flow should be relatively small compared to the flow
built up by hydrodynamics. In general, the photons with pT > 1 GeV are categorized
as direct photons. The direct photons mainly incorporate prompt photons created
17
Figure 1.8: v2 in minimum bias collisions, using two different reaction plane detectors for (a)π 0 , (b)inclusive photons, (c)direct photons [10].
in the pre-equilibrium state and thermal photons generated in QGP. Surprisingly,
as shown in Fig.1.8, the direct-photon v2 is comparable to pion v2 in RHIC. Similar
observations were found in LHC as well[121].
In addition to the strong magnetic field, a strong electric field could be produced
in heavy ion collisions as well. In general, the magnitude of the average electric field
is much smaller than that of the average magnetic field by symmetry as mentioned in
the previous context. Nonetheless, based on the fluctuations of colliding nuclei, it has
been shown that the magnitude of the electric field can be comparable to that of the
magnetic field[122]. Moreover, in the asymmetric collisions such as Cu+Au collisions
for two colliding nuclei having different numbers of charge, there exists a strong
electric field directing from the Au nucleus to the Cu nucleus[123]. Accordingly,
a novel phenomenon called chiral electric separation effect(CESE) was proposed in
Ref.[124]. In the presence of both vector and axial chemical potentials, an axial
current can be induced by an electric field E through
Ja = σ5 E = χe µV µA E,
(1.24)
where σ5 denotes the anomalous conductivity which is proportional to the product
of µV and µA for small chemical potentials compared to the temperature (µV /A ≪ T )
18
and χe is a function of T in that case. Unlike CME and CSE, the CESE does not
originate from the electromagnetic anomaly, but naturally comes from the interactions of chiral fermions. In fact, the normal conductivity also receives the correction
proportional to µ2V + µ2A in the system. Combining CESE with CME, the authors in
Ref.[124] further indicated that a charge quadrapole could be formed in the asymmetric collisions, which may give rise to nontrivial charge azimuthal asymmetry as
a signal for CESE in experiments.
Although the initial magnetic field is rather strong in heavy ion collisions, according to (1.20), it decreases rapidly with respect to time as |eB(t)| ∼ |eB(0)|t−3 in
vacuum. Nevertheless, the thermal quarks in QGP may have nonzero electrical conductivity σe , which could extend the lifetime of the magnetic field. Such an electrical
conductivity can not be directly measured by experiments, but it can be computed
by lattice QCD. As reported in Ref.[125], the result reads
σe = (5.8 ± 2.9)
T
MeV,
Tc
(1.25)
where T is plasma temperature and Tc is critical temperature. By taking an approximation based on the diffusion equation of magnetic fields, it has been shown
that the magnetic field with the nonzero electrical conductivity above depletes much
slower than that in vacuum[126]. Nevertheless, there exist caveats for making such an
approximation. The electric conductivity here is extracted from the zero-frequency
mode of the spectral function. When having electromagnetic fields varying rapidly
with time, the higher-frequency modes should become dominant. Also, as pointed
out in [127], the diffusion equation relies on an unrealistic condition, where the electric conductivity is much larger than the inverse of the characteristic time scale of the
magnetic field. Although the precise lifetime of magnetic fields generated in heavy
ion collisions is undetermined, it is generally believed that the magnetic field drops
rapidly after the collisions.
19
1.5 Outline of the Dissertation
In this dissertation, we will utilize the AdS/CFT correspondence to investigate the
properties of strongly coupled plasmas and their influence on different probes, which
may facilitate our understanding of analogous scenarios in heavy ion collisions. For
jet quenching, most of the previous studies in holography have been focused on the
hard probes traveling in a thermalized and isotropic medium. We thus generalize the
studies for light probes to the cases of out-of-equilibrium conditions with and without
a chemical potential or in a thermal plasma with pressure anisotropy. On the other
hand, we also investigate the influence of pressure anisotropy upon thermal photons.
Motivated by the anomalous flow of direct photons observed by experiments, we
further analyze the thermal-photon production in both isotropic and anisotropic
backgrounds in the presence of a constant magnetic field. Moreover, by considering
a chiral plasma with an electric field, we investigate CESE in the strongly coupled
scenario. This dissertation emphasizes three significant effects on various probes in
heavy ion collisions: 1) thermalization effects, 2) pressure anisotropy, and 3) external
electromagnetic fields.
In addition to the review on the gauge/gravity duality in Chapter 2, the bulk
of this dissertation is based on my works with my collaborators, presented in Chs.
3-7[128, 129, 130, 131, 132, 133]. The dissertation is organized in the following order.
In Chapter 2, we make a brief review of the gauge/gravity duality and some essential techniques in holography, which will be applied or generalized in the following
chapters.
In Chapter 3, we present our studies related to holographic thermalization and
jet quenching in out-of-equilibrium conditions. We utilize the AdS-Vaidya metric describing a falling mass shell to investigate the thermalization of the strongly-coupled
plasma. By studying the gravitational redshift in Poincare coordinates, we may ap20
proximate the thermalization time of the medium in the thin-shell limit. In addition,
we compute the stopping distance of a massless particle traveling through the AdSVaidya spacetime in the Wentzel-Kramers-Brillouin (WKB) approximation, which
characterizes the jet quenching of a light probe in the non-equilibrium plasma. However, for an energetic probe carrying infinite energy, its stopping distance would not
be affected by the thermalization of the medium. In contrast, we study the stopping distance of a softer gluon described by the falling string. We find its stopping
distance in the thermalizing plasma is larger than that in the thermalized plasma,
which suggests that the jet quenching of a softer probe with the energy not infinitely
larger than the thermalization temperature should be suppressed by the thermalization process of the medium. Also, the enhancement of stopping distances is more
substantial for relativistic probes. Then we generalize our studies to the case with
a nonzero chemical potential by analyzing a falling shell with charge characterized
by the AdS-Reissner-Nordstr¨om-Vaidya (AdS-RN-Vaidya) geometry. We find that
the stopping distance decreases when the chemical potential is increased in both
AdS-RN and AdS-RN-Vaidya spacetimes, which correspond to the thermalized and
thermalizing media respectively. Moreover, we find that the soft gluon with an energy
comparable to the thermalization temperature and chemical potential in the medium
travels further in the non-equilibrium plasma. The thermalization time obtained here
by tracking a falling charged shell does not exhibit, generically, the same qualitative
features as the one obtained studying non-local observables. This indicates that
–holographically– the definition of thermalization time is observer dependent and
there is no unambiguous definition.
In Chapter 4, we employ the gauge/gravity duality to study the jet quenching of
light probes traversing a static yet anisotropic strongly coupled N = 4 SYM plasma.
We compute the stopping distance of an image jet induced by a massless source field,
which is characterized by a massless particle falling along the null geodesic in the
21
WKB approximation, in an anisotropic dual geometry introduced by Mateos and
Trancancelli(MT). At mid and large anisotropic regimes, the stopping distances of a
probe traveling in the anisotropic plasma along various orientations are suppressed
compared to those in an isotropic plasma especially along the longitudinal direction at
equal temperature. However, when fixing the entropy density, the anisotropic values
of stopping distances near the transverse directions slightly surpass the isotropic
values. In general, the jet quenching of light probes is increased by the anisotropic
effect in a strongly coupled and equilibrium plasma.
Next, we consider the thermal-photon production in the same anisotropic background. In order to include the effects from massive quarks, we work in the black hole
embeddings in the D3/D7 system. We find that the photon spectra with different
quark mass are enhanced at large frequency when the photons are emitted parallel
to the anisotropic direction with larger pressure. However, for photons emitted perpendicular to the anisotropic direction, the spectra approximately saturate isotropic
results.
In Chapter 5, we further investigate the influence of a constant magnetic field
on the thermal-photon production in the MT geometry. The photoemission rate
is increased for photons moving perpendicular to the magnetic field. Moreover, a
resonance emerges at moderate frequency for the photon spectrum with heavy quarks
when the photons move along that direction. The resonance is more robust when the
photons are polarized along the magnetic field. On the contrary, in the presence of
pressure anisotropy, the resonance will be suppressed. There exist competing effects
of magnetic field and pressure anisotropy on meson melting in the strongly coupled
SYM plasma, while we argue that the suppression led by anisotropy may not apply
to the quark gluon plasma. Motivated by the enhancement led by magnetic field,
we compute the elliptic flow v2 of thermal photons in the cases of a 2+1 flavor SYM
plasma analogous to the photon production in QGP, we obtain the thermal-photon
22
v2 , which is qualitatively consistent with the direct-photon v2 measured in RHIC at
intermediate energy. However, due to the simplified setup, the thermal-photon v2 in
our model should be regarded as an upper bound for the v2 generated solely by a
magnetic field in the strongly coupled scenario.
In Chapter 6, we investigate the chiral electric separation effect, where an axial current is induced by an electric field in the presence of both vector and axial
chemical potentials, in a strongly coupled plasma via the Sakai-Sugimoto model with
an U(1)R × U(1)L symmetry. By introducing different chemical potentials in U(1)R
and U(1)L sectors, we compute the axial direct current (DC) conductivity stemming
from the chiral current and the normal DC conductivity. We find that the axial
conductivity is approximately proportional to the product of the axial and vector
chemical potentials for arbitrary magnitudes of the chemical potentials. We also
evaluate the axial alternating current (AC) conductivity induced by a frequencydependent electric field, where the oscillatory behavior with respect to the frequency
is observed.
The last chapter will summarize the main results of the dissertation and discuss
some of the on-going efforts and future directions to improve our approaches and
shed more light on heavy ion physics via holography.
23
2
Review of the gauge/gravity duality
2.1 AdS/CFT Correspondence
The gauge/gravity duality or the so called AdS/CFT correspondence generally refers
to a duality between an d dimensional strongly coupled gauge theory and an d + 1
dimensional gravity theory in the curved spacetime. However, to be more precise,
it is based on a conjecture proposed by Maldacena that the N = 4 SU(N) supersymmetric Yang-Mills theory (SYM) in the large N limit is dual to the string
theory in a curved background with the AdS5 × S 5 geometry[41], where the S 5
could be reduced when the R symmetry is unbroken. The further studies have been
carried out in [42, 43, 44, 45]. More relevant works can be found in the review
articles[45, 48, 134, 12, 135] and the references therein.
Before beginning the discussion of the conjecture, we may briefly explain some of
the terminologies above. In the gauge theory side, the supersymmetric transformation in N = 4 SU(N) SYM theory is dictated by 32 supercharges encoded in four
sets of complex Majorana fermions, where the N denotes the number of such sets.
Also, the N = 4 SU(N) SYM theory as a conformal field theory (CFT) contains
24
one gauge field, four Majorana fermions, and six real scalars in the adjoint representation. In the gravity side, the AdSd+1 background represents an d + 1 dimensional
anti-de sitter space. Such a geometry can be described by a hyperboloid in the d + 2
dimensional space,
d
2
X02 + Xd+1
−
Xi2 = L2 ,
(2.1)
i=1
with the metric,
d
2
ds2 = −dX02 − dXd+1
+
dXi2 .
(2.2)
i=1
The metric now has a SO(2, d) isometry. By performing the proper coordinate
transformation:
X0
1
=
2r
d−1
2
2
1 + z (L +
i=1
X i = Lrxi ,
Xd =
1
2r
(xi )2 − t2 ) ,
Xd+1 = Lrt,
d−1
1 − r 2 (L2 −
(xi )2 + t2 ) ,
(2.3)
i=1
the metric can be rewritten as
2
2
ds = L
dr 2
+ r 2 (−dt2 +
r2
d−1
(dxi )2 ) ,
(2.4)
i=1
which are the so-called Poincare coordinates. For simplicity, we will henceforth
replace
d−1
i 2
i=1 (dx )
by (dxi )2 .
To understand the origin of such a conjecture, we should introduce the concept of
Dp branes. We will then discuss the properties of Dp branes from two perspectives.
Loosely speaking, we firstly analyze Dp branes from the gauge-theory side and then
from gravity side. Based on similar features from two perspectives, we conjecture the
25
duality of the corresponding gauge theory and gravity theory for Dp branes. In string
theory, Dp branes are p + 1 dimensional hypersurfaces that are the endpoints of open
strings. The open string endpoints should obey Dirichlet boundary conditions along
n − p − 1 dimensions for n being the number of dimensions of the full spacetime,
while the endpoints are allowed to move along the p + 1 dimensions on the worldvolume of Dp branes. In the presence of N coincident Dp branes, the endpoints
of an open string can locate on different Dp branes, which results in an N × N
matrix corresponding to the adjoint representation of U(N) symmetry. Essentially,
we can choose to decouple the U(1) gauge group from the SU(N) gauge theory in
the full U(N) symmetry. We may regard the ground states of these open stings
as the excitations of massless fields coupled to the Dp branes. More explicitly, the
Dp branes are described by the so-called Dirac-Born-Infeld(DBI) action which is a
generalization of the Nambu-Goto (NG) action,
SDp = TDp
dp+1 x −det(Gµν + 2πls2 Fµν ),
(2.5)
where TDp denotes the tension and Gµν denotes the induced metric of Dp branes.
Here Fµν represents the world-volume field strength coming from the gauge-field
excitation on the Dp branes and ls = α′1/2 corresponds to the typical string length.
In addition to the gauge-field, the Dp branes can also fluctuate along bulk directions,
which contributes to n − p − 1 scalar fields. Considering supersymmetry, there also
exist fermionic excitations to balance the bosonic degrees of freedom. In the low
energy limit, we may neglect the excitations of massive fields. Therefore, we have
one gauge field, n − p − 1 scalars, and corresponding massless fermions living on
the Dp branes. Here we are particularly interested in the p = 3 case. In the type II
superstring theories with 10 dimensional spacetime, the low-energy effective theory of
open strings living on D3 branes should incorporate one gauge field, four Majorana
fermions, and six real scalars, which corresponds to an N = 4 SYM theory with
26
SU(N) symmetry in the four dimensional spacetime.
On the other hand, there exist closed strings such as gravitons represented by
the fluctuations of the spacetime metric, which are not constrained to Dp branes and
free to propagate in the bulk. In general, the full action should be written as
Sf = Sbranes + Sbulk + Sint ,
(2.6)
where Sint contains the interaction between the open strings on the branes and the
closed strings in the bulk. We can expand the bulk action in powers of the gravitational constant κ ∼ gs ls4 , with gs being the string coupling, as
Sbulk ∼
1
2κ2
√
d10 x gR ∼
d10 x[(∂h)2 + κh(∂h)2 ],
(2.7)
where g = det(gµν ) and we expand the spacetime metric as gµν = ηµν + κhµν .
Although we only consider the graviton encoded by the spacetime metric here, other
terms including different fields should be expanded in the similar fashion. As shown
in (2.5), the interaction terms are encoded in the DBI action. For example, the
interaction between the spacetime metric and the world-volume gauge field on the
D3 branes in the κ expansion reads
Sint ∼
√
d4 x −gTr[F 2 ] + · · · ∼ κ
d4 xhµν Tr F µρ F νρ −
δ µν F 2
+ ....
4
(2.8)
Actually, the spacetime metric gµν in (2.8) should be replaced by the induced metric
Gµν on the D3 branes, while the expansion usually reduces to the same form. When
we fix energy and take ls → 0, which corresponds to κ → 0, we find that the interaction terms vanish. Therefore, the open strings and closed strings become decoupled
in such a limit. The bulk action ends up with free supergravity(i.e. gravitons propagate in the flat spacetime), whereas the D3 -brane action incorporates the N = 4
SYM theory living in the flat geometry with four spacetime dimensions.
27
Next, we may study the same system from a different point of view. The Dp
branes can carry charge and act as sources of bulk fields. In type II supergravity,
the semi-classical solution of D3 branes is given by [136]
ds2 = H −1/2 (−dt2 + d2 xi ) + H 1/2 (dr 2 + r 2 dΩ25 ),
C0123 = 1 − H −1 ,
(2.9)
where
H =1+
L4
,
r4
L4 = 4πgs ls4 Nc .
(2.10)
Here i = 1, 2, 3 denote the spatial dimensions on D3 branes, r represents the radial
coordinate transverse to the D3 branes, and C0123 is a four-form field coupled to D3
branes. The string coupling gs is now characterized by the ratio of a dimensionful
constant L and the typical string length ls . The metric component of −dt2 is regarded
as a redshift factor since there exists a horizon at r = 0. For an observer on the
boundary at r → ∞, the energy in the bulk reads
E=H
−1/4
Er =
L4
1+ 4
r
−1/4
Er ,
(2.11)
where Er is the energy measured by an observer at the bulk r. Due to the redshift
factor, the energy of an object measured by an observer at infinity becomes smaller as
it approaches the horizon(bottom of the throat) at r → 0. As a result, there exist two
types of low energy excitations measured by an observer at infinity. One corresponds
to massless fields propagating in the bulk with large wavelengths. Another type
results from the near-horizon excitations with arbitrary sizes. In the low energy
limit, these two types of excitations are decoupled. As shown in [137], the low
energy absorption cross section of the massless scalar field is given by
σabs =
π4 3 8
ω L,
8
28
(2.12)
where ω is the energy of the scalar field. The cross section vanishes as ωL ≪ 1,
which is the case for the field with a wavelength much larger than L. From (2.9), we
see that the redshift factor H → 1 of the spacetime metric in the bulk for r ≫ L.
Thus, we have free supergravity in the bulk region. In the near-horizon region for
r → 0, the spacetime metric reduces to
r2
L2
2
i 2
ds = 2 (−dt + (dx ) ) + 2 (dr 2 + r 2 dΩ25 ).
L
r
2
(2.13)
It is then more convenient to work in the coordinates with a finite boundary by
making the coordinate transformation z = L2 /r. The spacetime metric in (2.13)
becomes
ds2 =
L2
(−dt2 + (dxi )2 + dz 2 ) + L2 dΩ25 ,
z2
(2.14)
which is the AdS5 × S 5 geometry. Here L governs the radius of S 5 , which is usually
called the AdS radius.
By comparing the D3 -brane system from two points of view as discussed above,
we find that the bulk is governed by free supergravity in the low energy limit from
both perspectives. The remained parts are the SU(N) N = 4 SYM theory on
the D3 branes and the low energy excitations in the AdS5 × S 5 geometry. It is then
natural to conjecture the correspondence between SU(N) N = 4 SYM theory in four
dimensional spacetime and the supergravity in the AdS5 × S 5 background geometry.
A schematic representation of the AdS/CFT correspondence is shown in Fig. 2.1.
Although the spacetime is warped by the D3 branes located in the IR regime at the
horizon, we can further introduce the D3 probe branes on the boundary characterizing
the SU(Nc ) N = 4 SYM theory in the UV scale. In fact, the UV behaviors of
operators in the gauge theory side will be our primary concern. Moreover, the
correspondence can be further supported by the symmetries. The N = 4 SYM theory
29
Figure 2.1: Schematic representation of the AdS/CFT duality[11].
is a conformal theory, which preserves a SO(2, 4) symmetry from the combination
of the conformal symmetry and Lorentz symmetry. In addition, the R symmetry
for the N = 4 supercharge yields an additional SU(4) ∼ SO(6) symmetry. From
(2.14), we see that the AdS5 and S 5 backgrounds as well possess SO(2, 4) and SO(6)
isometries, respectively. The consistency of the symmetry of the SYM theory and the
isometry of the curved background further supports the correspondence. In general,
the S 5 can be further reduced. The AdS/CFT correspondence sometimes may simply
refer to the duality between the SYM theory in the four-dimensional spacetime and
the gravity in an AdS5 background with restrictions to a certain subsector of the
SYM theory. Subsequently, we should briefly discuss the regime of validity for this
correspondence. As mentioned in the κ expansion below (2.8), the decoupling limit
is reached by taking the typical string length ls → 0. From the gravity point of view
as shown in (2.11), the low energy limit with respect to the observer on the boundary
corresponds to L ≫ r. Now the only relevant scale in the system is the typical string
length. Such a limit for r ∼ ls ≪ L as well implies the small string length. From
(2.10), we see that the ratio L4 /ls4 is proportional to gs Nc . On the other hand, the
string coupling can be related to the YM coupling thorough[138],
2
λ = gYM
N = 4πgs N,
30
(2.15)
where λ is the so-called t’Hooft coupling. The correspondence working in the low
energy limit or equivalently the decoupling limit hence requires
L4
2
∼ 4πgs N ∼ gYM
N ≫ 1,
ls4
(2.16)
which suggests that the t’Hooft coupling for the SU(N) SYM theory has to be rather
strong. However, in order to approximate the superstring theory by supergravity, we
further entail the weak string coupling gs → 0. To satisfy both constraints, we have
to take N → ∞. As a result, the AdS/CFT correspondence is valid for the strongly
coupled N = 4 SU(N) SYM theory in the large N limit.
Technically, the AdS/CFT suggests an useful duality of bulk fields in gravity
and boundary operators in the field theory. The boundary value of a bulk field
corresponds to the source of a gauge-invariant operator. Schematically, the correspondence is written as
ZSYM [φ0 ] =
d4 xOφ0
= ZAdS5 [φ → φ0 ],
(2.17)
where ZSYM and ZAdS5 represent the generating functionals of the N = 4 SYM theory
in the four dimensional spacetime and the gravity theory in the AdS5 background,
respectively. The bulk field φ(z) acts as the source of an operator O on the boundary,
where φ(0) = φ0 . Generally, the contribution from S 5 is encoded in the overall
coefficient of the gravity action. The duality is nowadays generalized to arbitrary
dimensions, where a d dimensional strongly coupled gauge theory is dual to a d + 1
dimensional gravity theory. Furthermore, the mass of the bulk fields are connected
to the conformal dimensions of the field-theory operators. The relations depend on
31
the types of bulk fields. Here we list two of them[43, 139]:
√
1
scalar : ∆ = (d + d2 + 4m2 ),
2
1
vector : ∆ = (d +
2
(d − 2)2 + 4m2 ),
(2.18)
where ∆ denote the conformal dimensions of the dual operators and m represents
the mass of corresponding bulk fields. It is usually stated in the AdS/CFT context
that the gauge theory lives on the D3 branes on the boundary according to the operators/bulk fields duality. Rigorously speaking, these D3 branes should correspond to
the D3 probe branes mentioned previously instead of the D3 branes in the horizon as
the source of the warped geometry in the gravity dual since the correspondence between the open strings on the D3 branes and the near-horizon excitations is actually
found in the IR regime.
2.2 Holography at Finite Temperature
To study sQGP in thermal equilibrium, we have to introduce a finite temperature in
holography. In the gravity dual, the temperature and thermodynamics can be obtained from Hawking radiation of a black hole as prescribed by Witten[44]. In analogy
to finite temperature field theory, we have to work with the Euclidean signature by
making Wick rotation for the time coordinate, −it = tE . Then the temperature is
encoded in the periodic boundary condition for the Euclidean time via
tE = tE +
1
.
T
(2.19)
As mentioned in the previous section, the S 5 is usually reduced. We thus focus
on the five dimensional gravity action,
S=
1
16πG5
d5 x (Lgrav + Lmatter ) ,
32
(2.20)
where the volume of S 5 is encoded in G5 as the five dimensional Newton constant.
The gravity action consists of two parts. The gravitational part of the Lagrangian
density reads
Lgrav =
√
−g R +
12
L2
,
(2.21)
where g = det(gµν ) for gµν being the five dimensional spacetime metric. The matter
part of Lmatter consists of matter fields. In general, the spacetime metric should be
obtained from the extremization of the full gravity action, while the matter fields can
be treated as perturbations and their backreaction to the metric can be discarded in
some cases. By solving only the gravitational part in (2.21) without matter fields,
we find that the AdS5 geometry is one of the isotropic and homogeneous solutions.
Nonetheless, there also exists the solution with a black hole(brane) in the bulk, called
the AdS-Schwarzschild geometry. The scenario is rather similar to a black hole in
asymptoticly flat spacetime.
In AdS5 , the presence of a black hole should modify the spacetime metric in the
bulk and impose an IR cutoff since all objects inside the event horizon are causally
disconnected from the outer regime. Before dealing with the AdS-Schwarzschild
geometry, we may firstly show the derivation of temperature in a more general case
via Witten’s prescription. We may assume the modified metric takes the form,
ds2 = g(z)(f (z)dt2E + (dxi )2 ) +
L2
dz 2 ,
z 2 h(z)
(2.22)
with the conservation of four-momentum. In most of cases, f (z) = h(z) denotes the
so-called blackening function, which determines the position of the even horizon at
z = zh with f (zh ) = 0. Given that g(z) is well-defined at zh , the near-horizon metric
reads
2
′
ds |z→zh = g(zh )(−f (zh )(zh −
z)dt2E
L2
+ (dx ) ) − 2 ′
dz 2 ,
zh f (zh )(zh − z)
33
i 2
(2.23)
where the primes represent the derivatives with respect to z. By making the coordinate transformation,
ρ=
2L
zh
(zh − z)
,
−f ′ (zh )
τ =−
tE
zh
2L
g(zh )f ′ (zh ),
(2.24)
we can rewrite the asymptotic metric as
ds2 |z→zh = dρ2 + ρ2 dτ 2 + g(zh )(dxi )2 .
(2.25)
We see that the metric in (2.25) now has a conical singularity at ρ = 0. To avoid the
cone singularity, one should impose a periodic boundary condition as
τ = τ + 2π.
(2.26)
Combined with the period boundary condition for the Euclidean time in (2.19), the
temperature is now given by
T =−
zh f ′ (zh )
4πL
g(zh ).
(2.27)
We may now consider the AdS-Schwarzschild geometry, which is dual to the
isotropic and homogeneous N = 4 SU(Nc ) SYM on the boundary. In d = 4, the
AdS-Schwarzschild geometry is given by
L2
ds = 2
z
2
dz 2
−f (z)dt + (dx ) +
f (z)
2
i 2
,
(2.28)
where
f (z) = 1 − Mz 4 = 1 −
z4
,
zh4
(2.29)
with M = zh−4 being the mass of the black hole. Compared to (2.22), one easily
recognizes that here g(z) = L2 /z 2 . Without losing generality, we will set L = 1 as
34
the unit to measure all scales in our system. From (2.27), we derive the temperature,
T =
1
.
πzh
(2.30)
In addition, the entropy is determined by the area of the horizon. The area element
at t = constant and z = zh hypersurface is
1 1 2 3
dx dx dx .
zh3
(2.31)
AH
= π 2 Nc2 T 3 ,
4πV3
(2.32)
dAH =
The entropy density now reads
s=
where we use G5 = π 2 /(2Nc2 ). We can further derive the energy and pressure densities
by utilizing thermodynamic relations:
s=
∂P
,
∂T
ǫ = −P + T s.
(2.33)
The energy and pressure densities in the AdS-Schwarzschild spacetime then become
P =
1 2 4
N T ,
8π 2 c
ǫ=
3 2 4
N T .
8π 2 c
(2.34)
Notice that the conformal symmetry is preserved here from ǫ = 3P . One can show
that both P and ǫ in (2.34) are 3/4 times of the free N = 4 SYM gas, which agree
with the lattice data near the temperature in RHIC and LHC[38].
2.3 Adding Flavors
In analogy to QCD, the SU(N) gauge symmetry in the N = 4 SYM theory may
correspond to the SU(Nc ) color symmetry. Nonetheless, since all fields in the SYM
theory are in the adjoint representation, the SYM theory may only characterize
35
Figure 2.2: The dimensions of D3/D7 embedding, where 0, 1, 2, 3 denote the four
dimensional spacetime on the boundary.
the gluon degrees of freedom in QCD. In order to incorporate the quark degrees of
freedom, we have to further introduce matters in the fundamental representation.
In this section, we will briefly introduce the inclusion of matters in the fundamental
representation in the deconfined phase of the N = 4 SYM plasma in AdS/CFT.
From the top-down approach based on string theory, the inclusion of fundamental
matters can be realized by embedding flavor branes[140, 141]. Consider an open
string with one end fixed on the original D3 brane and one on the flavor brane, the
string hence possesses both the color and flavor in the fundamental representation.
Moreover, the separation between two branes on the boundary then lead to the
mass proportional to the tension of the string for such a fundamental matter. We
will henceforth call these fundamental matters quarks in the context. There are
different types of embeddings in string theory, while we will focus on the D3/D7
system[142, 143, 144] in the thesis. In such a system, Nf D7 branes are introduced,
which share the same spacetime dimensions as the Nc D3 branes on the boundary.
The D7 branes further wrap an S 3 in the S 5 and extend along the bulk direction.
The embedded dimensions in the D3/D7 system are simply shown in Fig.2.2. Now,
36
the radius of the S 3 is denoted by
r˜2 = (x4 )2 + · · · + (x7 )2 ,
(2.35)
which will shrink to zero at the endpoint of D7 branes in the bulk. Since the bulk
direction is r 2 = r˜2 + (x8 )2 + (x9 )2 , the separation between the D3 branes and the
D7 branes on the boundary reaches a maximum as r˜ → 0 on the boundary, which
gives a rise to infinite mass for a quark via the relation mq ∼
(x8 )2 + (x9 )2 |r→∞ .
Therefore, as the D7 branes end in the deeper part of the bulk, the quark mass
becomes smaller. For the case with the D7 branes extending all the way to r = 0,
the corresponding quarks will be massless, which is dubbed as the trivial embedding.
In the presence of a black hole, the situation will become more sophisticated.
There exist three types of embeddings as schematically depicted in Fig.2.3. As in
the case of the so-called Minkowski embedding, the D7 branes end above the horizon in the bulk. The corresponding quark mass will be greater than the critical
mass mc (or equivalently the critical temperature Tc ) and the embedding hence characterizes the confined phase. For the black hole(BH) embedding, the D7 branes
then terminate below the horizon, which corresponds to the deconfined phase with
mq < mc . The part inside the black hole will be causally disconnected from the
region outside. When the endpoint of D7 branes approximately coincides with the
horizon as the critical embedding, the first order phase transition occurs[145]. It has
been shown in [145] that the free energy around this region is degenerate and the
critical embedding is thus unstable. In this thesis, we will present the computations
of the thermal-photon production in various backgrounds. Since sQGP is in the
deconfined phase, we will only emphasize the BH embedding. In general, the embedding of flavor branes should lead to backreaction to the background geometry which
complicates the computations. Therefore, the probe brane approximation based on
the assumption that Nf ≪ Nc is usually taken to discard the backreaction.
37
Figure 2.3: Schematic representation of different types of embeddings[12].
23 2 ls 2 Mq
T
1.2
1.0
0.8
0.6
0.4
0.2
0.2
0.4
0.6
0.8
Ψ0
Figure 2.4: The mass as a function of ψ0 modified from[13].
We may now make a concrete example by considering the BH embedding in
the D3/D7 system with the AdS-Schwarzschild background[143, 145, 144]. As mentioned above, The flavor D7 brane extended into the bulk shares the same spacetime
dimensions with the D3 brane on the boundary and wraps an S 3 inside the S 5 ,
dΩ25 = dθ2 + sin2 θdΩ23 + cos2 θdη 2 ,
(2.36)
where θ and η represent the polar coordinates of the x8 and x9 directions. The flavor
D7 brane is characterized by the Dirac-Born-Infeld (DBI) action,
S = −Nf TD7
D7
d8 x −det(G),
(2.37)
where G is the induced metric on the D7 branes and TD7 = (2πls )−7 (gs ls )−1 is the
38
D7-brane string tension. For the nontrivial embedding, the radius of the S 3 denoted
by sin θ is a function of the bulk direction. Here we use u to replace z as the bulk
direction, where u = 0 corresponds to the boundary. In Chapter.4 and Chapter.5,
we will generalize the computations in this section to the case with an anisotropic
background, where z will be assigned to the anisotropic direction. Therefore, we
will set u as the bulk direction in this section and in Chapter.4 and Chapter.5. The
induced metric now is given by
ds2D7 =
1 − ψ(u)2 + u2 f (u)ψ(u)′2 2
1
2
2
2
2
−f
(u)dt
+
dx
+
dy
+
dz
+
du
u2
u2 f (u)(1 − ψ(u)2 )
+(1 − ψ(u)2)dΩ23 ,
(2.38)
1 − ψ(u)2 = sin θ represents the radius of the internal S 3 wrapped by the
where
D7 branes. The DBI action in (4.30) can be explicitly written as
S = −KD7
dtd3 xdu
(1 − ψ 2 )
u5
(1 − ψ 2 + u2 f ψ ′2 ),
(2.39)
where the prefactor KD7 includes the integration over the internal space Ω3 wrapped
by the D7 branes. The embedding function ψ can be solved by extremizing the DBI
action, which give a rise to the equation of motion as
ψ +
f′ 3
4uf
−
ψ′ −
f
u
(1 − ψ 2 )
−
3
ψ 3 = 0.
2
−ψ )
′′
uf ′
1−
8f
3
4ψ ′ u2 f
ψ (u) + 2
1+
u f (1 − ψ 2 )
3
′
3
ψ
(2.40)
u2 f (1
Since the equation in (2.40) is nonlinear, we can only solve it numerically. However,
by taking the near-boundary expansion, one can show that
ψ(u)|u→0
u3
= m 1/2 + c 3/2 3 + . . . ,
2 uh
2 uh
u
39
(2.41)
where the dimensionless coefficients m and c are related to the magnitudes of quark
mass and condensate through [143, 145]
Mq
O
√
m
λm
= 3/2 2 =
,
2 πls uh
2πuh
=
−23/2 π 3 ls2 Nf TD7 u−3
h c
=−
√
λNc Nf
c.
8π 3 u3h
(2.42)
In the black-hole embeddings, the values of m and c depend on the boundary conditions of the embedding functions on the horizon, where we take ψ(uh ) = ψ0 and
ψ ′ (uh ) = (−3u−2 ψ/f ′ )|u=uh [143, 144]. The ψ ′ (uh ) here is directly obtained from the
equation of motion in (2.40) near the horizon. As shown in Fig.2.4, the quark mass
increases as ψ0 is increased, while the increase ceases as ψ0 = ψc as the critical value
of ψ0 near the critical embedding at ψ0 = 1. The corresponding mass Mc for ψ0 = ψc
could be approximated as the critical mass for which the phase transition occurs.
More rigorous investigation of the first order transition near the critical embedding
is presented in [145], where the condensates and free energy become degenerate with
respect to the quark mass. In the following chapters, we will further generalize the
D3/D7 system to an anisotropic background and incorporate an external magnetic
field.
40
3
Jet Quenching and Holographic Thermalization
The work in this chapter was first published in [128, 129]. As discussed in Section
1.3, the thermal plasma in the gravity side is characterized by an asymptotic AdS5
geometry induced by a black hole. Therefore, the thermalization process of the
strongly coupled N = 4 SYM theory may be characterized by the formation of a
black hole in the gravity dual in the AdS/CFT correspondence. In [25, 26], the
scenario of the gravitational collapse is characterized by the AdS-Vaidya metric at
the thin-shell limit, which describes an infinitesimally thin shell falling in the AdS5
background. It is shown in [63] that the AdS-Vaidya metric comes from the leading
order perturbation led by a time-dependent and weak dilaton field on the boundary.
Eventually, the shell approximately forms an event horizon and the exterior of the
shell, which characterize the medium of the plasma, then reaches thermal equilibrium.
To find the thermalization time of the medium, the authors in [25, 26] compute
different non-local operators in Eddington-Finkelstein(EF) coordinates to probe the
backreaction of the shell to the spacetime. The approach is generalized to the study of
a non-equilibrium plasma with nonzero chemical potential by introducing a charged
41
shell in [146].
In this chapter, our primary goal is to estimate the influence led by the thermalization of the medium on the light probe. We proceed by investigating the null geodesic
of a massless particle falling in the AdS-Vaidya spacetime, as a means of getting the
stopping distance for the probe traversing a non-equilibrium and strongly coupled
plasma. On the other hand, we track the falling shell to approximate the thermalization time defined as the time when the shell roughly reach the future horizon.
This is an alternative approach to measure the thermalization time of the medium
compared to the thermalization time extracted from the thermalization of non-local
operators with a length scale about the inverse of the thermalized temperature.
This chapter is organized as follows. In Section 3.1, we firstly present the derivation of an analytical expression of the AdS-Vaidya metric in Poincare coordinates
in the thin-shell limit. By tracking the position of the shell, we are able to monitor the thermalization of the medium. In Section 3.2, we study the jet quenching
of a colorless probe (e.g. a virtual photon) in the field theory. For such a probe,
its stopping distance is determined by its 4-virtuality. According to AdS/CFT correspondence these jets are sourced by some supergravity fluctuation. For a highly
energetic jet with a small 4-virtuality, the supergravity fluctuation/wave packet can
be treated in a WKB approximation and approximated as a massless particle falling
from the boundary following a null geodesic. We track the falling shell and the
massless particle moving along the null geodesic in the AdS-Vaidya spacetime and
compute the stopping distance of this light probe. In Section 3.3, we will carry out
the same approach to compute the stopping distance of soft gluons characterized by
falling strings in the AdS-Vaidya spacetime. In Section 3.4, we will generalize our
study to the non-equilibrium background with a chemical potential and evaluate the
thermalization time by tracking a falling charged shell. In Section 3.5, we further
investigate the jet quenching for virtual gluons in the both thermalized and thermal42
izing backgrounds with chemical potentials. Finally, we conclude and discuss about
the thermalization time with chemical potentials in the last section.
3.1 The Falling Mass Shell in the AdS-Vaidya Spacetime
In [63], the AdS-Vaidya metric is generated by a time-dependent and weak dilaton
field in EF coordinates. However, in this section, we will convert the AdS-Vaidya
metric with a step-like mass function of the shell into Poincare coordinates in the
thin-shell limit in the AdSd+1 background. We will not solve the dilaton profile
which generates certain mass function here in the AdS5 , while we leave the complete
analysis in the case of the AdS4 in the appendix, where more discussion about the
validity of the AdS-Vaidya metric can be found. We assume that the major features
should not depend on the dimensionality of the spacetime.
The mass function of the shell should characterize the gravitational collapse; thus,
it should behave as a step function in the thin-shell limit. Here we take the mass
function proposed in [25, 26],
m(v) =
M
2
1 + tanh
v
v0
,
(3.1)
where v is the EF time coordinate as a function of t and z in the Poincare coordinates
for z being the fifth dimension. Here M denotes the full mass of the shell, which
determines the position of the future horizon by zh = M −1/4 , and v0 denotes the
thickness of the shell. The thermalization temperature is also encoded by the position
of the future horizon via T = (πzh )−1 . At the thin-shell limit v0 → 0, the spacetime
will be separated into two regions, the exterior of the shell for v > v0 and the
interior of the shell for v < v0 , where the two regions are governed by different
spacetime geometries. To further simplify the computation, we apply a quasi-static
approximation by chopping the spacetime into different time slices. At each time
43
slice, we study the z dependence of the metric and then glue all slices together by
tracking the position of the center of the falling shell as a function of time. Given
the position of the shell, we are able to approximate the thermalization time of the
medium.
We should begin with the AdS-Vaidya metric in AdSd+1 background in terms of
EF coordinates,
ds2 =
1
−f (v, z)dv 2 − 2dvdz + dx2i ,
z2
(3.2)
in which f (v, z) = 1 − m(v)z d and xi represent the d dimensional spacetime coordinates by setting the AdS curvature radius L = 1. Later we will take d = 4 as
an example, but here we leave d undefined for generality. By rewriting the EF time
coordinate v in terms of t and z in Poincare coordinates
dv = g(t, z)dt −
1
dz,
f (v, z)
(3.3)
(3.2) becomes
ds2 =
1
z2
−f (v, z)g(t, z)2 dt2 +
dz 2
+ dx2i .
f (v, z)
(3.4)
Here g(t, z) is an unknown function expressing the redshift factor of the nonzero
gravitational potential inside the shell for an observer on the boundary. From (3.3),
when v(t, z) = vc = const for vc representing the center of the shell, the t coordinate
will be a function of z even though the function g(t, z) is unknown; hence the t
coordinate can be written as a function of the position of the center of the shell in
the z coordinate, denoted by z0 . More explicitly, we have
∂z0
∂t
= g(t, z0 )f (vc , z0 ).
v=vc
44
(3.5)
For an arbitrary z0 , v(t(z0 ), z = z0 ) = vc must be satisfied and fixing z0 is equivalent
to fixing t. At the thin-shell limit, we may set vc = v0 = 0. By revisiting (3.3) at fixed
z0 (fixed t), we can write down the differential equation encoding the z dependence
of v(t, z),
∂v(t(z0 ), z)
∂z
z0
=−
1
,
f (v, z)
(3.6)
where we use the center of the shell to represent the position of the shell. The above
differential equation with the boundary condition, v(t(z0 ), z = z0 ) = vc = 0, can be
solved numerically without making further approximations and the v coordinate can
thus be expressed in terms of z at fixed t. However, to derive the full solution of v
with the varying t(z0 ), we have to solve g(t, z). Since the mixed derivatives of v with
respect to t and z should commute, we have
∂g(t, z)
∂z
=
t
∂f (v, z)
∂t
where we use the chain rule
z
∂f (v,z)
∂t
1
=
f (v, z)2
z
=
∂f (v,z)
∂v
∂f (v, z)
∂v
z
∂v(t,z)
∂t
z
z
g(t, z)
,
f (v, z)2
=
∂f (v,z)
∂v
(3.7)
z
g(t, z) to
derive the second equality. We may rewrite (3.7) into integral form by taking the
integration from the boundary to the position zp at fixed t(z0 ),
zp
g(t(z0 ), zp ) = g0 (z0 ) exp
0
dz
f (v(t(z0 ), z), z)2
∂f (v, z)
∂v
,
(3.8)
z
where g0 (z0 ) = g(t(z0 ), 0) represents the redshift factor on the boundary. This integral can be computed by inserting the solution of v(t(z0 ), z) at fixed t(z0 ) in (3.6).
For the region outside the shell, the spacetime is governed by the AdS-Schwarzschild
metric, which imposes g0 (z0 ) = 1. By setting f (v, z) = 1 − m(v)z 4 at d = 4, (3.8)
can be written as
zp
g(t(z0 ), zp ) = exp −
0
dzz 4
dm(v)
.
2
(1 − m(v)z 4 ) dv
45
(3.9)
In the thin-shell limit, the derivative of m(v) with respect to v in (3.9) is highly
localized at z0 ; thus we find g(t(z0 ), zp ) = 1 for zp < z0 as expected. For zp > z0 ,
g(t(z0 ), zp ) is a constant, which can be derived from (3.5) by assuming two surfaces
of the shell fall with the same velocity. Since g(t, z) = 1 for z < z0 plus m(v) = M
and m(v) = 0 for z < z0 and z > z0 , respectively, we find that g(t, z) = 1 − Mz04 for
z > z0 in the thin-shell limit. More generally, the integral in (3.8) can be computed
by inserting the solution of v(t(z0 ), z) at fixed t(z0 ) into (3.6), which yields
f (v,zp )
g(t(z0 ), zp ) = g0 (z0 ) exp −
f (v,0)
df (v, z)
.
f (v, z)
(3.10)
In the thin-shell limit, since the blackening function inside the shell reduces to one,
the redshift factor inside the shell only depends on the blackening function outside
the shell. The AdS-Vaidya metric in Poincare coordinates is then given by
2
ds =
1
z2
1
z2
−F (z)dt2 +
dz 2
F (z)
+ dx2
if v > 0(z < z0 ),
(3.11)
(−F (z0 )2 dt2 + dz 2 + dx2 ) if v < 0(z > z0 ),
where F (z) = 1 − z 4 /zh4 . The bulk is separated into two regimes; the exterior of
the shell for z < z0 is governed by the AdS-Schwarzschild geometry and the interior
for z > z0 is characterized by the quasi-AdS spacetime. More discussions about the
computation of the redshift factor g(t(z0 ), zp ) are presented in Appendix A.3.
By using (3.5), the position of the shell is characterized by
z0
t0 =
dzs
0
1
zh
=
tan−1
F (zs )
2
z0
zh
+ tanh−1
z0
zh
.
(3.12)
Due to the gravitational redshift, it takes infinite time for the shell to exactly coincide
with the horizon. The trajectory of the falling shell can be found in Fig.A.8 by taking
zh = 1. We may define the thermalization time as tth = t0 |z0 =0.99zh . By using (3.18),
46
we find the thermalization time in the unit of temperature tth T = 0.55. In [26], tth T ≈
0.5 when the length scale of the non-local operator for probing the thermalization
of the medium is about the inverse of the thermalization temperature; the value
is approximately consistent with the result we obtain. In [27], it is found that the
viscous hydrodynamics applies for tth T ≥ 0.6−0.7, which leads to the thermalization
time close to our result despite the different definition of the thermalization in their
approach. It is generally believed that the thermalization time should be within 0.1
fm/c to 1 fm/c at the RHIC energy. By taking T ≈ 300 MeV about the temperature
at RHIC, the possible range of the thermalization time in the unit of temperature is
given by 0.15 ≤ tth T ≤ 1.52, which basically covers all above results obtained from
different holographic models.
3.2 Jet Quenching of Colorless Probes in the Non-equilibrium Plasma
To investigate the influence of the thermalization process of the medium on the
jet quenching of light probes, we are interested in the stopping distance in the AdSVaidya geometry. We apply the approach in [105], where a localized R-charge current
generates high momentum wave packet of a massless field propagating from the
boundary to the bulk. When the wave function of the massless field penetrates the
horizon, the induced jet on the boundary dissipates and reaches thermal equilibrium
in the medium. The jet is the holographic image on the AdS boundary of the wave
packet propagating in the bulk [147]. By applying the WKB approximation, the
wave function of the bulk field is approximated as a massless particle falling along
a null geodesic. As showed in [105], the trajectory of the massless particle in the
thermalized medium governed by the AdS-Schwarzschild geometry can be written as
zp
x1 (zp ) =
0
zp
dz
ω2
|q|2
− F (z)
1/2
47
dz
=
0
z4
zh4
−
q2
|q|2
1/2
,
(3.13)
where the particle carries the four-momentum qi = (−ω, |q|, 0, 0) and q 2 = −ω 2 + |q|2
represents its virtuality. The stopping distance is thus given by x1 (zh ).
In the previous section, we have derived the AdS-Vaidya metric in Poincare coordinates in the thin-shell limit. Nevertheless, in the thin-shell limit, the massless
particle just travels outside the shell when the particle is ejected from the boundary
after the injection of the shell. The falling shell may characterize the top-down scenario of the thermalization starting from the ultraviolet scale to the infrared scale of
the medium. In this case, the trajectory of the particle moving in the AdS-Vaidya
spacetime should be the same as that in the AdS-Schwarzschild spacetime. Even
though we may assume the energetic probe is created slightly before the thermalization of the medium, the redshift effect is negligible near the boundary and thus the
probe should feel like moving in the pure AdS geometry at the early time. Since the
shell falls with the speed of light, the particle will then travel most of time outside
the shell and behave as in the thermalized medium.
However, when the shell has finite thickness, the same expectation is not obvious
although we will find that the result turns out to be the same. To track the null
geodesic of the massless particle amid the shell in Poincare coordinates is technically
difficult, because the trajectory of the particle is continuously deflected by interactions with the shell. Despite the information about the thermalization time of the
probe, it is easier to compute the stopping distance of the probe in EF coordinates.
By using the metric in (3.2) at d = 4, the geodesic equations are given by
d2 v
+ Γvvv
dλ2
dv
dλ
2
d2 z
+ Γzvv
dλ2
dv
dλ
2
d2 x1
+ 2Γ1z1
dλ2
dz
dλ
+
Γv11
+
2Γzvz
dx1
dλ
dx1
dλ
dv
dλ
2
=0
dz
dλ
= 0,
+
Γz11
dx1
dλ
2
+
Γzzz
dz
dλ
2
= 0,
(3.14)
48
where
Γvvv =
1
1
(1 + m(v)z 4 ), Γv11 = − ,
z
z
Γzvv = −
1
z
1 dm(v)
1 − m(v)2 z 8 + z 5
2
dv
,
1
2
Γzvz = − (1 + m(v)z 4 ), Γzzz = − ,
z
z
Γz11 =
1
1
(1 − m(v)z 4 ), Γ1z1 = − .
z
z
and λ is the affine parameter. Also, the mass function is defined as
m(v) =
M
2
1 + tanh
v
1
−
v0 2
,
(3.15)
where the shift in the hyperbolic-tangent function is to fit the setup shown in Fig.3.1
and the future horizon is determined by zh = M −1/4 . We notice that only the
momentum q1 along the x1 direction is conserved in EF coordinates, where we set
the momenta along the x2 and x3 directions to be zero. We define the conserved
1
momentum as q1 = |q| = z −2 dx
. Next, we can rewrite the geodesic equations in
dλ
terms of the derivative with respect to x1 ,
dxµ
dxµ dx1
=
= z 2 |q|x′µ ,
dλ
dx1 dλ
d2 xµ
= |q|2 z 2 (x′′µ z 2 + 2zz ′ x′µ ),
dλ2
(3.16)
where the prime denotes a derivative with respect to x1 . By inserting (A.24) into
the geodesic equations, we find that the last equation in (A.20) is automatically
satisfied due to the conservation of the momentum along the x1 . To solve other two
geodesic equations in (A.20), we have to introduce the proper initial conditions. Even
though the energy of the particle is not conserved in the AdS-Vaidya spacetime, the
49
gravitational effect caused by the falling shell is negligible at early times. Therefore,
we may write down the initial conditions under the pure AdS metric. For a particle
ejected from the boundary, we have
z|x1 =0 = v|x1=0 = t|x1 =0 = 0,
v ′ |x1 =0 = (t′ − z ′ )|x1 =0 =
z ′ |x1 =0 =
ω02 − |q|2
,
|q|
ω0
−
|q|
ω02 − |q|2
,
|q|
(3.17)
j
where we use the four-momentum defined in Poincare coordinates qi = gij dx
=
dλ
(−ω0 , |q|, 0, 0). We will further assume that the particle has small virtuality, which
implies |q| ≈ ω0 as required for the WKB approximation. The trajectory of the massless particle traveling in the AdS-Vaidya spacetime with a thick shell and that in the
thin-shell limit are shown in Fig.3.2. It turns out that the two results match closely
and are indistinguishable on the plot, which shows that the thermalization of the
hard probe is not influenced by the detail structure of the non-equilibrium medium.
In addition, the two trajectories also coincide with that in AdS-Schwarzschild spacetime. Because the energy of the massless particle in the WKB approximation is
much larger than any other scale in this scenario, its stopping distance is unaffected
by the thermalization process.
When the thickness of the shell becomes comparatively large with respect to the
inverse of the temperature (v0 ≈ zh = (πT )−1 ), the null geodesic in the AdS-Vaidya
spacetime may receive a slight correction compared to that in the AdS-Schwarzschild
spacetime. Nonetheless, such a thick shell would jeopardize the validity of the AdSVaidya metric as mentioned in Appendix 3.1. The thickness of the shell is a typical
time scale for the injection of energy from the boundary. In the analogue of QGP
produced in heavy ion collisions, the thickness of the shell may be characterized by
50
the inverse of the parton saturation scale Qs in the colliding nuclei, which should be
much greater than the temperature of the medium. Although the analogue here is
coarse, it may support the small thickness of the shell from a physical point of view.
z
qAdS
z
shell
1.0
0.8
0.6
AdS − SS
0.4
0.2
t
v0
t=0
Figure 3.1: The scenario of a massless
particle ejecting from the boundary as
the shell starts to fall, where v0 denotes
the thickness of the shell and the solid
red curves and the dashed red curve
represent the surfaces and the center of
the shell, respectively. The dashed arrow denotes the massless particle as a
hard probe falling from the boundary
at t = 0.
1
2
3
4
x1
Figure 3.2: The red, blue, and
green curves represent the trajectories of particles falling in the AdSSchwarzschild spacetime and in the
AdS-Vaidya spacetime with v0 = 0.2
and v0 = 0.0001, respectively. Three
curves coincide and cannot be distinguished. Here we take |q| = 0.99ω0 and
zh = 1.
Although we have found the trajectory of the massless particle falling in the
AdS-Vaidya spacetime in EF coordinates, it is interesting to further analyze the
interaction between the shell and the massless particle, which will also be useful when
studying stopping distances of soft gluons in the following section. For simplicity, we
consider the AdS-Vaidya geometry in Poincare coordinates in the thin-shell limit. In
(3.44), we may define a new time coordinate dt˜ = F (z0 )dt inside the shell. Then the
metric inside the shell reduces to the pure AdS geometry. By extending (3.13), the
trajectory of the massless particle in the AdS-Vaidya spacetime will be given by
zc
1
x (zp ) =
0
zp
dz
ω
˜2
|q|2
−1
1/2
dz
+
zc
51
ω2
|q|2
− F (z)
1/2
,
(3.18)
if we eject the massless particle prior to the presence of the falling shell. Here zc is the
collision point where the particle crosses the shell. For the massless particle in the
quasi-AdS spacetime inside the shell, we define its four-momentum in terms of the t˜
coordinate as p˜µ = (−˜
ω , |q|, 0, 0) and thus p˜z =
ω
˜ 2 − |q|2 . We may convert them
into t and z coordinates, pµ = (F (z0 )˜
p0 , p˜1 , 0, 0) and pz =
p˜20 F (z0 )−2 − p˜21 . While
for the massless particle in the AdS-Schwarzschild spacetime outside the shell, we
define qµ = (−ω, |q|, 0, 0) and thus qz (z) = F (z)−1
ω 2 − F (z)|q 2 |. Since the three-
dimensional spatial momentum is always conserved, we only have to focus on the
matching between the momentum along the t and z coordinates. In this scenario,
the particle firstly moves in the quasi-AdS geometry for a short period and then
transitions into the AdS-Schwarzschild spacetime. Since the shell is homogeneous
along the spatial direction, the particle may only exchange the energy with the shell
in the collision.
To find the energy change of the particle in the collision, we have to construct
a matching condition, in analogy of Snell’s law, to relate ω
˜ and ω. In the WKB
approximation, the wave function of the massless field is given by
ΨWKB = exp i
qµ dxµ .
(3.19)
By assuming the continuity of the wave function at the collision point and using the
conservation of the spatial momentum, we have
(−ωdt + qz dz)|zc− = (−˜
ω dt˜ + p˜z d˜
z )|zc+ ,
(3.20)
where qz and p˜z are the momenta along the fifth dimension defined in the exterior
and the interior of the shell, respectively. By doing some algebra, (3.20) can be
further written as
− ω + F (zc )qz |zc = F (zc )(−˜
ω + p˜z |zc ).
52
(3.21)
This equation serves as the matching condition encoding the energy change of the
massless particle penetrating the thin shell. Since ω
˜ remains constant in the quasiAdS spacetime, it represents the initial energy ω0 of the massless particle. Thus,
from (3.21), the energy change should be characterized by the ratio
√
1
ω
√
[2F (zc )(1 − 1 − δ 2 ) + δ 2 (1 − F (zc ))],
=
ω
˜
2(1 − 1 − δ 2 )
(3.22)
where δ = |q|/˜
ω . As shown in Fig.3.3, the ratio decreases when the collision point
is away from the boundary. When the massless particle crosses the shell, it loses
a certain amount of its energy. In the thermalization process, the virtuality of the
massless particle is reduced and it may travel further than in a thermalized medium.
This scenario should become robust only when the massless particle is ejected long
before the presence of the shell due to the small virtuality of the probe. Physically,
we thus expect the thermalization will lead to suppressed radiation of the light probe.
Nonetheless, when the light probe carries small virtuality, the effect would be negligible. This scenario will then be different when we introduce a soft probe as shown
in the next section.
ΩΩ
1.0
0.9
0.8
0.7
zc
0.2
0.4
0.6
0.8
1.0
Figure 3.3: The energy ratio with respect to the collision point zc , where δ = 0.99
and zh = 1.
53
3.3 Jet Quenching of Virtual Gluons in the Non-Equilibrium Plasma
In the gravity dual, a suitable candidate for a color probe would be the double string
with two ends fixed on the D-branes far below the future horizon, which corresponds
to an energetic gluon [103]. In this setup, the tip of the double string comes out of
the future horizon and encodes the initial energy of the virtual gluon. The tip of
the string should finally fall into the future horizon within the thermalized medium,
in which the gluon loses all its energy in the plasma. By tracking the trajectory
of the tip, we are able to investigate the stopping distance of the gluon before it
thermalizes. We will assume that the tip of the string travels along the null geodesic,
which leads to the maximum stopping distance.
x1
x1
zs
zs′
v˜
zs
zs′
zh
zh
z
z
Figure 3.4: A schematic figure for the
sting profile in AdS-Vaidya spacetime
before colliding with the shell.
Figure 3.5: A schematic figure for the
sting profile in AdS-Vaidya spacetime
after colliding with the shell.
In this section, we will follow the approach in [103] to compute the maximum
stopping distance led by the falling massless particle characterizing the tip of the
string in the AdS-Vaidya spacetime in the thin-shell limit.
Before tracking the trajectory of the massless particle and computing the stopping
distance by employing the null geodesic equations in (3.18), we have to specify the
initial values for the four-momentum of the massless particle. As shown in [103],
these initial values are determined by the initial profile of the falling string. Since
54
the gluon represented by the string is created in the pre-thermalized state governed
by the quasi-AdS metric in the gravity dual, the string profile is different from that
in the thermalized medium. By using the appropriate time coordinate dt˜ = F (z0 )dt
for the metric inside the shell, we find that the initial profile of the string is a straight
string. We thus set x1 = v˜t˜ and choose σ α = (t˜, z) as the world sheet coordinates.
Then the Nambu-Goto action is given by
−1
S=
2πα′
√
−1
dt˜dz −h =
2πα′
dt˜dz
√
1 − v˜2
, where hαβ = gµν ∂α X µ ∂β X ν(3.23)
.
z2
Here hαβ represents the worldsheet metric and α, β represent the worldsheet directions. This action yields the following momentum density and momentum of the
string
πµ0 =
∂L
−1
√
(1, −˜
v , 0, 0, 0) ,
= (πt˜0 , πx01 , πx02 , πx03 , πz0 ) =
µ
′
2
∂ x˙
2πα z 1 − v˜2
zh
pµ = 2
zI
dzπµ0 =
1 − zI /zh
√
(−1, v˜, 0, 0, 0) ,
πα′ zI 1 − v˜2
(3.24)
where x˙ µ = (dxµ /dt˜) and zI represents the initial position of the tip of the string. In
the second equation, the factor of two in front of the integral comes from the double
string and we set an infrared cutoff at the future horizon.
Since the endpoints of the string are located at infinity, the string should be
approximately straight when the falling velocity of the tip is not too large. In this
case, all pieces of the string except for the part at the infinity approximately fall
parallely as a null string. Therefore, the four-momentum of the massless particle is
proportional to the four-momentum of the string. We then have
q˜i
pi
=
= −˜
v,
q˜0
p0
(3.25)
and the string should remain straight for an observer inside the shell as illustrated in
Fig.3.4. Although it is indicated in [102, 103] that the determinant of the worldsheet
55
metric should vanish for a null string, the trailing string solution would match the
falling string only when v˜ = 1. We may choose v˜ ≈ 1, for which the trailing
string solution approximates the null string solution, while the Lorentz factor γ =
√
1/ 1 − v˜2 stays finite. In this limit, the massless particle has small virtuality and
falls slowly along the z-direction, which satisfies our previous assumption that the
falling velocity cannot be too large. We will discuss more about this scenario in
Appendix A.4. After the tip of the string collides with the falling shell and partially
enters the AdS-Schwarzschild spacetime, the tip of the string may still move along
the null geodesic, whereas the rest part in the medium would be trailed by the
backreaction of the spacetime metric led by the shell. Despite the profile of the
string outside the shell being sophisticated, the rest part inside the shell should
remain unchanged because the wave velocity of the string in the quasi-AdS spacetime
is slower than the velocity of the falling shell, which falls with the speed of light. The
calculation of the wave velocity by studying the perturbation of the straight string
can be found in Appendix A.5. As a result, the string inside the shell is causally
disconnected to the disturbances outside. The schematic profile of the falling string
after the collision is depicted in Fig.3.5.
After pinning down the initial conditions of the massless particle representing
the tip of the string, we may implement the geodesic equation in (3.18) to track the
trajectory of the falling particle. Similar to the scenario of the falling wave packet in
the WKB approximation, we have to set up the matching condition to connect the
ω
˜ and ω defined in two spacetimes at the collision point where the particle crosses
the falling shell, while the approach here should be independent of the matching of
wave functions.
In the thin-shell limit, H(t, z) = z − z0 (t) = 0 denoting the position of the shell
is a hyper-surface. When the massless particle crosses the surface, we may use the
conservation of the momentum tangent to the surface, which results in the matching
56
condition. We now write down the normal vector of the shell,
Uµ = ∂µ H(t, z) = (−dz0 /dt, 1) = (−F (z0 ), 1) ,
(3.26)
where µ = 0, 1 denote the t and z directions. By taking V µ Uµ = 0 for V µ being the
tangent vector, we subsequently obtain
V µ = (1, F (z0 )) .
(3.27)
We then use qµ and pµ introduced in the previous context to denote the four-momenta
of the particle outside and inside the shell, respectively. By using the matching
condition that qµ V µ = pµ V µ at the collision point zc , we obtain
q0 + qz (zc )F (zc ) = p0 + pz F (zc ) = p˜0 F (zc ) + p˜z F (zc ) .
(3.28)
By writing it in terms of ω and ω
˜ , we have
− ω + qz (zc )F (zc ) = −˜
ω F (zc ) + p˜z F (zc ) ,
(3.29)
which matches (3.21) and leads to the same energy ratio in (3.22). When the shell is
null, the derivation is equivalent to the matching of propagating bulk fields in [148]
except for the difference in redshift factors.
There is a caveat here: the energy loss of the massless particle representing the
tip of the string as a function of the collision point does not correspond to the total
energy loss of the string. Only in the case of the null string, the energy loss of the
massless particle and that of the falling string would be equivalent since all pieces of
the string can be approximated as massless particles moving along the null geodesics
coherently. In fact, for an observer on the boundary in the t coordinate, the string
actually decelerates and thus loses energy in the quasi-AdS spacetime when the shell
falls. In general, to analyze the instantaneous energy loss entails the understanding
of the full string profile, which could not be easily solved when the string crosses the
shell; therefore we will not address this issue in the dissertation.
57
After setting the matching condition and deriving the energy ratio at the collision
point, we may track the trajectory of the massless particle traveling in the AdSVaidya spacetime. By ejecting a particle at the same time as the injection of the
shell from the boundary, which characterizes a virtual gluon generated in the early
time when the medium begins to thermalize, the massless particle travels in the
quasi-AdS spacetime and then collides with the shell at the first collision point zc .
Since the shell always falls with the speed of light, the particle will be surpassed
by the shell and then moves in the AdS-Schwarzschild spacetime. Finally, it takes
infinite time for the particle to collide with the shell at the second collision point zb
close to the future horizon. At the second collision, the massless particle will attach
to the shell and dissipate in the thermalized medium. The stopping distance is thus
defined as the traveling distance of the massless particle along the x1 direction from
the ejecting point to zb ≈ zh .
We firstly track the trajectory of the massless particle and the position of the
shell simultaneously in the quasi-AdS spacetime, where we may use the position of
the shell to characterize the time coordinate. From [105], we have
t˜p
0
dt˜ =
zp − zI
1−
|q|2
ω
˜2
1/2
,
(3.30)
where zp denotes the position of the particle at t˜p . On the other hand, the position
of the shell is recorded by (3.18) and zI is the initial position of the tip of the string.
In the t˜ coordinate, the shell actually falls with the speed of light. Therefore, we
may rewrite the position of the massless particle in the interior of the shell in terms
of the position of the shell as
|q|2
zp (z0 ) = zI + 1 − 2
ω
˜
1/2
z0 ,
(3.31)
where the values of zI , |q|, and ω
˜ are determined by the initial conditions. Now,
58
the zc can be obtained by solving (3.31) at zp = z0 = zc . After the first collision,
the trajectory of the particle moving in the AdS-Schwarzschild spacetime can also
be found from [105],
zp
dz
tp = tc +
zc
F (z) 1 −
2
F (z) |q|
ω2
1/2
,
(3.32)
while the position of the shell is still governed by (3.18)
z0
dzs
.
F (zs )
t0 = tc +
zc
(3.33)
Finally, zb can be found by solving tp = t0 via (3.32) and (3.33) at zp = z0 = zb ,
while we may take zb ≈ zh for simplicity and the deviation is in fact negligible. By
using (3.18), the stopping distance of the massless particle traveling in AdS-Vaidya
spacetime is
x1s =
zc
zI
zb
dz
ω
˜2
|q|2
−1
1/2
dz
+
zc
ω2
|q|2
− F (z)
1/2
.
(3.34)
As discussed in the previous section, the stopping distance of a string with zI = 0
as a gluon with infinite energy is unaffected by the thermalization process. On
the contrary, when zI is below the boundary, the string may characterizes a soft
gluon. Although the energies of gluons depend on the string profiles in dual geometries, the string profiles do not affect the maximum stopping distances. In order
to make the comparison, we could choose straight strings for the initial profiles in
both AdS-Schwarzschild and AdS-Vaidya spacetimes and thus the gluons traveling
in the thermalized and non-thermalized media will carry the same initial energy and
momentum. The initial four-momentum of a gluon as a straight string in the dual
geometry is given in (3.24).
59
In Fig. 3.6, we illustrate the stopping distances scaled by temperature when fixing the initial velocities of gluons with distinct initial energies scaled by temperature
and the t’Hooft coupling in both equilibrium and non-equilibrium media. For soft
probes, we find the larger stopping distances in the non-equilibrium case. Since the
thermalization of the medium in the top-down scenario described by the falling shell
starts from the ultraviolet scale, soft probes generated in the infrared scale travel in
the vacuum in the early time and hence result in larger stopping distances compared
to the probes initially created in the thermalized medium. On the other hand, as
shown in Fig. 3.7, the thermalization of the medium is more influential for light
probes compared to heavy probes with the same energy. For highly offshell gluons,
the energy loss may stem from their intrinsic radiation, which suppresses the induced
radiation due to the collision effect amid the medium. Notice that the gluons traveling in early times actually decelerate even in the vacuum due to the redshift effect
led by a falling shell which thus loss energy from the radiation in vacuum. In this
scenario, the increase of velocities, which correspond to the decrease of virtualities,
leads to the increase of stopping distances. This scenario should be less affected by
the thermalization of media, which can be observed from Fig.3.7, where the stopping distances in the equilibrium and non-equilibrium media coincide at small γ.
On the contrary, for nearly onshell gluons, the energy loss should be attributed to
the induced radiation when traversing the media. This scenario is also indicated
in [149] for heavy probes, where the trailing string can be separated by a critical
point into two parts in the bulk. The part above the point could be interpreted
as dressed color field and the part below the point would be causally disconnected
and be regarded as radiation. When the velocities of gluons increase, the induced
radiation becomes more robust and cause the decrease of stopping distances, which
can be observed in Fig. 3.7 for large γ. Therefore, the induced radiation of gluons traveling in the non-equilibrium medium should be suppressed compared to the
60
case in the thermalized medium in the ultra-relativistic limit. The intrinsic radiation and induced radiation may compete with each other and give rise to maximum
stopping distances for gluons with certain velocities. In general, the stopping distances of the probe gluons are enhanced by the thermalizing process of the medium.
xs
xs
3.0
3.0
2.5
2.0
1.5
1.0
0.5
2.5
2.0
1.5
1.0
0.5
E
10 20 30 40 50 60
Figure 3.6:
The blue and red
dots represent the stopping distances
in AdS-Vaidya and AdS-Schwarzschild
spacetimes respectively, where xˆs =
E
ˆ = πα′ zh E = √ 1
xs πT and E
.
2
T
5
10
15
20
25
30
Γ
Figure 3.7:
The blue and red
dots represent the stopping distances
in AdS-Vaidya and AdS-Schwarzschild
spacetimes respectively, where γ denote
the Lorentz factors encoding the initial
velocities of gluons. Here we fix the initial energies of probes Eˆ = 50.
g Y M Nc
Here we fix the initial velocities of
probes vI = δ = 0.99.
3.4 Thermalization Time with Chemical Potentials
In this section, we will extract the thermalization time of the non-equilibrium plasma
with a non-zero chemical potential by tracking the position of the falling shell in
Poincare patch of AdS-RN-Vaidya geometry. The approach is different from studying
non-local operators in Eddington-Finkelstein (EF) coordinates as carried out in [146,
150]. Since we can define thermalization time to be the time when the shell almost
coincides with the future horizon, it is independent of the length of the operators.
We will observe that with increasing chemical potential, this thermalization time
decreases.
61
We begin with the AdS-RN-Vaidya1 metrics in EF coordinates with d = 3 and
d = 4, respectively. For d = 3, we have
ds2 =
1
−f (v, z)dv 2 − 2dvdz + dx2i , Av = q(v)(zh − z) ,
z2
(3.35)
where f (v, z) = 1 − m(v)z 3 + 12 q(v)2 z 4 . For d = 4, we have
ds2 =
1
−f (v, z)dv 2 − 2dvdz + dx2i
z2
, Av = q(v)(zh2 − z 2 ) ,
(3.36)
where f (v, z) = 1 − m(v)z 4 + 23 q(v)2 z 6 . Here we have set the AdS curvature radius
L = 1. The coordinates xi represent the d-dimensional spatial directions. Also, v
denotes the EF time coordinate and z denotes the radial direction. The boundary
is located at z = 0 and zh denotes the future horizon. In the equations above, m(v)
and q(v) represent the mass and electric charge of the shell. The charge is related to
the time component of the vector potential, which generates an R-charge chemical
potential in the gauge theory side via
µ = lim Av (v, z) .
(3.37)
z→0
For simplicity, we are interested in the thin-shell limit of the interpolating mass
function
m(v) =
M
2
1 + tanh
v
v0
(3.38)
with v0 → 0. We can make the same choices as [146] by taking q(v)2 = Q2 m(v)4/3
and q(v)2 = Q2 m(v)3/2 for d = 3 and d = 4, respectively. The values of zh are
1
For d = 3, the Hodge dual of the bulk electro-magnetic field is another two-form. Thus we
can also introduce a magnetic charge in the AdS-Vaidya type background: such a background
should be dubbed as AdS-dyon-Vaidya background. By adjusting the values of the electric and
magnetic charge in the system, the final temperature of the medium can be fine-tuned to zero,
which corresponds to an electro-magnetic quench phenomenon. More discussion on the dyonic
background can be found in Appendix A.7.
62
determined by
1
f (v > v0 , zh ) = 1 − Mzh3 + M 4/3 Q2 zh4 = 0 , for d = 3 ,
2
(3.39)
2
f (v > v0 , zh ) = 1 − Mzh4 + M 3/2 Q2 zh6 = 0 , for d = 4 .
3
(3.40)
We assume the shell falls from the boundary at t = 0 and thus µ is a constant since
v = t ≥ 0 on the boundary. On the other hand, the thermalization temperature is
given by
T =−
1 d
f (v > v0 , z)|zh .
4π dz
(3.41)
The entropy can be determined by the area of the black hole,
S=
Ah
,
4πG
(3.42)
where Ah represents the area of the black hole and G denotes the Newtonian constant.
Before proceeding further, a few comments are in order. Since the underlying
theory is conformal, the only relevant parameter is the ratio T /µ. Thus we define
χd =
1
4π
µ
T
,
(3.43)
which we will consider throughout the chapter. By using (3.10), one can attain the
AdS-RN-Vaidya geometry in Poincare coordinates in the thin-shell limit as
2
ds =
where
1
z2
1
z2
F (z) =
−F (z)dt2 +
2
2
dz 2
F (z)
+ dx2
if v > 0 (z < z0 ) ,
(3.44)
2
2
(−F (z0 ) dt + dz + dx ) if v < 0 (z > z0 ) ,
1 − Mz 3 + (1/2)M 4/3 Q2 z 4
1 − Mz 4 + (2/3)M 3/2 Q2 z 6
63
for d = 3 ,
(3.45)
for d = 4 .
Since the falling velocities of the upper and lower surfaces are the same in the
thin-shell limit, the position of the falling shell is given by
z0
t(z0 ) =
dzs
0
1
.
F (zs )
(3.46)
Given that the shell never coincides with the future horizon exactly in the Poincare
coordinates, we approximate the thermalization time as τ = t(z0 )|z0 =0.99zh , which is
shown in Fig. 3.8 and Fig. 3.9 with different values of chemical potential measured
in the unit of temperature for d = 3 and d = 4, respectively. When increasing the
chemical potential, the thermalization time decreases. We should comment here that
the specific choice of z0 = 0.99zh does not affect the qualitative feature as far as the
thermalization time is concerned, any other choice yields a similar behavior. Also,
for very large value of χd the thermalization time vanishes asymptotically.
The qualitative behaviors here are distinct from those found by studying nonlocal operators in the AdS-RN-Vaidya metric[146]. However, we should notice that
the definitions of the thermalization time in these two approaches are different. For
example, if we introduce a spacelike geodesic with two ends fixed on the boundary,
the thermalization time can be defined as the time when the shell grazes the bottom
of the geodesic in the bulk. After that, the whole geodesic will reside in the AdS-RN
spacetime, which matches the result derived in the thermalized medium. Therefore,
in this situation, the thermalization time of non-local operators are recorded by the
position of the falling shell. Nevertheless, when the separation on the boundary of
the spacelike geodesic is too large such that the bottom of it penetrates the future
horizon, the geodesic can never fully reside in the AdS-RN spacetime even when
the shell asymptotically reaches the future horizon. In other words, the maximum
thermalization time in Poincare coordinates should be the time when the shell almost
reaches the future horizon. For the non-local operators with much larger lengths
can never thermalize in Poincare coordinates or the definition of the thermalization
64
time in such a case should be modified. Thus, thermalization times extracted from
two approaches can only be compared when the length scale of non-local operators
introduced in EF coordinates is about the size of the future horizon.
ΤT
ΤT
0.55
0.45
0.50
0.40
0.45
0.35
0.40
0.30
0.35
0.25
Χ3
1
2
3
4
Figure 3.8: The thermalization time
τ with different values of chemical potential in d = 3.
Χ4
0.2 0.4 0.6 0.8 1.0
Figure 3.9: The thermalization time
τ with different values of chemical potential in d = 4.
3.5 Jet Quenching with Chemical Potentials
In this section, we will study the stopping distances of light probes in the thermalizing background with chemical potentials. Since the computations are basically the
same as those previously shown in the case with zero chemical potentials, we will
mainly present the results in this section. Before proceeding with the non-equilibrium
medium, we may begin by investigating the thermal medium with a non-zero chemical potential, which is described by the AdS-RN geometry. We will take the physical
interpretation in Ref.[103] to consider the stopping distance for a virtual gluon. As
shown in Section 3.3, The stopping distance is given by
x1s
zh
dz
=
zI
ω2
|q|2
− F (z)
1/2
,
(3.47)
which only depends on the ratio |q|/ω and the initial position of the tip of the string
zI . The ratio |q|/ω roughly represents the ratio to the spatial momentum and energy
65
of the virtual gluon and zI can be associated with its initial energy. Even though
determining the ratio of |q| to ω entails the initial string profile close to the tip,
which could depend on the geometry of the thermalized medium, we may choose the
straight string as the simplest setup As shown in [99, 100], the profile of a moving
string obtained from extremizing the Nambu-Goto action in the AdS geometry is a
straight string. Although the physical solution in the AdS-Schwarzschild geometry
corresponds to a trailing profile, where the profile in the presence of a chemical
potential could be more complicated, we will make the same straight-string setup
in the thermalized case for comparison. This assures that the gluons traveling in
the thermalized medium with different values of chemical potential carry the same
initial energy and momentum and as well the same ratio to |q| and ω. The ratio of
the stopping distance with a non-zero chemical potential to that with zero chemical
potential at the same temperature is shown in Fig. 3.10 and Fig. 3.11 for both d = 3
and d = 4. It turns out that the stopping distance of the light probe decreases when
the chemical potential increases, which has the same qualitative feature compared
to the thermalization of the medium.
Physically, by increasing the chemical potential, we actually increase the number
of states. From (3.42), the entropy density of the plasma in d+1 dimension is given by
−(d−1)
4Gs = zh
. As illustrated in Fig. 3.12 and Fig. 3.13, the entropy density increases
when the chemical potential is increased. The medium thus becomes denser, which
results in the enhanced scattering for the light probe and a smaller stopping distance.
On the other hand, the medium also thermalizes faster because of the same effect.
Although the holographic correspondence of the falling shell in the gauge theory
side is unknown, the falling shell could be characterized by the collective motion
of massless particles with large virtuality in the gravity dual since a null shell is
homogeneous along spatial directions and it falls along a null geodesic. Each particle
66
as a component of the shell may as well be influenced by the backreaction to the
spacetime metric caused by the falling shell; hence it should qualitatively behave in
the same manner as the light probe traversing the medium. Since the component
particles of the shell carry large virtuality, the enhanced scattering led by increasing
chemical potential would be more pronounced, which reduces the thermalization time
of the medium. By comparing Fig. 3.12 with Fig. 3.13, the entropy density for d = 4
increases more rapidly than that for d = 3, which also manifests the steeper drop of
the thermalization time of both the probe and the medium for d = 4 when increasing
the chemical potential by comparing Fig. 3.8 with Fig. 3.9 and Fig. 3.10 with Fig.
3.11.
To avoid a naked singularity in the AdS-RN spacetime, there exists a maximum
value of Q such that the position of the horizon is given by F (z) = 0. By taking
M = 1, the maximum values are Qmax = (27/32)1/6 and Qmax = 3−1/4 for d = 3
and d = 4, respectively. Given that the derivative of F (z) vanishes at the horizon,
the temperature of the medium then vanishes. The corresponding zero temperature
black hole is known as the extremal black hole. However, this does not correspond
to the vacuum since it carries a non-zero entropy given by a non-vanishing area of
the extremal black hole horizon. In this situation, we see that the dimensionless
parameter χ4(3) diverges. Also, the stopping distances with a non-zero chemical
potential in the unit of temperature, xˆ1s (T, µ) shown in Fig. 3.10 and Fig. 3.11,
become zero; we hence lose the ability to make a comparison between the observables
in the media with and without a chemical potential in this particular situation.
Now, we may follow the approach in the previous sections to evaluate the stopping
distances in the AdS-RN-Vaidya geometry. We can compute the stopping distance
by either employing Eq.(3.18) by replacing the blackening function F (z) or directly
invoking null geodesic equations as shown in Appendix A.6. Similar to the study
in the AdS-Vaidya spacetime, the stopping distance of the massless particle falling
67
x1s T,Μ x1s T,0
1.0
x1s T,Μ x1s T,0
1.0
0.8
0.8
0.6
0.6
0.4
0.4
0.2
0.2
0.2
0.4
0.6
0.8
1.0
Χ3
0.1 0.2 0.3 0.4 0.5 0.6 0.7
Χ4
Figure 3.10: The ratio to the stopping distances with and without chemical potential in the unit of temperature
for d = 3, where xˆ1s = x1s T . Here we set
M = 1, zI = 0, and |q| = 0.99ω.
Figure 3.11: The ratio to the stopping distances with and without chemical potential in the unit of temperature
for d = 4, where xˆ1s = x1s T . Here we set
M = 1, zI = 0, and |q| = 0.99ω.
4Gs T 2
4Gs T 3
80
800
60
600
40
400
20
200
Χ4
0.2 0.4 0.6 0.8 1.0
Figure 3.13: The entropy density
with different values of the chemical potential for d = 4. Here we set M = 1.
Χ3
0.2 0.4 0.6 0.8 1.0 1.2 1.4
Figure 3.12: The entropy density
with different values of the chemical potential for d = 3. Here we set M = 1.
from the boundary is not affected by the gravitational collapse in the AdS-RNVaidya geometry. In our setup, when we set the initial position of the tip of the
string on the boundary, the corresponding virtual gluon on the gauge theory side
carries infinite energy as shown in (3.24). As indicated previously, when the hard
probe has the energy much larger than any other scale such as the thermalization
temperature or the chemical potential of the system, the thermalization of the probe
would be insensitive to the thermalization of the medium. However, for the soft
68
probe carrying energy comparable to other scales of the system, we may envision
an influence of the thermalization process on the jet quenching phenomenon. This
scenario is shown in Fig. 3.14 and Fig. 3.15, where we eject the massless particle
below the boundary, which corresponds to the soft gluon with a finite energy. As a
result of thermalization, stopping distance of light probes increases.
Finally, we illustrate this behaviour for different values of chemical potential in
AdS-RN and AdS-RN-Vaidya spacetimes in Fig. 3.16 and Fig. 3.17. The results can
be reproduced by solving geodesic equations directly in EF coordinates, which are
presented in Appendix A.6; the latter approach can be further applied beyond the
thin-shell limit. As shown in Fig.3.16 and Fig.3.17, the stopping distances scaled by
the thermalization temperature in both the AdS-RN-Vaidya and AdS-RN geometries
decrease when the values of χd are increased and will drop to zero when the values
of χd reach infinity.
In general, we find that the probe gluon travels further in the non-equilibrium
plasma with a non-zero chemical potential compared to the thermal background.
Increasing the magnitude of the chemical potential decreases the stopping distances
in both equilibrium and non-equilibrium plasmas.
3.6 Conclusions and Discussions
In this chapter, we have investigated the influence of the thermalization of the
strongly-coupled plasma on light probes by studying the gravitational collapse in
the AdS-Vaidya spacetime. In the thin-shell limit, we write down the analytic expression of the AdS-Vaidya metric in Poincare coordinates. By using the derived red
shift factor, we track the position of the falling shell in the bulk. In this scenario, the
thermalization time of the medium can be extracted when the shell asymptotically
reaches the future horizon. We find tth T ≈ 0.55, which is approximately consistent with the thermalization time obtained in other holographic models, which as
69
x1
x1
2.0
2.0
1.5
1.5
1.0
1.0
0.5
0.5
0.2 0.4 0.6 0.8 1.0 1.2 1.4
z
0.2
Figure 3.14: The red and blue curves
represent the trajectories of the massless particles moving in AdS-RN and
AdS-RN-Vaidya spacetimes for d = 3
and χ3 = 4.47, respectively. The red
and blue dashed lines denote the first
collision point and the position of the
future horizon. Here we take zI = 0.4,
M = 1, and |q|/˜
ω = 0.99 as the initial
conditions in both spacetimes.
0.4
0.6
0.8
1.0
1.2
z
Figure 3.15: The red and blue curves
represent the trajectories of the massless particles moving in AdS-RN and
AdS-RN-Vaidya spacetimes for d = 4
and χ4 = 1.1, respectively. The red
and blue dashed lines denote the first
collision point and the position of the
future horizon. Here we take zI = 0.4,
M = 1, and |q|/˜
ω = 0.99 as the initial
conditions in both spacetimes.
well resides in the range of the thermalization time at RHIC based on the viscous
hydrodynamics.
Also, we have computed the stopping distance of the light probe traversing the
non-equilibrium plasma by solving the null geodesic of a massless particle falling in
the AdS-Vaidya geometry. We find the stopping distance of a hard probe is equal to
that in the thermalized medium governed by the AdS-Schawrzschild spacetime even
when the shell has finite thickness. In the thermalization process, the decrease of the
virtualities of hard probes in principle result in larger stopping distances, while this
effect is negligible. However, for the soft and relativistic probes, they travel longer
in the pre-equilibrium state. The suppression of induced radiation result in larger
stopping distances. Therefore, the thermalization of the medium may reduce the jet
quenching of soft and relativistic probes.
Moreover, we have analyzed thermalization of a non-equilibrium plasma with a
70
xsT
xsT
0.35
0.30
0.25
0.20
0.15
0.10
0.05
0.5
Χ3
0.2 0.4 0.6 0.8 1.0 1.2 1.4
Figure 3.16: The red and blue points
represent the stopping distances with
different values of chemical potential in
AdS-RN and AdS-RN-Vaidya for d =
3, respectively. Here we set M = 1,
zI = 0.4, and |q|/˜
ω = 0.99 as the initial
conditions in both spacetimes.
Χ4
0.2 0.4 0.6 0.8 1.0
Figure 3.17: The red and blue points
represent the stopping distances with
different values of chemical potential in
AdS-RN and AdS-RN-Vaidya for d =
4, respectively. Here we set M = 1,
zI = 0.4, and |q|/˜
ω = 0.99 as the initial
conditions in both spacetimes.
0.4
0.3
0.2
0.1
non-zero chemical potential by tracking a thin shell falling in the AdS-RN-Vaidya
spacetime. We found the thermalization time of the medium decreases when the
chemical potential is increased. We have also studied the jet quenching of a virtual gluon traversing such a medium by computing the stopping distance of a falling
string, in which the tip of the string falls along a null geodesic. In both the thermalized or thermalizing medium with a non-zero chemical potential, the stopping
distance of the probe gluon decreases when the chemical potential is increased. On
the other hand, for a soft gluon with finite energy comparable to the thermalization
temperature of the medium, its stopping distance in the thermalizing medium is
larger than that in the thermalized case.
In section II, we briefly discussed the difference between the thermalization time
obtained from our approach by tracking the falling shell in Poincare coordinates and
that derived in Ref.[146] by analyzing non-local operators; we will further elaborate
on this here. When the medium carries no chemical potential, the position of the
horizon is about the inverse of the temperature. As mentioned in the end of Sec71
tion 3.1, the thermalization times obtained from two approaches in the AdS-Vaidya
geometry approximately match when the length scale of the nonlocal operators is
about the inverse of the temperature. However, for the medium with a non-zero
chemical potential, the temperature does not linearly depend on zh−1 . To compare
the thermalization times obtained from two approaches, we have to investigate the
thermlization time for a nonlocal operator with the length scale about the size of the
horizon in the AdS-RN-Vaidya spacetime. As shown in Fig.3.18, thermalization time
obtained by analyzing non-local observables with a length-scale ls = 1.71zh [146] do
exhibit similar qualitative feature as the one we have encountered here. Note that
the number ls /zh bears no possible physical significance other than being an order
one number where we have found a visibly pleasant matching. As far as the thermalization time of the medium is concerned, we conclude that our approach by tracking
the falling shell close to the horizon seems consistent with that by probing the thermalizing medium with nonlocal operators, when the length scale of the operators
approximately equals the size of the horizon. In addition, the thermalization times
from both approaches starts to drop more rapidly when µ
T.
For the light probe traversing the medium with a non-zero chemical potential, the
decrease of the stopping distance when increasing the chemical potential is expected
due to the enhanced scattering with the increasing density of the medium. In [151,
152], it is found that the jet quenching parameter and the drag force of a trailing
string in the charged SYM plasma both increase when the chemical potential is
increased, which is again consistent with our general observations here.
72
ΤT
0.55
0.50
0.45
0.40
0.35
0.25
0.20
0.2
0.4
0.6
0.8
1.0
Χ4
Figure 3.18: The blue and red points represent the thermalization times scaled
by the temperature obtained from our approach and that from analyzing non-local
observables, respectively. Here we take M = 1 in the both cases.
73
4
Investigating Strongly Coupled Anisotropic
Plasmas
The work in this chapter was first published in [130, 131]. As discussed in Section
1.2, in heavy ion collisions, the medium may have large pressure anisotropy even
after reaching thermal equilibrium. The influence of pressure anisotropy on different
probes thus become important. In general, the pressure anisotropy decreases with
respect to time during the expansion according to viscous and anisotropic hydrodynamics. As a result, in AdS/CFT correspondence, it is more realistic to study
time-dependent backgrounds such as [23, 24, 153, 27, 28, 29, 67]. However, since
to solve these time-dependent geometries is more numerically involved, it is rather
challenging to introduce external probes in the time-dependent backgrounds. On
the other hand, the static yet anisotropic backgrounds may be useful toy models to
investigate anisotropic effects on different probes.
In [154] and [155, 14], the dual geometries of such a strongly coupled and static
plasma with pressure anisotropy are derived. The former originates from solely the
anisotropic stress energy tensor, while the spacetime metric has a naked singularity.
The latter is generated from a five-dimensional Einstein action with a dilaton and an
74
axion field linearly depending on an anisotropic factor, which results in an anisotropic
and thermal background regular in the bulk.
The energy loss of hard probes in such strongly-coupled anisotropic plasmas described by holographic models has been investigated recently. The jet quenching
parameter, drag force as well as the heavy quark potential are computed in holographic duals [156, 157, 158, 159]. In addition, the energy loss of orbiting quarks and
quarkonium dissociation in an anisotropic holographic dual also have been explored
in [160] and [161], respectively. It is found in [156, 159] that the drag force in the
anisotropic plasma can be smaller or larger than the isotropic case depending on different velocities and orientations of the probes. On the other hand, the anisotropic
value of the jet quenching parameter may be enhanced or reduced when comparing to
the isotropic value at equal temperature or at equal entropy density [158, 157]. These
studies focus on the jet quenching of heavy probes in the gravity dual, whereas the
anisotropic effect on light probes has not yet been investigated. Therefore, we will
investigate the jet quenching of light quarks by computing their stopping distances
in an anisotropic plasma in the following section. Also, although the thermal-photon
production in an anisotropic background has been studied in [162], the effect from
massive quarks was considered therein. We will hence generalize the study in [162] to
incorporate the effect from massive quarks and further include that from a constant
magnetic field in Chapter.5 for photon production.
This chapter is organized in the following order. In Section 4.1, we give a brief
introduction to the anisotropic and thermalized dual geometry proposed by Mateos
and Trancanelli(MT)[155, 14]. In Section 4.2, we compute the stopping distance
of light quarks in such a background. In Section 4.3, we investigate the photon
production by including the anisotropic background in D3/D7 system with trivial
embeddings. In Section 4.4, we further generalize the setup in Section 4.3 to the black
hole embedding to incorporate massive quarks. The photon spectra with massive
75
quarks will then be computed. Finally, we make concluding remarks in the last
section.
4.1 The Einstein-Axion-Dilaton System
In this section, we will introduce the anisotropic dual geometry led by a five-dimensional
dilaton-axion gravity action [155, 14]. In the Einstein frame, the action takes the
form,
SE =
1
2κ2
√
1
1
d5 x −g R + 12 − (∂φ)2 − e2φ (∂χ)2
2
2
+
√
d4 x −γ2K, (4.1)
1
2κ2
where φ and χ denote the dilaton and axion, respectively. The second term in (4.1)
is the Gibbons-Hawking-York boundary term and 2κ2 = 16πG = 8π 2 /Nc2 is the five
dimensional gravitational coupling. To simplify the computations, we have set L = 1,
where L = (4πgs Nc ls2 )1/4 denotes the radius of S 5 in the ten-dimensional spacetime.
The solution of the dual metric in the Einstein frame is given by
φ(u)
ds2E
e− 2
=
u2
−F (u)B(u)dt2 + dx2 + dy 2 + H(u)dz 2 +
du2
F (u)
(4.2)
for χ = az, where F (u), B(u), and H(u) = e−φ(u) depend on φ(u) and the anisotropic
factor a, which corresponds to the density of D7 branes embedded along the anisotropic
direction z. These D7 branes dissolve in the bulk and contribute to the pressure
anisotropy of the medium. Note that the D7 branes here are different from the D7
flavor branes mentioned in Chapter.2. Also, hereafter u will denote the bulk direction through the dissertation. The blackening function F (u) vanishes at the event
horizon u = uh , which results in the temperature and entropy density of the plasma.
76
From [155, 14], the temperature and entropy density of the MT geometry read
√
∂u F B|u=uh
T = −
=
4π
5
5
1
˜
˜
7˜
e 2 (φb −φh )
B(uh )
(16 + u2h e 2 φh ),
16πuh
˜
Nc2 a 7 e− 4 φh
s =
,
2πu3h
(4.3)
˜
˜
˜ h ). All metric components are
where φ(z)
= φ(z) + log a4/7 , φ˜b = φ(0)
and φ˜h = φ(u
in fact functions of the dilaton field as the solution from a nonlinear field equation
of the effective action in (4.1). Due to nonlinearity, this field equation can only
be solved numerically, while the analytic result can be found for small anisotropy
such that (T ≫ a). We will then present the small-anisotropy result for future
references. In the high-temperature or the small-anisotropy regime (T ≫ a), the
pressure anisotropy is small. In this regime, the anisotropic factor a in the strongly
coupled scenario can be related to a parameter ξ introduced in the weakly coupled
approach [81, 163], which is define as
ξ=
p2T
− 1,
2 p2L
(4.4)
where pT and pL denote the magnitudes of momenta along the transverse and longitudinal directions, respectively. In heavy ion collisions, the longitudinal direction is
the beam direction. The parameter ξ characterizes the momentum anisotropy in a
weakly coupled and anisotropic plasma. It was found in [156] that
ξ≈
5a2
for 0 < ξ ≪ 1
8π 2 T 2
(4.5)
by comparing the pressure differences in both weakly coupled and strongly coupled
approaches. When T ≫ a, the analytic expression of the metric up to the leading
77
order is given by
F (u) = 1 −
u4
+ a2 F2 (u) + O(a4 ),
u4h
B(u) = 1 + a2 B2 (u) + O(a4 ),
H(u) = e−φ(u) , φ(u) = a2 φ2 (u) + O(a4 ).
(4.6)
From (B.7), the MT metric in (4.2) will reduce to the AdS-Schwarzschild metric
when a → 0. The explicit expression of the leading-order anisotropic terms are
1
u2
2 2
2
4
4
4
F2 (u) =
8u (uh − u ) − 10z log2 + (3uh + 7u )log 1 + 2
24u2h
uh
B2 (u) = −
u2h
10
u2
+
log
1
+
24 u2h + u2
u2h
φ2 (u) = −
u2
u2h
log 1 + 2
4
uh
,
,
.
(4.7)
The temperature at the leading order is thus defined as
T =
1
5log2 − 2
+ a2 uh
+ O(a4 ).
πuh
48π
(4.8)
Conversely, the horizon can be written as
uh =
1
5log2 − 2
+ a2
+ O(a4 ).
πT
48π 3 T 3
(4.9)
In fact, the pressure anisotropy in the small-anisotropy regime and that in midanisotropy regime have distinct behaviors. As shown in Fig.4.1, the longitudinal
pressure is slightly smaller than the transverse pressure for a/T ≤ 3.4, while the
longitudinal pressure surpasses the transverse pressure for a/T ≥ 3.4. At large a,
the pressure ratio diverges.
78
Figure 4.1: The energy and pressures normalized by their isotropic values as functions of a/T [14].
4.2 Light Probes in Anisotropic Plasmas
Now, we may study the jet quenching of a light probe in the anisotropic plasma by
computing the stopping distance of a massless particle moving along the null geodesic
in the MT metric. We will follow the approach introduced in Chapter.3, where an
R-charged current is generated by a massless gauge field in the gravity dual. The
induced current may be regarded as an energetic jet traversing the medium. When
the wave packet of the massless field falls into the horizon of the dual geometry, the
image jet on the boundary dissipates and thermalizes in the medium. The stopping
distance is thus define as the distance for a jet traversing the medium before it
thermalizes. In the WKB approximation, we assume that the wave packet of the
gauge field in the gravity dual highly localized in the momentum space. We thus
factorize the wave function of the gauge field as
Aj (t, u) = exp
i
qk xk +
duqu
A˜j (t, u),
(4.10)
where qu denotes the momentum along the bulk direction and j, k = 0, 1, 2, 3 represent four-dimensional spacetime coordinates and qk denotes the four-momentum,
which is conserved as the metric preserves the translational symmetry along the four79
dimensional spacetime. Here A˜i (t, u) is slow-varying with respect to t and u. In the
classical limit( → 0), the equation of motion of the wave packet will reduce to a
null geodesic in the dual geometry, which takes the form [105],
dxi √
g ij qj
= guu
.
du
(−qk ql g kl )1/2
(4.11)
Thus, the wave packet can be approximated as a massless particle and the null
geodesic will lead to a maximum stopping distance for an image jet on the boundary
in the classical limit. We will take the interpretation in [102] for light quarks, where
the bulk governed by the AdS-Schwarzschild geometry is filled with a flavor D7
brane and the backreaction of the flavor D7 brane to the bulk geometry is ignored.
A string falling in the bulk then induces a flavor-current on the boundary, which can
be regarded as a light quark traversing the medium. Note that the flavor D7 brane
here is different from the D7 brane in MT model as the source of anisotropy. When
the tip of the string falls into the horizon, the flavor current fully diffuses on the
boundary, which corresponds to the thermalization of a light quark in the medium.
In this scenario, a null geodesic will result in the maximum stopping distance for the
light quark, which is similar to the previous setup for an R-charged current.
By employing (4.2) and (4.11), we can compute the stopping distances of the
probes traveling along the transverse direction perpendicular to the z axis and the
longitudinal direction parallel to the z axis in the anisotropic medium,
uh
du
xT =
1 ω2
B |q|2
0
uh
,
du
xL =
0
−F
1/2
H
1 ω2
B |q|2
−
F
H
1/2
(4.12)
,
(4.13)
where we assume that the particle carries the spatial momentum solely along one of
the transverse direction in (4.12) and solely along the longitudinal direction in (4.13).
80
In this computation, the null geodesic in (4.11) remains unchanged even when we
use the Einstein frame.
To compare the stopping distance in the media with and without the anisotropic
effect, we have to fix a proper physical parameter. In the following computation, we
will fix the temperature, energy density, and entropy density, respectively. The recent
lattice simulation for the SU(Nc ) plasma at finite temperature within the range of
RHIC and LHC has shown that the equilibrium thermodynamic properties have mild
dependence of Nc [164], which supports the validity of the study of QCD based on
large Nc models. In general, only when a particular observable obtained from the
lattice calculation matches that found by AdS/CFT, then the lattice findings can be
used for the extrapolation to the small-Nc limit. However, for an observable which
does not depend on Nc explicitly, such as the ratio of stopping distances that we
are concerned with in this paper, the results in the large-Nc and in the small-Nc
limits may share same features qualitatively. When fixing the energy density and
entropy density, we will always take Nc = 3 in analogy to QCD, while the choice of
Nc will not affect our qualitative results in this paper. From (4.12) and (4.13), we see
that the parameter-dependence of the stopping distance is encoded by the position
of the horizon in terms of the physical parameter we fix. By inserting (4.9) into
(4.12) and (4.13), we can compute the stopping distance by fixing the temperature
of the medium. The stopping distances for different values of the anisotropy factor
a in units of temperature are illustrated in Fig.4.2. In [14], the energy density and
entropy density up to leading order in a2 are given by
ǫ =
3Nc2 π 2 T 4
N 2T 2
+ a2 c
+ O(a4 ),
8
32
s =
Nc2 π 2 T 3
N 2T
+ a2 c + O(a4 ).
2
16
(4.14)
Combining (4.9) and (4.14), we rewrite the position of the horizon in terms of the
81
energy density or the entropy density,
1/4
uh =
3Nc2
8π 2
uh =
π 2 Nc2
2
−1/4
ǫ
1/3
−1
128π 2
2 5 log 2
+a
8π 2
3Nc2
1/4
Nc2 ǫ−3/4 + O(a4 ),
s−1/3
5 log 2 2 −1
+ a2
N s + O(a4 ).
π
96π c
(4.15)
By utilizing (4.12), (4.13), and (4.15), we are now able to compute the stopping
distances for fixed energy density or fixed entropy density. The results are shown in
Fig.4.3 and Fig.4.4. We find that the nonzero anisotropic factor leads to smaller stopping distances in both the transverse direction and the longitudinal direction, which
indicates stronger jet quenching of light probes traveling through the anisotropic
medium. The quenching is more pronounced along the longitudinal direction. Although this effect is rather small, it is not surprising since the momentum anisotropy
for a ≤ T is rather small as shown in [156]. In contrast to light probes, the jet
quenching of heavy probes is also weakly enhanced at small anisotropy or at high
temperature. As shown in [156], only slightly greater jet quenching parameters and
drag forces of heavy probes moving beyond the critical velocity are found in the MT
geometry at a/T = 0.3.
We now analyze the relation between the energy density and the stopping distance
in the anisotropic plasma in more detail. In the AdS-Schwarzschild spacetime, the
energy density is characterized by the temperature, ǫ = 3π 2 Nc2 T 4 /8. By using (3.13),
the stopping distance can be rewritten as
xs = ǫ−1/4
3Nc2
8π 2
1
0
d˜
r
q2
− |q|2 +
r4
1/2
= ǫ−1/4 A0 (Nc , ω, |q|),
(4.16)
where r˜ = u/uH and q 2 = −ω 2 + |q|2 in the integral and A0 (Nc , ω, |q|) is a dimensionless factor. We see that the stopping distance of the hard probe decreases when the
82
energy density is increased. This is analogous to the weakly-coupled plasma where
the jet quenching is enhanced for increasing energy density [165]. When including
the anisotropic effect, the transverse stopping distance to the order a2 becomes
1
xT =
u0h
dr
0
2
q
˜4
− |q|
2 + r
1/2
1 +
2
2
a
2
q2
− |q|
2
+ r˜4
= ǫa−1/4 A0 (Nc , ω, |q|) + a2 ǫ−3/4
AT1 (Nc , ω, |q|),
a
B2
ω
+ F2
|q|2
+ a2 δu0h
(4.17)
where u0h and δu0h can be read off from (4.15). Here ǫa is the energy density shown
in (4.14) and we may take ǫa = ǫ for comparison. For the hard probe with small
virtuality, the dimensionless factor AT1 (Nc , ω, |q|) is negative; hence the suppression
of the stopping distance led by the first-order anisotropic correction is reduced when
the energy density is increased. The longitudinal stopping distance xL can be written
in the same form as xT by substituting AT1 (Nc , ω, |q|) with a different numerical factor
AL1 (Nc , ω, |q|), where AL1 (Nc , ω, |q|) is also negative at small virtuality. The similar
scenario for fixed entropy density could be found by following the same approach.
In general, in the high-temperature or small-anisotropy limit, the anisotropic
values of stopping distances are slightly smaller than the isotropic values by fixing
one of physical parameters such as temperature, energy density, or entropy density.
The jet quenching along the longitudinal direction is particularly enhanced, although
the enhancement is rather small.
In the mid-anisotropy or the large-anisotropy regimes, the longitudinal pressure
surpasses the transverse pressure and the pressure inequality becomes substantial
[14], which may not be similar to the feature of QGP. In anisotropic hydrodynamics,
the pressure difference can be considerably large in early times [82, 84]. However, the
longitudinal pressure should be always suppressed by the transverse pressure, which
is qualitatively opposite to the scenario described by the MT model beyond small
83
Rx
1.000
0.999
a
0.1
0.2
0.3
0.4
0.5 T
0.997
0.996
0.995
0.994
0.993
Figure 4.2: Rx = xaniso /xiso represents the ratio of the stopping distances in the
MT geometry with anisotropy to without anisotropy, where xaniso = xT for the red
points and xaniso = xL for the large blue points. Here we take |q| = 0.99ω and fix
the temperature of media.
anisotropy. Despite the unrealistic directions of anisotropy, it may be heuristic to
investigate the effect of the medium with strong anisotropy on jet quenching of light
probes. To study the jet quenching in the mid-anisotropy or the large-anisotropy
regimes, we have to employ the numerical solution of the MT metric. Due to the
rotational symmetry in the transverse directions, we may set the four-momentum of
the massless particle as qi = (−ω, |q| sin ψ, 0, |q| cos ψ), where ψ denotes the polar
angle in the x1 − x3 (x − z) plane with respect to the longitudinal direction x3 (z).
The probe thus travels along the longitudinal and transverse directions for ψ = 0
and ψ = π/2, respectively. Now the stopping distance acquired from (4.11) is given
by xaniso =
x2T s + x2Ls , where
uh
xT s =
sin ψ
du
1 ω2
B |q|2
0
−
F
(cos2
H
uh
xLs =
ψ + H sin ψ)
1/2
,
cos ψ
du
0
2
H
1 ω2
B |q|2
−
F
(cos2
H
ψ + H sin2 ψ)
1/2
.
(4.18)
By inserting the numerical solutions of the spacetime metric into the equation above
84
Rx
1.000
Rx
1.000
a
a
0.05
0.10
0.15
0.02 0.04 0.06 0.08 0.10 0.12 0.14 s1 3
0.20 Ε1 4
0.997
0.996
0.995
0.994
0.993
0.997
0.996
0.995
0.994
0.993
Figure 4.3: Rx = xaniso /xiso represents the ratio of the stopping distances
in the MT geometry with anisotropy to
without anisotropy, where xaniso = xT
for the red points and xaniso = xL for
the large blue points. Here we take
Nc = 3, |q| = 0.99ω and fix the energy
density of media.
Figure 4.4: Rx = xaniso /xiso represents the ratio of the stopping distances
in the MT geometry with anisotropy to
without anisotropy, where xaniso = xT
for the red points and xaniso = xL for
the large blue points. Here we take
Nc = 3, |q| = 0.99ω and fix the entropy
density of media.
and carrying out the integrations, the stopping distances at mid and large anisotropy
in comparison with those in the isotropic case are shown in Fig.4.5 and Fig.4.6. When
fixing the temperature, the stopping distances in both mid and large anisotropy
are smaller compared to the isotropic results. As shown in both figures, when ψ
decreases, the suppression of the stopping distance becomes more robust, which
suggests stronger jet quenching along the longitudinal direction. In contrast, at
equal entropy density, the enhanced jet quenching in the anisotropic medium becomes
less prominent and the stopping distances of probes moving close to the transverse
directions even exceed the stopping distances in the isotropic case. Overall, the jet
quenching of light probes is enhanced when turning up the anisotropic effect except
for the probe moving along the transverse direction.
After finding the results at mid and large anisotropy, we may make a comparison
with the influence of the anisotropic effect on the jet quenching of heavy probes. In
the studies of the drag force in MT metric [156, 159], the longitudinal drag is as well
85
enhanced by anisotropy at equal temperature or at equal entropy density . Also, at
mid or large anisotropy, the enhancement of the drag force for the probe traveling
more parallel to the transverse direction diminishes. When the magnitude of the
probe velocity is smaller than a critical value, the transverse drag could be smaller
than the isotropic drag at equal temperature or equal entropy density. Despite the
velocity dependence, the angular dependence of the anisotropic drag is qualitatively
analogous to the scenario of the anisotropic stopping distance we find. For the
jet quenching parameter computed from lightcone Wilson loops, the enhancement
or the suppression due to anisotropy are more subtle, which depends on both the
direction of moving quarks and the direction of momentum broadening [158, 157].
Nevertheless, since the momentum broadening is attributed to collisions between the
heavy quark and thermal partons in the medium, this effect should be suppressed
compared to the radiation energy loss in the case of light probes. As a result, we
may not anticipate that the anisotropy effect on stopping distances of light probes
shares the same features with the jet quenching parameters.
1.00
Rx
1.2
0.95
1.0
Rx
0.8
0.90
0.6
0.85
0.4
0.80
0.2
Ψ
0.5
1.0
1.5
Figure 4.5: The red and thick blue
curves represent the ratios Rx =
xaniso /xiso at mid anisotropy at equal
temperature and at equal entropy density, respectively. Here we take |q| =
0.99ω, uh = 1, and a/T ≈ 4.4 or equivalently a/s1/3 ≈ 1.2 for Nc = 3.
Ψ
0.5
1.0
1.5
Figure 4.6: The red and thick blue
curves represent the ratios Rx =
xaniso /xiso at large anisotropy at equal
temperature and at equal entropy density, respectively. Here we take |q| =
0.99ω, uh = 1, and a/T ≈ 86 or equivalently a/s1/3 ≈ 17 for Nc = 3.
86
4.3 Photon Production in an Anisotropic Plasma
To investigate the spectra of photons and dileptons, we will follow the approaches in
[166] by introducing U(1) gauge fields in the gravity dual as sources of electromagnetic currents on the boundary, where the gauge fields here are regarded as external
probes and their back-reaction to the dual geometry is neglected. The effective action
for the external gauge fields can be written as
Sext =
−1
8κ2
√
d5 x −gFM N F M N ,
(4.19)
which leads to field equations ∇M F M N = 0, where the Latin indices denote the
directions of five-dimensional spacetime, M, N = t, x, y, z, u. We will then choose
the gauge Au = 0. Based on the translational invariance along t, x, y, z directions,
we can write down the Fourier transform of gauge fields as
Aµ (u, t, x) =
d4 k ik0 t+ik·x
e
Aµ (u, k),
(2π)4
(4.20)
where the Greek indices denote the directions of four dimensional spacetime, µ = t, x,
y, z. Since now the dual geometry is anisotropic along the z direction and rotational
symmetry is only preserved on the x − y plane, we will study two particular cases
for k = (−ω, 0, 0, q) and k = (−ω, q, 0, 0), where the induced currents move parallel
and perpendicular to the anisotropic direction, respectively.
87
We firstly consider the case for k = (−ω, 0, 0, q); the field equations are
A′′⊥ +
F′ 1
B′
H′
φ′
− +
+
−
F
u 2B 2H
4
A′⊥ +
A′′t −
B′
H′
φ′
1
+
−
+
u 2B 2H
4
q
(qAt + ωAz ) = 0,
FH
A′′z +
B′
H′
φ′
F′ 1
− +
−
−
F
u 2B 2H
4
A′t = −
qBF ′
A ,
ωH z
A′t −
A′z +
1
F2
ω2 q2F
−
B
H
A⊥ = 0,
ω
(ωAz + qAt ) = 0,
F 2B
(4.21)
where Aµ = Aµ (u, k) and primes denote the derivatives with respect to u. The
first equation in (4.21) for ⊥= x, y is the field equation for transverse polarizations
perpendicular to the spatial momentum. The rest three equations govern the longitudinal modes, where the last one is in fact redundant, which can be obtained
from the linear combination of the other two equations. By defining E⊥ = ωA⊥ and
Ez = qAt + ωAz , we can rewrite the field equations into gauge invariant forms,
E⊥′′ +
F′ 1
B′
H′
φ′
− +
+
−
F
u 2B 2H
4
Ez′′ +
ω 2 HF ′
+
F
B′
H′
−
2B 2H
1
F2
ω2 q2F
−
B
H
Ez = 0,
+
E⊥′ +
1
F2
(ω 2 H + q 2 BF )
ω2 q2F
−
B
H
E⊥ = 0,
Ez′
−
ω 2 H − q 2 BF
1 φ′
+
u
4
Ez′
(4.22)
88
for k = (−ω, 0, 0, q). Similarly, we have
Ey′′ +
F′ 1
B′
H′
φ′
− +
+
−
F
u 2B 2H
4
Ey′ +
1
F2
ω2
− q 2 F Ey = 0,
B
Ez′′ +
B′
H′
φ′
F′ 1
− +
−
−
F
u 2B 2H
4
Ez′ +
1
F2
ω2
− q 2 F Ez = 0,
B
Ex′′ +
ω 2F ′
B′ 2
Ex′
+
(ω + q 2 BF )
−
F
2B
ω 2 − q 2 BF
+
1
F2
ω2
− q2F
B
1 φ′
H′
+ −
u
4
2H
Ex = 0,
Ex′
(4.23)
for k = (−ω, q, 0, 0), where Ey,z = ωAy,z and Ex = qAt + ωAx . Notice that the
equation for Ey here is slightly different from that for Ez due to anisotropy of the
metric along the z direction. By using the field equations (4.22) and (4.23), we then
write down the boundary terms of the effective action in (4.19),
Sǫ =
−1
4κ2
d4 k Q
(2π)4 u
1 ∗ ′
1
E⊥ E⊥ + 2
E ∗E ′
2
ω
ω H − q 2 BF z z
for k = (−ω, 0, 0, q), and
Sǫ =
−1
4κ2
d4 k Q
(2π)4 u
1
1
(Ey∗ Ey′ + H−1 Ez∗ Ez′ ) + 2
Ex∗ Ex′
2
2
ω
ω − q BF
(4.24)
√
3
for k = (−ω, q, 0, 0), where Eµ∗ = E(u, −k) and Q = F Be− 4 φ . Notice that φ → 0
and F , B, H → 1 near the boundary. Although the dual geometry asymptotically
reduces to the pure AdS spacetime near the boundary, the boundary value of Ey and
of Ez will differ due to the breaking of rotational symmetry in the bulk.
In thermal equilibrium, the differential photon emission rate per unit volume can
be written as
d3 k
χ(k)
dΓγ =
,
3
2(2π) ω(eβω − 1)
n
χ(k) = −2Im[
89
ǫµs ǫ∗ν
s Cνµ (k)],
s=1
(4.25)
where n = 2 denotes the number of polarizations of photons and χ(k) represents the
trace of the spectral density, which is related to the retarded current-current correlator Cµν (k). When photons are linearly polarized along a particular polarization ǫT ,
we should take
dΓγ (ǫT ) =
d3 k
χǫT (k0 )
,
3
2(2π) ω(eβω − 1)
χǫT (k0 ) = −4Im[ǫµT ǫ∗ν
T Cνµ (k)].
(4.26)
By these definitions, we retrieve χǫT (k0 ) = χ(k) in the isotropy case. Following the
AdS/CFT prescription[167, 168, 166], the retarded correlators can be evaluated by
taking the functional derivatives of the boundary action with respect to the gauge
fields, which further results in
QEǫ′ T (u, k)
χǫT (k0 ) = ZIm lim
,
u→0 uEǫ (u, k)
T
QE⊥′ (u, k)
,
χ(k) = ZIm lim
u→0 uE⊥ (u, k)
(4.27)
where Z is an overall constant. Also, the zero-frequency limit of the spectral function
contributes to the DC conductivity as
σ=
e2
1
lim χ(k)||k|=ω ,
4 ω→0 ω
σ(ǫT ) =
e2
1
lim χǫT (k0 )||k|=ω .
4 ω→0 ω
(4.28)
In thermal equilibrium, only the incoming-wave solutions near the horizon have to
be considered. In the isotropic case, the lightlike solution(q = ω) takes the form
[166],
T
Ein
(ω, u)
=
u2
1− 2
uh
2 F1 1 −
ω
− iˆ
4
u2
1+ 2
uh
ˆ
−ω
4
×
1+i
1+i
ω
ˆ (1 − u2 /u2h )
ω
ˆ, −
ω
ˆ; 1 − i ;
4
4
2
2
,
where uh = (πT )−1 in the isotropic geometry and ω
ˆ = ω/(πT ). However, the
anisotropic solutions can only be solved numerically. We thus solve E⊥ in (4.22)
90
and Ey , Ez in (4.23) for q = ω by imposing incoming-wave boundary conditions
via analysis of the near-horizon expansion of field equations. In the first case, by
solving E⊥ and implementing (4.27), we can derive the spectral density for photons
propagating along the anisotropic direction z. In the second case, the solutions of
Ey and Ez then contribute to the spectra for photons moving perpendicular to the
anisotropic direction.
To compare the results with those found in isotropic case, we have to fix certain
physical scales such as temperature or entropy density of the media. In the rest
of the paper, we will solely focus on the cases with fixed temperature. Due to the
rotational symmetry on the x − y plane, the computation of the spectral density
for k = (−ω, 0, 0, ω) is straightforward. We define the ratio χr = χǫT aniso /χiso
to compare the anisotropic and isotropic cases. Nonetheless, as indicated in the
previous context, the field equations for Ey and Ez are slightly different in (4.23)
for k = (−ω, ω, 0, 0), which bring about different retarded correlators 1 . The results
at mid anisotropy for fixed temperature are shown in Fig.4.7, which match those
found by fluctuating a flavor probe brane in MT geometry in the massless-quark
limit [162]2 . The matching is expected since only the leading-order contribution of
the gauge fields coupled to the flavor brane in the DBI action is considered in [162].
4.4 Photon Spectra from Massive Quarks in an Anisotropic Plasma
To incorporate the flavor degrees of freedom, we will consider the embeddings of
flavor D7 branes in the anisotropic background geometry [155, 14]. In addition, we
take the quenched approximation by assuming Nf ≪ Nc , where Nf denotes the
number of flavors. With such an approximation, the modification of flavor probe
1
Here χr is equivalent to 2χ(1,2) /χiso (T ) defined in [162]. Also, k = (−ω, 0, 0, ω) and k =
(−ω, ω, 0, 0) correspond to θ = 0 and θ = π/2 therein.
2
Following the convention therein, χǫT = 2χ(1(2)) .
91
Χr
2.0
1.5
1.0
0.5
Ω
2
4
6
8 10 12 14 ΠT
Figure 4.7: The blue, green, and red curves(from top to bottom) represent the ratios of spectral densities at fixed temperature for ǫT = ǫx or ǫy when k = (−ω, 0, 0, ω),
for ǫT = ǫy and ǫT = ǫz when k = (−ω, ω, 0, 0), respectively. Here we take uh = 1
and a/T = 4.4.
branes to the background geometry is O(Nf /Nc ) suppressed, which will be neglected
in this paper. The flavor D7 brane extended into the bulk shares the same spacetime
dimensions with the D3 brane on the boundary and wraps an S 3 inside the S 5 ,
dΩ25 = dθ2 + sin2 θdΩ23 + cos2 θdη 2 .
(4.29)
For convenience, we hereafter work in the string frame. The flavor D7 brane is
characterized by the Dirac-Born-Infeld (DBI) action,
S = −Nf TD7
d8 xe−φ
D7
−det(G + 2πls2 F ),
(4.30)
where G is the induced metric on the D7 branes, F = dA is the U(1) field strength for
the massless gauge fields coupled to the brane, and TD7 = (2πls )−7 (gs ls )−1 is the D7brane string tension. The induced metric in the string frame led by the embedding
of the flavor branes in the MT geometry reads [162]
ds2D7 =
1
−F (u)B(u)dt2 + dx2 + dy 2 + H(u)dz 2
u2
1
1
1 − ψ(u)2 + u2 F (u)e 2 φ(u) ψ(u)′2 2
+
du + e 2 φ(u) (1 − ψ(u)2 )dΩ23 ,
2
2
u F (u)(1 − ψ(u) )
92
(4.31)
where
1 − ψ(u)2 = sin θ represents the radius of the internal S 3 wrapped by the
D7 branes. To compute the leading-order contribution of photon spectra, we could
preserve the quadratic order in the field strength for the D7-brane action,
S = −Nf TD7
d8 xe−φ
D7
−det(G) 1 +
(2πls )2 2
F .
4
(4.32)
By treating the expansion of the field strength in the DBI action perturbatively, we
could neglect the back-reaction of gauge fields to the induced metric. The D7-brane
action now reads
S = −KD7
3
dtd xduF
2 (1
3φ
− ψ 2 )e− 4
u5
1
B(1 − ψ 2 + u2 F e 2 φ ψ ′2 ),
(4.33)
where the prefactor KD7 includes the integration over the internal space Ω3 wrapped
by the D7 branes. By following the standard AdS/CFT prescription as shown in the
previous section, the spectral functions of electromagnetic probes can be obtained.
In the case of trivial embedding ψ = 0, which corresponds to the massless-quark
case, the spectra reduce to the results we acquired in the previous section except for
the difference in the prefactors.
To incorporate massive quarks, we have to consider nontrivial embeddings ψ = 0.
In the absence of the gauge fields, we derive the field equation of ψ by minimizing
93
the action in (4.32),
ψ ′′ (u) + C1 ψ ′ (u) + C2 ψ ′ (u)3 + C3 ψ(u) + C4 ψ(u)3 = 0,
C1 =
F′
H′
3 φ′
B′
+
+
− + ,
2B
F
2H u
4
φ
φ
C2
e 2 F u2
4e 2 F u
= −
+
(1 − ψ 2 ) 2(1 − ψ 2 )
C3
3e 2
4ψ ′2
= 2
+
,
u F (1 − ψ 2 ) (1 − ψ 2 )
C4
3e 2
.
= − 2
u F (1 − ψ 2 )
F ′ B ′ H′
+
+
F
B
H
,
−φ
−φ
(4.34)
The field equation in (4.34) can be solved by imposing proper boundary conditions
near the horizon [143, 144], where we take
ψ(uh ) = ψ0 ,
ψ ′ (uh ) = (−3u−2 e−φ/2 ψ/F ′ )|u=uh .
(4.35)
Here we only consider the black hole embedding as a deconfined phase of the plasma,
which corresponds to the choice of 0 ≤ ψ0 < 1 [143]. At nonzero anisotropy, the
asymptotic solution will contain extra logarithmic terms in comparison with the
isotropic case shown in (2.41),
ψ(u) = m
u
21/2 uh
+c
u3
u3
2
+
a
ρ
log(u/uh) . . . ,
3
23/2 u3h
u3h
(4.36)
which come from the anisotropy. The numerical computations of c may become
technically difficult due to the presence of the leading logarithmic term, while the
extraction of m is straightforward. Further discussions of black hole embeddings in
the MT geometry can be found in Appendix B.2. In Fig.5.1, the quark mass scaled
by temperature with respect to ψ0 for the black hole embeddings with anisotropy
is represented by the dashed blue curve, while the solid blue curve corresponds to
94
the isotropic case. The critical mass at ψ0 → 1 now is increased by anisotropy or
equivalently the dissociation temperature is reduced. In fact, as shown in [145], the
black hole embedding near ψ0 = 1 could be metastable or unstable and the phase
transition occurs within this region in the isotropic case. To manifest the phase
transition near ψ0 = 1 in the anisotropic case requires further investigation on the
thermodynamics of the flavor brane in Minkowski embeddings, which is beyond the
scope of this dissertation.
After solving the induced metric of the flavor probe brane, we can now compute
photon spectra. By taking the Fourier transform of gauge fields as (4.33), the action
near the boundary becomes
Sǫ = −2KD7
QD7 =
d4 k QD7
(2π)4 u
−
√
3φ
(1 − ψ 2 )2 BF e− 4
1−
ψ2
+
1
1 ∗ ′
1
At At + A∗⊥ A′⊥ + A∗z A′z ,
FB
H
(4.37)
,
u2 F e 2 φ ψ ′2
where the gauge fields have to obey the field equations
3φ
µα
νβ
∂µ (MG G Fαβ ) = 0,
(1 − ψ 2 )e− 4
M=
u5
1
B(1 − ψ 2 + u2 F e 2 φ ψ ′2 ).
(4.38)
Recall that Gµν here is the induced metric of D7 branes. To convert (4.37) and
(4.38) into gauge-invariant forms, we may follow the general derivation presented
in Appendix B.1. From (B.6) and H → 1 near the boundary, we have the photon
spectral density
QD7 Ej′ (u, ω)
χǫj (ω) = 8KD7 Im lim
,
u→0 uEj (u, ω)
(4.39)
where Ej (u, ω) = ωAj (u, k)|k0=−ω for j being the transverse polarization. As discussed in the previous section, the gauge field with k = (−ω, 0, 0, ω) and the transverse polarization preserves rotational symmetry on the x−y plane, which is governed
95
by just one equation of motion, whereas for the field with k = (−ω, ω, 0, 0), the two
types of transverse polarizations Ay and Az should obey different field equations due
to the presence of anisotropy along the z direction. The computations of solving
the field equations can be carried out numerically by imposing the incoming-wave
boundary conditions. At mid-anisotropy for a/T = 4.4 or equivalently a/s1/3 = 1.2,
the medium forms a prolate in the momentum space with the ratio of pressures
Pz /Px,y ≈ 1.5. In the rest of the dissertation, we will focus on the mid-anisotropy
region when considering the anisotropic effect on photon production.
To compare the anisotropic spectral densities with isotropic ones, we have to fix
the quark mass and temperature of the media. Here we define the rescaled mass
√
ˆ Q = 2πMq / λ. The spectral functions for photons moving along the anisotropic
M
direction are shown in Fig.4.8, while the results for photons moving perpendicular to
the anisotropic direction are illustrated in Fig.4.9, where the spectral functions are
in units of πT . At small ω
ˆ = ω/(πT ), the spectral functions contributed from the
quarks with different mass possess distinct features, while the qualitative structures
of isotropic and anisotropic spectra are similar. At large ω
ˆ = ω/(πT ), the effect
from the difference of quark mass are suppressed by the energy of photons; the
spectra hence converge to the same amplitudes. Nevertheless, as shown in Fig.4.8, the
anisotropic spectra for photons moving along the anisotropic direction receive overall
enhancement in amplitudes. For the photons moving perpendicular to the anisotropic
direction, the amplitudes of anisotropic spectra can be smaller or larger than the
isotropic ones depending on the quark mass and the polarization as illustrated in
Fig.4.9. At large ω
ˆ , the anisotropic spectra for photons moving perpendicular to the
anisotropic direction saturate the isotropic ones.
96
Χ Ω
Χ Ω
16 KD7 Ω
0.25
16 KD7 Ω
0.25
0.20
0.20
0.15
0.15
0.10
0.10
0.05
Ω
0.05
Ω
1
2
3
4
5
1
2
3
4
5
6 ΠT
Figure 4.9: The red, green, and
blue curves(from top to bottom) represent the spectral functions with k =
(−ω, ω, 0, 0) and the y−polarization for
ˆ q /(πT ) = 0.61, 0.89, and 1.31. The
M
thin ones correspond to isotropic results. The thick ones and dashed ones
correspond to the anisotropic results
with ǫy and ǫz , respectively. Here we
take uh = 1 and a/T = 4.4.
6 ΠT
Figure 4.8: The red, green, and
blue curves(from top to bottom) represent the spectral functions with k =
ˆ q /(πT ) = 0.61, 0.89,
(−ω, 0, 0, ω) for M
and 1.31.The dashed ones and solid
ones correspond to the results with and
without anisotropy, respectively. Here
we take uh = 1 and a/T = 4.4.
4.5 Concluding Remarks
In this chapter, we have calculated the maximum stopping distance of an energetic
jet traveling in a strongly coupled anisotropic plasma by analyzing the null geodesic
of a massless particle falling in the dual geometry. We carried out the investigation
from low anisotropy to large anisotropy. At small anisotropy, the stopping distances
slightly decrease in comparison with the isotropic case for fixed temperature, energy
density, and entropy density, respectively. At mid or large anisotropy, we found
that the anisotropic stopping distances are generally smaller than the isotropic ones
at equal temperature or equal entropy density especially along the longitudinal direction. However, along the transverse direction, the suppression of the stopping
distance becomes less prominent at equal temperature. When fixing the entropy
density, the transverse stopping distance is even larger than the isotropic one. In
97
addition, we have computed the thermal-photon production in the anisotropic background. The massive quarks are involved in the anisotropic background through the
black hole embedding in the D3-D7 system. The spectra for photons moving along
the anisotropy direction are enhanced, while the ones moving perpendicular to the
anisotropic direction receive no enhancement compared to the isotropic results at
large frequency.
98
5
Photon Production with a Strong Magnetic Field
The work in this chapter was first published in [131, 132]. As discussed in Section
1.4, the photon production led by the magnetic field in heavy ion collisions may be
an important effect to generate large v2 of direct photons. In the weakly coupled
scenario, the photon production with magnetic field has been studied in a variety of
approaches[116, 117, 118, 119, 120]. In the strongly coupled scenario, the thermal
photon production with constant magnetic field in holography have been studied
[169, 170, 171]. In [170], it is shown that the photon production perpendicular to the
magnetic field in D3/D7 and D4/D6 embeddings with massless quarks is enhanced.
In [171], the photon v2 is computed in the framework of Sakai-Sugimoto model[15].
In this chapter, we will consider the thermal-photon production with a constant
magnetic field in the D3/D7 system. In Section 5.1, we firstly introduce a constant
magnetic field through the world-volume field strength coupled to D7 branes. In
Section 5.2, we subsequently compute the photon production led by the magnetic
field in the anisotropic plasma. In Section 5.3, we evaluate the thermal-photon v2
caused by the magnetic field in an isotropic plasma with 2 + 1 flavors. Eventually,
99
we make concluding remarks in Section 5.4.
5.1 External Magnetic Fields
In order to incorporate a constant magnetic field, we may turn on the world-volume
field strength on D7 branes as shown in (2.5). The DBI action for the D7 branes
now reads
d8 x −det(Gµν + 2πls2 Fµν ).
SD7 = TD7
By setting 2πls Ay = Bz x, we have a constant magnetic field Bz
(5.1)
1
along the z axis.
We may start from the AdS-Schwarzschild background, where the DBI action can
be explicitly written as
S = −KD7
dtd3 xdu
(1 − ψ 2 )
(1 + Bz2 u4 )1/2 × (1 − ψ 2 + u2 f ψ ′2 )1/2 ,
5
u
where TD7 = (2πls )−7 (gs ls )−1 is the D7-brane string tension for KD7 = Nf TD7 (πls )2 Ω3 .
The field equation for ψ is then given by
ψ ′′ −
+
3 + Bz2 u4 f ′
−
u + Bz2 u5
f
3 + 4u2f ψ ′2
u2 f (−1 + ψ 2 )2
u (4 (2 + Bz2 u4 ) f − u (1 + Bz2 u4 ) f ′ )
2 (1 + Bz2 u4 ) (−1 + ψ 2 )
ψ′ +
ψ−
2 (3 + 2u2 f ψ ′2 ) 3
ψ = 0.
u2 f (−1 + ψ 2 )2
ψ
(5.2)
Although the field equation for ψ now becomes more complicated, the contribution
from the magnetic field vanishes on the boundary. Thus, the near boundary solution
for ψ is not modified compared to the case in the absence of a magnetic field, which
reads
ψ(u)|u→0 = m
u
21/2 uh
+c
1
u3
+ ...,
23/2 u3h
(5.3)
Notice that the Bz here is the reparametrized magnetic field. The magnitude of the real magnetic
field should be written as eB = Bz /(2πls2 ) = Bz π −1 λ/2 for L = 1, which depends on the t’Hooft
coupling.
100
while the relation between m and c will be altered by the equation of motion in the
bulk. It is shown in [172] that c = 0 for m = 0 when the magnetic field exceeds
a critical value. In such a condition, the chiral symmetry is always broken. This
result qualitatively agrees with the so called magnetic catalysis in QCD, where the
presence of a strong magnetic field favors the chiral symmetry breaking. The ψ in
the field equation can be solved numerically with the same manner as in the cases
with zero magnetic field. By analyzing the near-horizon expansions of ψ, one finds
that the relation between ψ0 and ψ0′ is not altered by the inclusion of magnetic field.
We may now proceed to the black hole embedding with the anisotropic background. Here we consider the presence of constant magnetic field by turning on the
worldvolume U(1) gauge field 2πls2 Ay = Bz x and 2πls2 Ax = By z in (4.30), which
generate the magnetic field Bz and By along the z and y directions, respectively. To
simplify the computations, we will include the magnetic field in one of the directions
alone. In the isotropic case, these two setups should degenerate, while the degeneracy will be broken when we further incorporate the pressure anisotropy. The explicit
forms of the DBI actions now become
3φ
S = −Nf TD7
(1 − ψ 2 )e− 4
dx
u5
S = −Nf TD7
(1 − ψ 2 )e− 4
dx
u5
8
1
B(1 + Bz2 u4 )(1 − ψ 2 + u2 F e 2 φ ψ ′2 ), and
φ
8
1
B(H + By2 u4 )(1 − ψ 2 + u2 F e 2 φ ψ ′2 ),
(5.4)
which lead to same field equations as (4.34) with the following substitutions,
φ
2Bz2 u3
C1 → C1 |Bz =0 +
,
1 + Bz2 u4
C1 → C1 |By =0 +
By2 u3 (4H − uH′ )
2H By2 u4 + H
2Bz2 e 2 u5 F
C2 → C2 |Bz =0 +
, and
(1 + Bz2 u4 ) (1 − ψ 2 )
φ
,
C2 → C2 |By =0 +
By2 e 2 u5 F (4H − uH′ )
2H By2 u4 + H (1 − ψ 2 )
.
The ψ in the field equation can be solved numerically with the same manner as
in the cases with zero magnetic field. Different values of quark mass obtained by
101
varying ψ0 for black hole embeddings in the presence of magnetic field or anisotropy
are illustrated in Fig.5.1. It is found that the magnetic field reduces the critical
mass or increases the dissociation temperature, which results in an opposite effect
to the pressure anisotropy. Recall that the critical mass refers to the mass of quarks
obtained from the black hole embedding near the critical embedding at ψ0 → 1. The
suppression of critical mass by magnetic field has been found in [172] as well.
2 Mq
Χ Ω
T Λ
1.4
16 KD7 Ω
1.2
0.20
1.0
0.8
0.15
0.6
0.10
0.4
0.2
0.05
0.2
0.4
0.6
Ψ0
0.8
Ω
Figure 5.1: The blue and red solid
curves(from top to bottom) represent
the quark mass scaled by temperature
without and with magnetic field Bz , respectively. The blue, green, and red
dashed curves(from top to bottom) correspond to the anisotropic case without magnetic field, with By , and with
Bz , respectively. Here we set uh = 1,
By = Bz = 2(πT )2 , and a/T = 4.4.
1
2
3
4
5
6 ΠT
Figure 5.2: The red, green, and
blue curves(from top to bottom) represent the spectral functions with k =
ˆ q /(πT ) = 0.45, 0.65,
(−ω, 0, 0, ω) for M
and 0.86, respectively.
The solid,
dashed, and dot-dashed correspond to
(a/T, Bz /(πT )2 ) = (0, 0), (0, 2), and
(4.4, 2), respectively.
5.2 Photon Production from Magnetic Fields in Anisotropic Plasmas
To generate the electromagnetic currents on the boundary, we should further introduce the perturbation of gauge fields in the presence of a magnetic field. To the
quadratic order in the field strength, the D7-brane action is
S = −Nf TD7
8
−φ
d xe
D7
(2πls )2 2
−det(Gµν ) 1 +
F ,
4
102
(5.5)
where Gµν is now the induced metric of the D7 branes incorporating the magnetic
field. The diagonal elements of Gµν are the same as those in the absence of magnetic
fields, while the off-diagonal terms Gxy (Gxz ) = −Gyx (Gzx ) = Bz (−By ) receive the
contributions from nonzero magnetic fields. By taking Fourier transform of the gauge
fields, the near boundary actions can be written as
Sǫ = −2KD7
d4 k QBz
(2π)4 u
1 ∗ ′ A∗x A′x + A∗y A′y
1
−
At At +
+ A∗z A′z ,
2
4
FB
1 + Bz u
H
Sǫ = −2KD7
d4 k QBy
(2π)4 u
−
A∗y A′y + A∗z A′z
1 ∗ ′
At At + A∗x A′x +
FB
H + By2 u4
,
(5.6)
where
3φ
(1 − ψ 2 )2 F
QBz =
B(1 + Bz2 u4 )e− 4
1
,
1 − ψ 2 + u2 F e 2 φ ψ ′2
φ
B(H + Bz2 u4 )e− 4
(1 − ψ 2 )2 F
QBy =
1−
ψ2
+
1
.
(5.7)
u2 F e 2 φ ψ ′2
The field equations of the gauge fields here also take the Maxwell form,
∂µ (
−detGµν e−φ Gµα Gνβ Fαβ ) = 0.
(5.8)
The equations above can be converted into gauge-invariant forms from the general
expressions in Appendix B.1. Here we list the diagonal terms of the induced metric
pertinent to the computations,
Gtt = −
Gzz =
u2
,
FB
u2
,
H
Gxx = Gyy =
Guu =
u2
,
1 + Bz2 u4
u2 F (1 − ψ 2 )
φ
1 − ψ 2 + u2 F e 2 ψ ′2
103
(5.9)
for Bz = 0 and
Gtt = −
G
yy
u2
,
FB
2
= u,
G
Gxx = HGzz =
uu
=
u2 H
,
H + By2 u4
u2 F (1 − ψ 2 )
φ
1 − ψ 2 + u2 F e 2 ψ ′2
(5.10)
for By = 0. After solving the field equations, we can follow the same procedure as
introduced in the previous chapter to compute the spectral functions of photons. To
compare the results in the presence of the magnetic field and anisotropy, we have
to fix the temperature and quark mass in different setups. We firstly consider the
situation when the magnetic field points along the anisotropic direction for which the
results are shown in Fig.5.2, Fig.5.3, and Fig.5.4, where the spectral functions are in
the unit of πT . As shown in Fig.5.2, the spectra for photons emitted parallel to the
magnetic field are suppressed at small ω
ˆ , while they saturate the isotropic spectra
in the absence of magnetic field at large ω
ˆ . When further incorporating the pressure
anisotropy, the spectra for photons emitted parallel to the anisotropic direction are
enhanced, which is similar to the scenario in the absence of magnetic field as shown in
the previous chapter; their amplitudes surpass the isotropic ones with zero magnetic
fields at large ω
ˆ.
For the photons emitted perpendicular to the magnetic field, as shown in Fig.5.3
and Fig.5.4, their spectra are enhanced at large ω
ˆ . Also, the anisotropic effect
makes no drastic modifications to the spectra at large ω
ˆ . However, at moderate
ω
ˆ , a resonance emerges in the spectrum led by heavy quarks for photons moving
perpendicular to the magnetic field. The resonance is more prominent when the
photons are polarized parallel to the magnetic field as illustrated by the dashed blue
curve in Fig.5.4. When further incorporating the pressure anisotropy, the resonance
is smoothed out.
In the zero-frequency limit, we can also evaluate the DC conductivity by em104
ploying (4.28), where the results are shown in Fig.5.5 and Fig.5.6. As illustrated in
Fig.5.5, compared to the isotropic case in the absence of magnetic field, we find that
the conductivity for photons with the polarization perpendicular to the anisotropic
direction is enhanced in particular for the embedding with heavy quarks. On the
contrary, the conductivity for the polarization perpendicular to the magnetic field
is suppressed. When the quark mass is increased, the suppression becomes more
robust. In contrast, as illustrated in Fig.5.6, for photons with the polarization along
the anisotropic direction, the conductivity is almost unchanged compared to the
isotropic one except for the embedding with heavy quarks. However, the conductivity for the photons with the polarization parallel to the magnetic field is larger
than the isotropic one for the embedding with light quarks. When the quark mass is
increased, the enhancement monotonically decreases and even turns into suppression
when approaching the critical mass.
When the magnetic field and anisotropy coexist and point perpendicular to each
other, the rotational symmetry is fully broken. The photons moving in distinct directions with different polarizations will lead to a variety of spectra, but the general
features are not particularly altered from what we have discussed in the paragraph
above. The spectra for photons moving parallel to the anisotropic direction and
perpendicular to the magnetic field receive the maximum enhancement at large frequency. When the photons are emitted perpendicular to the magnetic field in the
isotropic medium, the resonance appears for the spectra with heavy quarks at moderate frequency. The presence of anisotropy then smooths out the resonance regardless
of the moving directions of photons. We merely present the results in Fig.5.8-5.13
for reference, where the correspondences between the colors of curves and different
values of quark mass are the same as those in Fig.5.2.
The enhancements of the photon spectra with massive quarks at large frequency
led by anisotropy and magnetic fields are somewhat expected since the enhancements
105
Χy Ω
Χz Ω
16 KD7 Ω
0.30
16 KD7 Ω
0.25
0.4
0.20
0.3
0.15
0.2
0.10
0.1
0.05
Ω
1
2
3
4
5
Ω
6 ΠT
1
Figure 5.3: The red, green, and
blue curves(from top to bottom)
represent the spectral functions with
k = (−ω, ω, 0, 0) and ǫT = ǫy for
ˆ q /(πT ) = 0.45, 0.65, and 0.86,
M
respectively.
The solid, dashed,
and
dot-dashed
correspond
to
2
(a/T, Bz /(πT ) ) = (0, 0), (0, 2),
and (4.4, 2), respectively.
2
3
4
5
6 ΠT
Figure 5.4: The red, green, and
blue curves(from top to bottom)
represent the spectral functions with
k = (−ω, ω, 0, 0) and ǫT = ǫz for
ˆ q /(πT ) = 0.45, 0.65, and 0.86,
M
respectively.
The solid, dashed,
and
dot-dashed
correspond
to
(a/T, Bz /(πT )2 )=(0, 0), (0, 2), and
(4.4, 2), respectively.
have been found in the limit of massless quarks [162, 170]. When the energy of photons dominates the quark mass, the contributions from massive and massless quarks
should degenerate. The enhancements will persist for ω
ˆ → ∞. In the coexistence
of both effects, the enhancement of the spectra could be further amplified. As illustrated in Fig.5.10 and Fig.5.11, for which the magnetic field is perpendicular to
the anisotropy direction, the spectra at large frequency in the presence of the magnetic field can be further enhanced by anisotropy. When the photons move along the
anisotropic direction in the above situation, their amplitudes of the spectra can be
maximally enhanced. Such a scenario may be in analogy to the photon production
in relativistic heavy ion collisions. In the peripheral collisions in experiments, the
orientation of the averaged magnetic field generated by two colliding nuclei should
be perpendicular to the reaction plane. The initial geometry of the medium will
lead to pressure anisotropy, in which the largest pressure is perpendicular to the
106
Σaniso Ε y
Σaniso Εz
Σiso Ε y
Σiso Εz
2.5
1.4
1.0
0.8
0.6
0.4
0.2
0.0
0.2
0.4
0.6
0.8
2 Mq
2.0
T
1.5
Λ
2 Mq
0.2
0.5
0.4
0.6
0.8
T
Λ
0.0
Figure 5.5: The ratios of DC conductivity with ǫT = ǫy versus quark mass.
The red(triangle), green(circle), and
blue(square) dots correspond to the
cases with (a/T, Bz /(πT )2 )=(4.4, 0),
(0, 2), and (4.4, 2), respectively.
Figure 5.6: The ratios of DC conductivity with ǫT = ǫz versus quark mass.
The red(triangle), green(circle), and
blue(square) dots correspond to the
cases with (a/T, Bz /(πT )2 )=(4.4, 0),
(0, 2), and (4.4, 2), respectively.
averaged magnetic field and to the beam direction2 . At mid rapidity, the observation of large elliptic flow of direct photons corresponds to the excessive production
of photons along the orientation with largest pressure. In our model, the maximum
enhancement of the thermal photons produced along the anisotropic direction and
perpendicular to the magnetic field may qualitatively suggest the cause of such large
flow of direct photons.
Nonetheless, there exist caveats when making the comparison above beyond the
difference in the SYM theory and QCD. Firstly, the pressure anisotropy in the MT
model is distinct from the one in QGP in directions. In the MT model, the rotational
symmetry is still preserved on the plane perpendicular to the anisotropic direction
with larger pressure, which is drastically distinct from the QGP that the rotational
symmetry should be fully broken. Second, the medium will gradually expand and
thus the temperature of QGP could be spacetime dependent. Furthermore, the
2
Here we simply refer the pressure to the energy stress tensor in the lab frame. In anisotropic
hydrodynamics, the pressure on the transverse plane perpendicular to the beam direction should
be isotropic in the co-moving frame, while the pressure gradient along the reaction plane is greater
than that perpendicular to the reaction plane.
107
d
Γ
Ω
ΕT
KD7 d 3 k
0.0005
0.0004
0.0003
0.0002
0.0001
Ω
1.0
1.2
1.4
1.6
1.8
2.0
2.2
2.4
ΠT
Figure 5.7: The red and blue (upper and lower at ω/(πT ) = 1) curves represent the
ˆ q /(πT ) = 0.45
differential emission rate per unit volume with k = (−ω, ω, 0, 0) for M
and 0.86. The solid, dashed, and dot-dashed ones correspond to (ǫT , Bz /(πT )2 ) =
(ǫz(y) , 0), (ǫz , 2), and (ǫy , 2), respectively.
magnetic field generated by the colliding nuclei should decay rapidly with time. The
lifetime modified by the presence of matter (thermal quarks) is controversial, where
the different estimates can be found in [126, 173] and [127]. Despite the distinction
between our model and QGP in reality, the results from such a toy model still provide
us qualitative understandings of the influence of pressure anisotropy and magnetic
fields on the photon production in the strongly coupled scenario.
At moderate frequency, the spectra with heavy quarks in the presence of magnetic
fields and anisotropy are rather intriguing. As indicated in [174], the resonance appearing in photon spectra may implies the decay of heavy mesons to on-shell photons.
In the previous study of photon spectra with massive quarks in the absence of magnetic fields in an isotropic medium [13], it has been shown that the resonance starts
to emerge when the quark mass approaches the critical mass. Since the presence of a
magnetic field reduces the critical mass, the resonance appears for the spectrum with
smaller quark mass, which suggests that the decay from lighter mesons to on-shell
photons will be accessible with the aid of the magnetic field. Moreover, the dependence on orientation and polarization with respect to the magnetic field makes the
108
resonance distinguishable from the isotropic one triggered by the increase of quark
mass in the absence of magnetic fields [13].
Here we plot the differential emission rate per unit volume in the unit of (πT )2
in Fig.5.7 around moderate frequency, where the resonance from heavy quarks could
be comparable to the spectrum with lighter quarks in this regime. In the presence
of a magnetic field, the impact of the resonance on the shape of the spectrum at
moderate frequency is even more pronounced than the enhancement at large frequency, which could generate a mild peak of v2 at moderate frequency. Despite the
over-simplification of our model, the orientation-dependence resonance could give a
rise to the mild peak of v2 in the intermediate energy. On the other hand, it is
also indicated in [171] that the photons with out-plane polarizations, which correspond to the photons polarized along the magnetic field when moving perpendicular
to the field in our setup, will account for the primary contributions beyond small
frequency. The polarization dependence of the enhanced spectra of direct photons
could be substantial to clarify the cause of large v2 in future experiments.
On the contrary, the further inclusion of pressure anisotropy increases the critical
mass and thus reduces the resonance in our model, which favors the meson melting in the plasma. Our findings are consistent with [156, 161, 175], in which the
increase of anisotropy results in the decrease of the screening length of the quarkantiquark potential in the MT geometry at fixed temperature. At first glance, it
is surprising that the qualitative features of heavy-meson suppression led by pressure anisotropy found in the MT geometry are contradictory to those obtained in
weakly coupled approaches [176, 177] and anisotropic hydrodynamics [178, 179, 180]
for anisotropic QCD plasmas, where the anisotropic media result in less suppression
for heavy mesons in comparison with the isotropic ones. Nonetheless, one should
recall the difference between the setup in the MT model and in those approaches
more analogous to QGP in reality. In the MT model, the ratio of shear viscosity
109
to entropy density is decreased by the increase of pressure anisotropy [181]. This
is drastically different from the approaches related to QGP, in which the pressure
anisotropy makes the plasma more viscous. As a result, the anisotropic effect in
the MT model facilitates the deconfinement based on the suppression of the shear
viscosity to entropy density ratio while the anisotropy in the viscous QGP favors the
confinement of heavy mesons. We thus conclude that the resonance stemming from
the presence of magnetic field may not be suppressed by pressure anisotropy in QGP.
Χz Ω
Χy Ω
16 KD7 Ω
16 KD7 Ω
0.25
0.5
0.20
0.4
0.15
0.3
0.10
0.2
0.05
0.1
Ω
1
2
3
4
5
Ω
6 ΠT
1
Figure 5.8: The spectral functions
with k = (−ω, ω, 0, 0) and ǫT = ǫz . The
solid and dashed curves correspond to
(a/T, By /(πT )2 ) = (0, 2) and (4.4, 2),
respectively.
2
3
4
5
6 ΠT
Figure 5.9: The spectral functions
with k = (−ω, ω, 0, 0) and ǫT = ǫy . The
solid and dashed curves correspond to
(a/T, By /(πT )2) = (0, 2) and (4.4, 2),
respectively.
5.3 Thermal-Photon v2 Induced by a Constant Magnetic Field
As discussed in the previous section, the MT geometry may not characterize the
anisotropic QGP created in heavy ion collisions. We thus only focus on the effect
from magnetic fields on the v2 of thermal photons. In such as case, we will only apply
the isotropic and thermalized background corresponding to the AdS-Schwarzschild
geometry. We will then compute the v2 contributed by two massless quarks and
one massive quark with the mass close to the critical mass. Our setup is illustrated
in Fig.5.14, where the magnetic field is along the z direction and two types of po110
Χx Ω
Χy Ω
16 KD7 Ω
16 KD7 Ω
0.30
0.5
0.25
0.4
0.20
0.3
0.15
0.2
0.10
0.1
0.05
Ω
1
2
3
4
5
Ω
6 ΠT
1
Figure 5.10: The spectral functions
with k = (−ω, 0, 0, ω) and ǫT = ǫx . The
solid and dashed curves correspond to
(a/T, By /(πT )2 ) = (0, 2) and (4.4, 2),
respectively.
2
3
4
5
6 ΠT
Figure 5.11: The spectral functions
with k = (−ω, 0, 0, ω) and ǫT = ǫy . The
solid and dashed curves correspond to
(a/T, By /(πT )2) = (0, 2) and (4.4, 2),
respectively.
larizations ǫin and ǫout are considered. The four momentum of photons is written
as k = (−ω, 0, qy , qz ), where qy = ω cos θ and qz = ω sin θ. We will generalize the
computations in the isotropic case of [131] to the photon production with an arbitrary angle θ. Recall that we will take the quenched approximation by assuming
Nf ≪ Nc , where Nf denotes the number of flavors, and neglect the modification of
flavor probe branes to the background geometry. In our convention, we set the AdS
radius L = (4πgs Nc ls4 )1/4 = 1. The temperature of the medium is determined by
πT = u−1
h . For convenience, we will further set uh = 1 in computations. We then
turn on the worldvolume U(1) gauge field 2πls2 Ay = u2h Bz x coupled to the D7 branes,
which generates a constant magnetic field eB = u2h Bz /(2πls2 ) = Bz π −1
λ/2 along
the z direction. By further perturbing the DBI action in (5.2) with gauge fields, we
have the relevant action,
S = −KD7
dtd3 xduF 2
(1 − ψ 2 )
(1 + Bz2 u4 )1/2 × (1 − ψ 2 + u2 f ψ ′2 )1/2 ,
u5
where F = dA is the worldvolume field strength from perturbation.
In the presence of gauge fields in the background of the AdS-Schwarzschild ge111
Χx Ω
Χz Ω
16 KD7 Ω
0.14
16 KD7 Ω
0.12
0.12
0.10
0.10
0.08
0.08
0.06
0.06
0.04
0.04
0.02
0.02
Ω
1
2
3
4
5
Ω
6 ΠT
1
Figure 5.12: The spectral functions
with k = (−ω, 0, ω, 0) and ǫT = ǫx . The
solid and dashed curves correspond to
(a/T, By /(πT )2 ) = (0, 2) and (4.4, 2),
respectively.
2
3
4
5
6 ΠT
Figure 5.13: The spectral functions
with k = (−ω, 0, ω, 0) and ǫT = ǫz . The
solid and dashed curves correspond to
(a/T, By /(πT )2) = (0, 2) and (4.4, 2),
respectively.
ometry, the DBI action then gives rise to Maxwell equations
∂µ (
−det(Gµν )Gµα Gνβ Fαβ ) = 0,
(5.11)
where the diagonal terms of the induced metric read
G
tt
u2
,
= −
f (u)
Gzz = u2 ,
G
xx
Guu =
=G
yy
u2
=
,
1 + Bz2 u4
u2f (u)(1 − ψ 2 )
.
1 − ψ 2 + u2 f (u)ψ ′2
(5.12)
To compute the spectral functions, it is more convenient to convert the field equations into gauge invariant forms. For the in-plane polarization ǫT = ǫin = ǫx , the
computation is straightforward. By taking Ex = ωAx in momentum space, we have
to solve only one field equation,
Ex′′
√
uu
xx
+ (log( −GG G ))
′
Ex′
k¯ 2
− uu Ex = 0,
G
(5.13)
where G = det(Gµν ) and k¯2 = Gtt w 2 + Gyy qy2 + Gzz qz2 . For the out-plane polarization
ǫT = ǫout , we have to consider coupled equations. By implementing the relation
112
qy Ay + qz Az = 0 as shown in Fig.5.14, the field equations can be written into the
gauge-invariant forms as
√
Ez′′
Gzz q 2
+ (log( −GG G )) + ¯ 2 z
k
+
qy qz Gyy
k¯2
uu
log
zz
′
′
Gtt
Gzz
Ey′ −
+
log
′
Gtt
Gyy
Ez′ −
Ez′
k¯2
Ez = 0,
Guu
√
Gyy qy2
Ey′′ + (log( −GGuu Gyy ))′ + ¯2
k
qy qz Gzz
k¯2
log
′
Gtt
Gzz
log
′
Gtt
Gyy
Ey′
k¯ 2
Ey = 0,
Guu
(5.14)
where Ez(y) = qz(y) At + ωAz(y) . The Maxwell equations in (5.13) and (5.14) can
be solved numerically by imposing incoming-wave boundary conditions near the
iω
horizon[166], where E(u) ∼ (1 − u2 /u2h )− 4πT .
Since k¯2 ≈ −u6 ω 2 (1 + Bz2 cos2 θ) near the boundary, eq.(5.14) reduces to
(Gyy qy Ey′ + Gzz qz Ez′ )u→0 = 0.
(5.15)
By utilizing the relation above, the near-boundary action can be simplified as
−Sǫ
=
2KD7
d4 k
(2π)4
√
−GGuu jj ∗ ′
G Ej Ej ,
ω2
(5.16)
where j = x, y, z. We then evaluate the spectral density with the polarization ǫT via
R
χǫT (k0 ) = −4Im[ǫµT ǫνT Cµν
(k)]
= −4Im lim ω 2 ǫT µ ǫT ν
u→0
δ 2 Sǫ
δEµ∗ Eν
,
(5.17)
R
where Cµν
denotes the retarded correlator. For the in-plane polarization, we have
χǫin
−1
=
Im(CRxx )
8KD7
2KD7
= Im lim
u→0
√
113
uu
−GG G
′
xx Ex
Ex
.
(5.18)
For the out-plane polarization, we have
−1
χǫout
=
Im sin2 θCRyy + cos2 θCRzz
8KD7
2KD7
(5.19)
− cos θ sin θ(CRyz + CRzy )
= Im lim
u→0
√
−GGuu Gyy
Ey′
E′
+ Gzz z
Ey
Ez
,
where we utilize (5.15) to derive the second equality above. Solving the Ez and Ey
for the out-plane polarization is more involved with the coupled equations, for which
we discuss the technical details in the following. The procedure is similar to the
computations in [162].
z
ǫout
k
θ
θ
y
ǫin
x
Figure 5.14: The coordinates of the system, where the magnetic field points along
the z axis and the x axis is parallel to the beam direction. The k denotes the
momentum of emitted photons and θ denotes the angle between the momentum and
the x-y plane as the reaction plane; ǫout and ǫin represent the out-plane and in-plane
polarizations, respectively.
Given that the out-plane solution is written in terms of the relevant bases as
E out (u) = E 1 (u) + E 2 (u),
(5.20)
where E 1 (u) = Ey1 yˆ(u) + Ez1 zˆ(u) and E 2 (u) = Ey2 yˆ(u) + Ez2 zˆ(u), such bases should
reduce to E 1 (0) = Ey1 (0)ˆ
y and E 2 (0) = Ez2 (0)ˆ
z on the boundary, which correspond
114
to Ey and Ez in (5.19). Since At (0) = 0 on the boundary, the bases follow the
constraint Ey1 (0)/Ez2 (0) = − tan θ. The task will be to find these relevant bases.
Presuming that E a (u) = Eya (u)ˆ
y + Eza (u)ˆ
z and E b (u) = Eyb (u)ˆ
y + Ezb (u)ˆ
z are
two sets of incoming-wave solutions, the relevant bases should be formed by linear
combinations of the them. We thus define
E 1 (u) = a1 E a (u) + b1 E b (u),
E 2 (u) = a2 E a (u) + b2 E b (u).
(5.21)
The bases on the boundary then read
E 1 (0) = a1 E a (0) + b1 E b (0) = −E0 sin θˆ
y,
E 2 (0) = a2 E a (0) + b2 E b (0) = E0 cos θˆ
z,
(5.22)
where E0 = |E out (0)|. By solving the coupled equations above, we find
−Ezb (0) sin θ, Eza (0) sin θ
,
(a1 , b1 ) =
Eya (0)Ezb (0) − Eyb (0)Eza (0)
(a2 , b2 ) =
−Eyb (0) cos θ, Eya (0) cos θ
,
Eya (0)Ezb (0) − Eyb (0)Eza (0)
(5.23)
where we set E0 = 1 since the retarded correlators are invariant for an arbitrary
E0 . In practice, we could solve for two arbitrary incoming waves E a(b) (u). Then by
employing the coefficients shown in (5.23) to recombine these two solutions, we are
able to derive Ey (u) and Ez (u) for the out-plane polarization.
Finally, we may compute the elliptic flow v2 for photon production. In the lab
frame of heavy ion collisions, the four-momenta of photons can be parametrized as
kµ = (−kT cosh y˜, kT sinh y˜, kT cos θ, kT sin θ),
(5.24)
where y˜ denotes the rapidity and kT denotes the transverse momentum perpendicular
to the beam direction xˆ. Notice that ω = kT cosh y˜ ≈ kT at central rapidity(˜
y ≈ 0),
115
which reduces to our setup illustrated in Fig.5.14. The elliptic flow v2 is defined as
v2γ (kT , y˜)
=
2π
0
γ
dθ cos(2θ) d2dN
kT d˜
y
2π
0
γ
dθ d2dN
kT d˜
y
,
(5.25)
where Nγ is the total yield of the emitted photons. In thermal equilibrium, the
differential emission rate per unit volume is given by
ω
dΓγ (ǫT )
dΓγ (ǫT )
1 χǫT (k0 )
= 2
=
.
3
dk
d kT d˜
y
16π 3 (eβω − 1)
(5.26)
In general, we have to take four dimensional spacetime integral of the emission rate to
obtain the yield of photons. In our setup, where the medium is static, the spacetime
integral leads to a constant volume, which is irrelevant for v2 here. The elliptic flow
at central rapidity hence becomes
v2γ (ω, 0)
=
2π
0
dθ cos(2θ)χǫT (k0 )
2π
0
dθχǫT (k0 )
.
(5.27)
All physical observables now will be scaled by temperature of the medium. We
set Bz = 1(πT )2 , which corresponds to eB = 0.39 GeV2 in the regular scheme for
λ = 6π and the average temperature of the SYM plasma T = TQGP = 200 MeV. In
an alternative scheme[182], eB = 0.12 GeV2 for λ = 5.5 and T = 3−1/4 TQGP ≈ 150
MeV, where the temperature of SYM plasma is lower than that of QGP at fixed
energy density. In heavy ion collisions, the approximate magnitude of the magnetic
field is about the hadronic scale, eB ≈ m2π ≈ 0.02 GeV2 [126]. It turns out that the
magnitude of magnetic field in the alternative scheme is close to the approximate
value at RHIC. Even in the regular scheme, the magnitude of the magnetic field in
our model is not far from the approximate value. Hereafter we will make comparisons
to QGP in the alternative scheme.
We firstly consider the elliptic flow contributed from massless quarks, which corresponds to the trivial embedding(ψ ′ = 0). As shown in Fig.5.15, the presence of
116
v2
0.20
0.15
0.10
0.05
Ω
2
4
6
8 ΠT
Figure 5.15: The red(dot-dashed) and blue(dashed) curves correspond to the v2 of
the photons with in-plane and out-plane polarizations, respectively. The black(solid)
curve correspond to the one from the averaged emission rate of two types of polarizations. Here we consider the contribution from massless quarks at Bz = 1(πT )2 .
v2
0.30
0.25
0.20
0.15
0.10
0.05
Ω
2
4
6
8 ΠT
Figure 5.16: The colors correspond to the same cases as in Fig.5.15. Here we
consider the contributions from solely the massive quarks with m = 1.143 at Bz =
1(πT )2 .
a magnetic field results in nonzero v2 , while the v2 remain featureless(without resonances). Here the averaged v2 is obtained from the averaged emission rate of both
the in-plane and out-plane polarizations. Whereas quarks may receive mass correction at finite temperature, we should consider the contributions from massive quarks
as well. In addition, at intermediate energy, the photon spectra from the massive
quarks may lead to resonances coming from the decays of heavy mesons to lightlike photons[13, 174], which makes a considerable contribution to the spectra. As
117
v2
0.20
0.15
0.10
0.05
Ω
2
4
6
8 ΠT
Figure 5.17: The colors correspond to the same cases as in Fig.5.15. Here we
consider the contributions from both massless quarks and massive quarks with m =
1.143 at Bz = 1(πT )2 .
indicated in the previous section, the resonances in the presence of a magnetic field
depend on the moving directions of produced photons, which may generate prominent peaks in v2 . To incorporate the massive quarks, we choose ψ0 ≈ 0.95, which is
close to the critical embedding(ψ0 → 1). In fact, by further tuning ψ0 up to one, the
black hole embeddings may become unstable and multiple resonances will emerge in
photon spectra similar to the scenarios in the absence of magnetic field[13]. From
(2.41), we find m = 1.143 for the solution of the massive quarks, which corresponds
to the bare quark mass Mq = 204 MeV at the average RHIC temperature TQGP = 200
MeV in the alternative scheme. Due to the presence of the magnetic field and the
choice of the alternative scheme, the bare quark mass for the massive quark here is
smaller than that in [13, 174] to generate the resonance. As shown in Fig.5.16, a
mild peak emerges at intermediate energy for the photon v2 contributed from solely
the massive quarks.
In analogy to the thermal photon production in QGP, we may consider scenarios
in the 2+1 flavor SYM plasma. We sum over the photon emission rates from two
massless quarks and that from the massive quark with Mq = 204 MeV to compute
the v2 . The results are shown in Fig.5.17, where the resonances of v2 are milder.
118
In QGP, the regime in which the thermal photons make substantial contributions is
around pT ≈ 1 ∼ 4 GeV at central rapidity, where pT ≈ ω denotes the transverse
momentum of direct photons. By rescaling pT with πTQGP , such a regime corresponds
to ω/(πT ) ≈ 1.5 ∼ 6 in Fig.5.17 at TQGP = 200 MeV. It turns out that the v2 in
our holographic model resemble the RHIC data for the flow of direct photons at
intermediate pT [10]. Although the mass of the massive quark in our setup does not
match that of the strange quark, the mass we introduce is not far from the scale of
strange mesons. The resonances in our setup may suggest the transitions of strange
mesons to photons in QGP in the presence of a magnetic field. On the other hand,
the resonance of v2 coming from meson-photon transitions may not be subject to the
strongly coupled scenario. In the weakly coupled approach such as [118], where the
finite-temperature corrections to the intermediate meson in the effective coupling is
not considered, the photon production perpendicular to the magnetic field can be
possibly enhanced provided that the thermal dispersion relation of the intermediate
meson becomes lightlike.
Finally, we mention the caveats when making comparisons between our holographic model and heavy ion collisions in reality except for the intrinsic difference
between SYM theory and QCD. Firstly, the QGP undergoes time-dependent expansion, while the medium in our model is static in thermal equilibrium. Second, the
magnetic field produced by colliding nuclei is time-dependent, which decay rapidly in
early times. Although the influence of thermal quarks on the lifetime of the magnetic
field is controversial[126, 127, 173], the constant magnetic field in our model could
overestimate the flow. According to [126], the magnetic field decreases by a factor of
100 between the initial (0.1 fm/c)and final (5 fm/c) times in the presence of nonzero
conductivity. As a simple approximation, we may assume that the magnetic field
is described by a power-law drop-off, which results in B(t) ∼ 1/t1.2 . By taking the
initial and freeze-out temperature as Ti = 430 MeV and Tf = 150 MeV, we find the
119
freeze-out time τf ∼ 7 fm as we set the thermalization time τth = 0.3 fm and average
temperature Tavg ∼ 200 MeV with the Bjorken hydrodynamics T /Ti = (τth /τ )1/3 .
We than obtain the average magnetic field Bavg ∼ 0.1B0 with the setup above, where
B0 is the initial magnetic field. By utilizing the average magnetic field with the same
t’Hooft coupling and average temperature, we find that the v2 drop about 100 times
as shown in Fig.5.18.
Although the photon v2 here can only be evaluated numerically, it is approximately proportional to Bz2 for small Bz . As a result, we may as well consider the
2
result with average (eB)2 . With the above approximation, we find Bavg
∼ 0.031B02
2
∼ 0.031B02
corresponding to Bavg ∼ 0.18B0 . As shown in Fig.5.19, the v2 with Bavg
is 25 times smaller. However, as the nonlinear effect with large Bz becomes more
pronounced, the computation with average magnetic field may underestimate the
contribution from such a strong magnetic field in early times. It is thus desirable
to incorporate a time-dependent magnetic field in the setup as future work. On the
other hand, it is also worthwhile to notice that the v2 in our model is enhanced as
we turn down the coupling with fixed magnetic field and temperature through the
relation eB = Bz π −1
λ/2.
v2
0.0025
0.0020
0.0015
0.0010
0.0005
Ω
2
4
6
8 ΠT
Figure 5.18: The colors correspond to the same cases as in Fig.5.15. Here we
consider the contributions from both massless quarks and massive quarks with m =
1.307 at Bz = 0.1(πT )2 .
120
v2
0.012
0.010
0.008
0.006
0.004
0.002
Ω
2
4
6
8 ΠT
Figure 5.19: The colors correspond to the same cases as in Fig.5.15. Here we
consider the contributions from both massless quarks and massive quarks with m =
1.3 at Bz = 0.2(πT )2.
Since we choose the maximum magnetic field from its initial value, the v2 obtained
in our model should be regarded as the upper bound generated by solely magnetic
field in the strongly coupled scenario. In reality, such a mechanism only yields a
partial contribution to the measured v2 . As shown in [183], the viscous hydrodynamics also results in a substantial contribution to thermal-photon v2 . To construct
full v2 for thermal photons, both contributions from the magnetic field and from viscous hydrodynamics should be taken into account. Furthermore, in the alternative
scheme, the intermediate t’Hooft coupling is taken, where the corrections from finite
t’Hooft coupling in the gravity dual have to be considered. More explicitly, the next
leading order correction is of O(λ−3/2 ). It is found in [184] that the photoemission
rate increases as the coupling decreases in the absence of magnetic fields when the
O(λ−3/2 ) correction is included.
5.4 Concluding Remarks
In this chapter, we have evaluated the thermal photon spectra originating from massive quarks in the anisotropic plasma with moderate pressure anisotropy and a constant yet strong magnetic field through the holographic approach. At large frequency,
121
we found that the amplitudes of spectra with different quark masses are increased
by the magnetic field when the photons move perpendicular to it. The spectra for
photons moving parallel to the magnetic field saturate the results in the absence
of magnetic fields. At moderate frequency, the magnetic field triggers a resonance
for the spectrum with heavy quarks when the photons move perpendicular to the
magnetic field. The resonance becomes more robust when the photons are polarized
along the magnetic field. However, the pressure anisotropy leads to an competing
effect and suppresses the resonance. However, we conclude that the suppression may
not be applicable to the QGP produced in heavy ion collisions since the direction of
pressure anisotropy in the MT geometry is distinct from that in heavy ion collisions.
On the other hand, we have computed the elliptic flow v2 of thermal photons in a
strongly coupled plasma with a constant magnetic field. Our result is qualitatively
consistent with the direct-photon v2 measured in RHIC at intermediate energy. Nevertheless, due to the simplified setup, the thermal-photon v2 in our model should be
regarded as the upper bound for the v2 generated by solely the magnetic field in the
strongly coupled scenario.
122
6
Holographic Chiral Electric Separation Effect
The work in this chapter was first published in [133]. As discussed in Section 1.4,
the anomalous effects led by electromagnetic fields in heavy ion collisions have been
emphasized in recent years. There have been extensive studies in holography to
address the issues related to magnetic fields in strongly coupled plasmas. The CME
has been investigated in distinct thermalized backgrounds[185, 186, 187, 188, 189,
190, 191]. In the original paper of CMW[110], the propagating dispersion relation
was studied in the Sakai-Sugimoto(SS) model[15, 192]. In a recent study in [193],
the CME and CMW have been further investigated in out-of-equilibrium conditions.
Nevertheless, the existence of CME in SS model is somewhat controversial[186, 185,
188, 194]. The Chern-Simons(CS) term therein is crucial to generate an axial current
caused by a magnetic field, while it gives rise to an anomalous vector current. In
order to make the theory invariant under electromagnetic gauge transformations,
the Bardeen counterterm has to be introduced on the boundary, which turns out
to cancel the vector current and wipe out CME in the system[186]. It was argued
that the recipe to preserve both the gauge invariance and vector current is to allow
123
the non-regular bulk solutions, where the background gauge fields responsible for
chemical potentials become non-vanishing on the horizon[188, 194]. Unlike many
effects led by magnetic fields, CESE has not been analyzed in the strongly coupled
scenario. As a result, we investigate the CESE in the framework of SS model in
the presence of both vector and axial chemical potentials. Since axial anomaly is
irrelevant to CESE, the problem with the CS term for CME does not exist in our
approach.
This chapter is organized in the following order. In Section 6.1, we discuss the
axial electric conductivity, where we make a simple estimate for it based on the
power counting with small chemical potentials. In Section 6.2, we briefly review the
SS model. In order to compute both the normal and axial conductivities in the SS
model in the presence of small vector and axial chemical potentials we will perform
the background-field expansion to identify the origin of CESE in the effective action
in Section 6.3 and present the results in Section 6.4. In Section 6.5, we then solve
the full DBI action to evaluate both conductivities for arbitrary chemical potentials.
Finally, we make discussions in the last section.
6.1 Interpretation of Chiral Electric Conductivity
In a hot and dense system with massless chiral fermions, we can define two currents,
JR and JL with respect to left and right handed fermions. For simplicity, we neglect
the chiral anomaly in our discussion. In the presence of an external electric field
E, the left and right handed fermions will be dragged by the electric force and two
charge currents will be induced,
JR = σR eE,
JL = σL eE,
124
(6.1)
where e is the charge of fermions, σR/L denotes the left/right handed conductivity
as a function of µR/L and temperature T , with
µR/L = µV ± µA ,
(6.2)
the chemical potential of right/left handed fermions. On the other hand, it is straightforward to describe this system by two other currents, the vector and axial vector
currents,
=
1
(JR + JL ) = σV eE,
2
(6.3)
Ja =
1
(JR − JL ) = σ5 eE,
2
(6.4)
JV
where we can read from (6.1) that the normal and chiral electric conductivities are
given by,
=
1
(σR + σL ),
2
σ5 =
1
(σR − σL ).
2
σV
(6.5)
Here we find the chiral electric conductivity σ5 is induced by the interactions of
fermions and can exist without chiral anomaly. Also, given that µR = µL corresponding to σR = σL , the CESE should exist for arbitrary values of the chemical
potentials.
Now let us discuss the property of this new transport coefficient. Taking the
parity transform to (6.4), since left and right handed fermions will exchange with
each other, we get,
σ5 (x) = −σ5 (−x),
(6.6)
which implies it is a pseudo scalar. In the macroscopic scaling, there is only a pseudo
scalar in our system, µA . Therefore, in a small µA case, we can assume, σ5 ∝ µA .
125
Since we neglect the chiral anomaly, the system has a U(1)L × U(1)R symmetry.
We can take the charge conjugate transformation e → −e, µR/L → −µR/L to the
left and right handed currents (6.1) independently. Because E as an external field
does not change the sign, and the JR/L as charge currents will give minus signs,
finally we find σR/L (µR/L ) = σR/L (−µR/L ). In the small µR/L limit, we can get
σR/L = C1,R/L + C2,R/L µ2R + C3,R/L µ2L , with Ci as functions of T . On the other hand,
because the system is invariant under the chiral transformation, we get C1,R = C1,L ,
C2,R = C3,L , and C2,L = C3,R . Inserting these relations into (6.5) yields
σ5 = χe µA µV ,
(6.7)
where χe is a function of T . This relation is also assumed in Ref. [124].
Next, we discuss a special system where different chirality particles will not
interact with each other, i.e. right handed particles will only interact with right
handed particles, so do the left handed particles. Therefore, we can assume σR/L =
σR/L (T ; µR/L ). On the other hand, for chiral fermions without chiral anomaly, the
system will be invariant under the chiral transformation, i.e. one can exchange the
left and right handed fermions and the system is invariant. In this case, we can
rewrite σR/L as,
σR/L = σ(T ; µR/L ),
(6.8)
where σ is just a normal conductivity. Then, we get, in small µA cases,
σV
=
σ5 =
1
1 ∂ 2 σ(T, µV ) 2
(σR + σL ) = σ(T, µV ) +
µA + O(µ3A ),
2
2
∂µ2V
1
∂σ(T, µV )
(σR + σL ) =
µA + O(µ3A ),
2
∂µV
or
σ5 (T, µV , µA ) = µA ∂µV σV (T, µV ),
Later, we will show this behavior in our framework.
126
µA → 0.
(6.9)
Besides [124], this effect is also suggested in other weakly coupled systems.
Roughly speaking, different chiralities are quite similar to different flavors in a weakly
coupled hot QCD plasma. The flavor non-singlet currents correspond to the axial
currents here. It is shown that the conductivities of such flavor non-singlet currents
is nonzero and can be quite large in the case of large µ/T [195].
6.2 Basics of Sakai-Sugimoto model
In order to describe a strongly coupled chiral plasma, we have to introduce the chiral
symmetry in the gravity theory, while the chiral symmetry is not manifest in the
D3/D7 system. We thus introduce an alternative system incorporating fundamental
matter with chiral symmetry in the gauge/gravity duality proposed by Sakai and
Sugimoto(SS)[15, 192]. The SS model stems from the embeddings of Nf D8 branes
and Nf D8 branes in the background dictated by Nc D4 branes. The schematic
description of the embeddings is illustrated in Fig.6.1, where the x4 direction is compactified on an S 1 . The compactification yields a Kaluza-Klein mass MKK and breaks
supersymmetry. In vacuum, the solution of the D4 branes in Poincare coordinates
reads
ds2 =
U
L
f (U) = 1 −
3/2
−(dx0 )2 + (dxi )2 + f (U)dx24 +
3
UKK
,
U3
4
2
UKK = L3 MKK
,
9
L
U
3/2
dU 2
+ U 2 dΩ24 ,
f (U)
(6.10)
where L is the AdS radius. Note that the periodic boundary condition is imposed
along x4 , which results in MKK to avoid the conical singularity at U = UKK . The IR
wall at U = UKK implies that the dual gauge theory is confining. The embedded D8
branes and D8 branes are separated along the x4 direction on the boundary, while
they should coincide with each other in the bulk at U = U0 ≥ UKK as depicted in
Fig.6.2a. In this scenario, the chiral symmetry is spontaneously broken. At finite
127
Figure 6.1: The schematic description of the embeddings in the SS model[15].
Figure 6.2: D8-brane embeddings in the Sakai-Sugimoto model[16]:(a)chiral symmetry breaking in vacuum (b)chiral symmetry breaking in the plasma (c)chiral symmetry restored in the plasma. Here the black circles on top represent the compactified
x4 on S 1 and the red curves represent the D8 branes and D8 branes in the bulk.
temperature, an alternative solution becomes dominant, where the metric is given
by[196]
ds2 =
U
L
f (U) = 1 −
3/2
−f (U)(dx0 )2 + (dxi )2 + dx24 +
UT3
,
U3
L
U
3/2
dU 2
+ U 2 dΩ24 ,
f (U)
(6.11)
where UT is the position of the event horizon of a black hole in the bulk. Now, the
embedded D8 branes and D8 branes can be either connected as shown in Fig.6.2b
or disconnected as shown in Fig.6.2c. In the connected case, the chiral symmetry is
still broken, whereas the chiral symmetry is restored in the disconnected case.
For our purpose, we consider the SS model with an U(1)L symmetry assigned to
D8 and an U(1)R symmetry assigned to D8,
Stot = SD8 (AL ) + SD8 (AR ),
128
(6.12)
where AL/R represent the background gauge fields contributing to the chemical potentials in L/R sectors. The background geometry in Eddington-Finkelstein(EF)
coordinates with a black hole solution reads
ds
2
U
L
=
+
3/2
2
i 2
+ 2dUdt +
3
πgs Nc ls3 ,
−f (U)dt + (dx )
U
L
3/2
dx24
,
(MKK ls )2
L =
L
U
3/2
U 2 dΩ24
f (U) = 1 −
UT
U
3
, (6.13)
where gs = gY2 M (2πMKK ls )−1 is the string coupling and ls is the typical string length.
The D8/D8 branes now span the coordinates (U, t, xi , Ω4 ). Note that we use t to
denote the EF time in this chapter. We will only consider the deconfined phase,
where the temperature is determined by UT via
3
T =
4π
UT
L3
1/2
.
(6.14)
Note we also work in the chiral symmetry restored phase, where ∂U x4 = 0. The
reduced 5-dimensional action of D8/D8 branes is given by[185]
SD8/D8 = −CL9/4
∓
Nc
96π 2
d4 xdUU 1/4
det(g5d + 2πls2 FL/R )
d4 xdUǫM N P QR (AL/R )M (FL/R )N P (FL/R )QR ,
(6.15)
where
C = Nc1/2 /(96π 11/2 gs1/2 ls15/2 ),
det(g5d ) = (U/L)9/4 .
(6.16)
Here −(+) sign in front of the CS term corresponds to D8(D8) branes, while the CS
term does not affect CESE and will be discarded in our computations. The chemical
potentials dual to the boundary values of the time components of the background
gauge fields are
µL/R = lim (AL/R )t .
U →∞
129
(6.17)
Now, our strategy to compute the normal and axial conductivities will be the following: We firstly solve for the background gauge fields from the actions in (6.15) to
acquire the chemical potentials in the R/L bases. Then we perturb the actions with
electric fields to generate the R/L currents. Finally, by extracting the electric conductivities in the R/L sectors, we can evaluate the normal and axial conductivities
directly from (6.5).
Since both the normal conductivity σV and the axial conductivity σ5 have to
be evaluated numerically, we list the numerical values for all fixed parameters here
for reference. By following the convention in [185], where the numerical values are
chosen to fit the pion decay constant and ρ meson mass[192], we take
2πls2 = 1GeV−2 ,
λ = gY2 M Nc = 17,
MKK = 0.94GeV,
(6.18)
which gives
L3 = (2MKK )−1 (gY2 M Nc ls2 ) = 1.44GeV3 .
(6.19)
We further choose the temperature as the average temperature in RHIC,
T = 200MeV = 0.2GeV,
(6.20)
UT = 1.02GeV−1 .
(6.21)
which yields, via (6.14),
6.3 Background-Field Expansion
In comparison with the weakly-coupled approach in [124], we should consider the case
with small chemical potentials (µV (A) ≪ T ). The statement will be justified later in
this section. Thus, we have to treat the background gauge fields responsible for the
chemical potentials in the Dirac-Born-Infeld(DBI) actions in (6.15) perturbativly.
130
Now, by expanding the DBI actions up to quartic terms of the background gauge
fields, we find
SD8/D8 = −C
∓
Nc
96π 2
1
1
d4 xdUU 5/2 1 + F˜M N F˜ M N − (F˜M N F˜ M N )2
4
32
d4 xdUǫM N P QK AM FN P FQK ,
(6.22)
where F˜ = 2πls2 F and we omit the L/R symbols above for simplicity. We then define
the axial and vector gauge fields,
1
Aa = (−AL + AR ),
2
1
AV = (AL + AR ).
2
(6.23)
¯ branes together, the full action
By combining the contributions from D8 and D8
yields
Stot = −C
−
1
d4 xdUU 5/2 1 + (F˜aM N F˜aM N + F˜V M N F˜VM N )
2
(6.24)
1
1
(F˜aM N F˜aM N )2 + (F˜V M N F˜VM N )2 − F˜aM N F˜aM N F˜V P Q F˜VP Q
16
8
1
− (F˜aM N F˜VM N )2
4
+
Nc
48
d4 xdU (Aa ∧ Fa ∧ Fa + Aa ∧ FV ∧ FV + 2AV ∧ Fa ∧ FV ) .
The action then leads to the field equations,
1
1
∂M U 5/2 2FVM N − FVM N FV P Q FVP Q − FVM N FaP Q FaP Q − FaM N FaP Q FVP Q
2
2
= 0,
1
1
∂M U 5/2 2FaM N − FaM N FaP Q FaP Q − FaM N FV P Q FVP Q − FVM N FV P Q FaP Q
2
2
= 0.
Recall that the time components of the background gauge fields should contribute to
chemical potentials. We may set other components of the background gauge fields
131
to zero. In practice, it is more convenient to solve the field equations above by
reshuffling them into the L/R bases or directly minimize the D8 and D8 actions,
where the right-handed and left-handed fields are decoupled. In the L/R bases, the
equations of motions then become
∂M
1 MN ˜
PQ
MN
U 5/2 F˜(L/R)
− F˜(L/R)
F(L/R)P Q F˜(L/R)
4
= 0.
(6.25)
Since we only have to solve At (U), the equations of motion reduce to just one equation,
∂U
1 3
U 5/2 F˜(L/R)U t + F˜(L/R)U
t
2
= 0,
(6.26)
The equation of motion now yields three solutions,
F˜(L/R)U t =
−2 × 32/3 + 31/3 9y +
3 9y +
24 +
√
1±i 3
31/3 9y +
24 + 81y 2
24 + 81y 2
81y 2
1/3
2/3
,
1/3
+
i i±
√
3
(6.27)
9y +
24 + 81y 2
2 × 32/3
1/3
,
where
y = γL/R U −5/2
(6.28)
is a dimensionless parameter for γL/R being the integration constants. Near the
√
boundary y → 0, the three solutions reduce to y, ±i 2. Given that the first solution is normalizable on the boundary, we may choose it as the physical solution.
Also, the first solution is always real with an arbitrary value of y. As we make the
transformation γL/R → −γL/R , we find F˜(L/R)U t → −F˜(L/R)U t , where the negative
γL/R will contribute to negative chemical potentials. Notice that the validity of the
132
background-field expansion from the DBI action requires F˜(L/R)U t ≪ 1 at arbitrary
U. Since the region below the horizon U = UT is causally disconnected and the
physical solution monotonic increases with respect to y, the maximum of F˜(L/R)U t
locates on the horizon. From (6.27), we find a critical value yc = 1.5 such that
F˜(L/R)U t (y = yc ) = 1, which implies the valid integration constants γL/R should sat5/2
isfy γL/R ≪ yc UT . After obtaining the background-field strength, we subsequently
compute the chemical potentials by choosing the radial gauge A(L/R)U = 0 without
loss of generality. The chemical potentials in the L/R bases are given by
µ(L/R) = A(L/R)t (U = ∞) =
y(L/R)T
µ
˜(y(L/R)T ) =
0
−5/2
where y(L/R)T = γL/R UT
1 52
γ
µ
˜(y(R/L)T ),
5πls2 (L/R)
dy −2 × 3
y 7/5
2/3
+3
1/3
3 9y +
9y +
(6.29)
24 +
24 + 81y 2
81y 2
1/3
2/3
,
. We may now input the numerical values for relevant
coefficients to examine the validity of the background-field expansion in the limit of
small chemical potentials (µ(L/R) ≪ T ). We firstly rescale the chemical potentials
by temperature as
µ(L/R)
T R3
=
T
5πls2
4π
3
2
2
5
y(L/R)T
µ
˜(y(L/R)T ).
(6.30)
By taking y(L/R)T = yc = 1.5 with the numerical values of all parameters from (6.18)
to (6.21), we obtain the ratio to the critical chemical potential and temperature,
which reads
µ(L/R) (y(L/R)T = yc )
µc
=
≈ 4.51.
T
T
(6.31)
In our setup, it turns out that the small chemical potentials(µ(L/R) ≪ T ) correspond
to F˜(R/L)U t ≪ 1, which supports the background-field expansion. Moreover, the
133
expansion is even valid for intermediate chemical potentials(µ(L/R) ∼ T ). Recall that
5/2
the constraint for the integration constants γL/R now becomes γL/R ≪ yc UT
≈ 4.51
GeV−5/2 .
6.4 DC and AC Conductivities for Small Chemical Potentials
Subsequently, by further fluctuating the full action in (6.24) with gauge fields,
(AL(R) )µ → (AL(R) )µ + (aL(R) )µ ,
(6.32)
the expansion up to the quadratic terms of the fluctuations can be written as
(2)
Stot = −C
d4 xdUU 5/2
1
1 ˜2
(fV + f˜a2 ) − (f˜V2 F˜V2 + f˜a2 F˜a2 + F˜V2 f˜a2 + F˜a2 f˜V2 )
2
8
1
1
1
− (f˜V · F˜V )(f˜a · F˜a ) − (f˜V · f˜a )(F˜V · F˜a ) − (f˜V · F˜a )(f˜a · F˜V )
2
2
2
−
1 ˜ ˜ 2
(fV · FV ) + (f˜a · F˜a )2 + (f˜V · F˜a )2 + (f˜a · F˜V )2
4
+
Nc
16
d4 xdU (Aa ∧ fa ∧ fa + Aa ∧ fV ∧ fV + 2AV ∧ fa ∧ fV ) ,
where
F˜ 2 (f˜2 ) = F˜M N F˜ M N (f˜M N f˜M N ),
f˜ · F˜ (f˜ · f˜ or F˜ · F˜ ) = f˜M N F˜ M N (f˜M N f˜M N or F˜M N F˜ M N ),
fij = ∂i aj − ∂j ai ,
F˜ (f˜) = 2πls2 F (f ).
(6.33)
Since only the time components of the gauge fields AV (a)t (U) are nonzero, we have
FV2 (a) = −2(∂U AV (a)t )2 ,
FV M N FaM N = −2∂U AV t ∂U Aat .
(6.34)
We see that the cross terms of the vector and axial fluctuations may generate an
axial current proportional to the product of a vector chemical potential and an axial
134
chemical potential in the presence of an electric field similar to the case in [124].
Nevertheless, since F˜V (a) ∼ U −5/2 on the boundary as shown in (6.28), all these cross
terms actually vanish on the boundary. On the other hand, the cross terms still give
rise to the modifications of equations of motion in the bulk. It turns out that the
derivatives of the vector fluctuation aV with respect to U can depend on the axial
fluctuation aa and vice versa due to the mixing of the vector and axial gauge fields
in the equations of motion in the presence of both the vector and axial chemical
potentials. It is thus more convenient to work out conductivities of the vector and
axial currents in the L/R bases, where the left handed and right handed sectors are
decoupled.
Now, we should compute σR(L) in the L/R bases. The relevant terms in the
D8/D8 actions in the L/R bases read
(2)
SD8/D8 = −C
d4 xdUU 5/2
1
1 ˜2 1 ˜ ˜ 2
f − (f · F ) − f˜2 F˜ 2
4
8
16
,
(6.35)
L/R
where we drop the CS term here since it is irrelevant to CESE. The actions then lead
to decoupled equations of motion,
∂M
1
1
U 5/2 f˜M N − F˜ M N F˜ · f˜ − f˜M N F˜ 2
2
4
= 0.
(6.36)
L/R
Although we start in EF coordinates, it is more convenient to work in Poincare
coordinates to handle the holographic renormalization as we evaluate the currents.
In Poincare coordinates, the AdS5 part of the metric is rewritten as
ds25d =
U
L
3/2
−f (U)(dx0 )2 + (dxi )2 +
L
U
3/2
dU 2
,
f (U)
(6.37)
where x0 denotes the Poincare time. In fact, all equations previously shown in this
section without explicitly specifying the spacetime indices can be applied to both
135
EF coordinates and Poincare coordinates, which relies on the same
det(g5d ) =
(U/R)9/4 in two coordinates. One can actually show that At (U) = A0 (U) for AU = 0.
We will consider only the electric fluctuation eE3 = f03 along the x3 direction and
further choose the temporal gauge a0 = 0 without loss of generality. By choosing
such a gauge, the f˜ · F˜ terms in the actions and equations of motion above should
vanish. We then make an ansatz for the fluctuation as
0
a3 (U, x0 ) = e−iωx a3 (U, ω).
(6.38)
Hereafter the shorthand notation a3 denotes a3 (U, ω). The D8/D8 actions now
become
C
(2)
SD8/D8 = − (2πls2 )2
2
1
1 + F˜U2 0
2
d4 xdUU 5/2
f (U)|∂U a3 |2 −
3
L
U
.
ω2
|a3 |2
f (U)
(6.39)
L/R
Also, we obtain a single equation of motion,
C(U)∂U2 a3 + B(U)∂U a3 + D(U)a3 (U) = 0,
for
1
C(U) = f (U)U 5/2 1 + F˜U2 0 ,
2
1
U 5/2 f (U) 1 + F˜U2 0
2
B(U) = ∂U
D(U) = U 5/2
L
U
3
ω2
f (U)
,
1
1 + F˜U2 0 .
2
(6.40)
The near-boundary solution then takes the form
(1)
a3 (U)|U →∞ =
(0)
a3
(0)
(2)
(1)
a
b
a
b
+ 3 + 33/2 + 3 2 + 35/2 . . . ,
U
U
U
U
136
(6.41)
(n)
(n)
(0)
(0)
where all higher-order coefficients a3 and b3
(0)
(0)
depend on a3 and b3 , respectively.
The two independent coefficients a3 and b3 will be determined by the incomingwave boundary conditions near the horizon as we numerically solve the equations of
motion in (6.40).
Before proceeding to the evaluation of (6.40), we should handle the UV divergence
for the D8/D8 actions on the boundary at U0 → ∞. After removing the divergence
by subtracting proper counterterms, the renormalized actions become
(2)
SD8/D8
ren
= C(2πls2 )2
d4 x
3 (0)∗ (0)
−1/2
a3 b3 + O(U0 )
2
,
(6.42)
L/R
which give rise to the L/R currents
(j3 )L/R =
3
3C
(0)
(2πls2 )2 b3 |L/R = 2C(2πls2 )2 lim U 2 (U 2 ∂U2 a3 + 2U∂U a3 )
U →∞
2
L/R
.(6.43)
The similar treatment to the divergence at the boundary can be found in [171].
Now, to solve (6.40) numerically, we have to impose the incoming-wave boundary
conditions at the horizon by setting
a(U)L/R =
1−
UT
U
ˆ
−i ω
4
aT (U)L/R
(6.44)
for ω
ˆ = ω/(πT ). One can show that ∂U aT (U)|U →Uh = a′T (Uh ) linearly depends on
aT (Uh ) by expanding the equation of motion with the expression in (6.44) near the
horizon, while the value of aT (Uh ) will not affect the computation of conductivities.
The values of aT (Uh ) and a′T (Uh ) from the expression in (6.44) then provide the
proper boundary conditions for the equation of motion. By using the AdS/CFT
137
ΣL R
0.038
0.036
0.034
0.032
0.030
0.028
ΜL R
0.026
0
1
2
3
4
T
Figure 6.3: The DC conductivities in the L/R bases versus the chemical potentials
scaled by temperature.
prescription, the spectral densities from (6.43) are
3C
χL/R (ω) = Im (2πls2 )2
2
(0)
b3
(0)
a3
3
=
2C(2πls2 )2 UT2 Im
lim
ˆ →∞
U
L/R
3
Uˆ 2
ˆ ˆ a3
Uˆ 2 ∂U2ˆ a3 + 2U∂
U
a3
,
(6.45)
L/R
3/2
where Uˆ = U/UT and 8Cπ 2 ls4 UT = 8Nc λT 3 /(81MKK ). The zero-frequency limit of
the spectral functions contribute to the DC conductivities as
χ(ω)L/R
.
ω→0
ω
σL/R = lim
(6.46)
Since the equations of motion and the currents for left handed and right handed
sectors take the same form, we only have to compute one of them. By solving
the equations of motion in (6.40) and employing the relation in (6.46), we obtain
the DC conductivities in the L/R bases as shown in Fig.6.3, where the increase of
chemical potentials leads to mild enhancement for the conductivities. Here we define
a dimensionless quantity
σ
ˆi = 81σi /(8Nc λT ),
138
(6.47)
where i = R/L, V, 5 and we will hereafter use this convention in the paper. Next,
by converting the conductivities in the L/R bases into the V /a bases through (6.5),
we derive both the normal conductivity σV and the axial one σ5 . Whereas the
overall amplitudes of a3(L/R) do not affect the conductivity, we will choose proper
amplitudes such that E3L = E3R = E3 is the net electric field on the boundary.
As shown in Fig.6.4, where we fix the vector chemical potential and vary the axial
one, the normal conductivity and axial conductivity are slightly enhanced by the
axial chemical potential. Similarly, as shown in Fig.6.5, both the normal and axial
conductivities also temperately increase as we fix the axial chemical potential and
increase the vector one.
In Fig.6.8, we plot the ratios to the axial conductivity and the product of the axial
and vector chemical potentials. As shown in Fig.6.8 with the fixed vector chemical
potentials, we find that the axial conductivity is approximately linear to µA for
small chemical potentials. One may further conclude that σ5 ∝ µV µA provided all
curves in Fig.6.8 coincide. As we gradually reduce µV , the ratios will converge to
a single value, where the small deviations may come from higher-order corrections
in powers of µV µA /T 2 along with the errors stemming from the background-field
expansions when µV /A become larger. The ratios in Fig.6.8 as well correspond to the
results by exchanging the values of µV and of µA , where the reason will be explained
later. Thus, from Fig.6.8, we conclude that the axial conductivity is approximately
proportional to the product of µV and µA for small chemical potentials as pointed
out in [124]. Since only the F˜U2 0 terms are involved in the computations above, the
L/R conductivities are independent of the signs of L/R chemical potentials. We may
observe interesting symmetries for both σV and σ5 . Under the transformations (µR →
µR , µL → −µL ) and (µR → −µR , µL → µL ), which correspond to the exchanges
(µV → µA , µA → µV ) and (µV → −µA , µA → −µV ) respectively, both σV and
σ5 remain unchanged; they are as well invariant under the transformation (µR →
139
−µR , µL → −µL ) corresponding to (µV → −µV , µA → −µA ). As proposed in [124],
the leading-log order correction of the normal conductivity due to small chemical
potentials is proportional to µ2V + µ2A and the axial conductivity is proportional to
µV µA , which preserve the symmetries above. In Fig.6.6 and Fig.6.7, we also show
the agreement of the power-counting estimations in (6.9) and the numerical results
with small chemical potentials.
We can further evaluate the AC conductivities for ω = 0 as the responses to a
frequency-dependent electric field. The real part and imaginary part of the L/R
conductivities should be obtained from
Re[ˆ
σL/R (ω)] = T
2
−1
MKK
Im
Im[ˆ
σL/R (ω)] = −T
2
lim
ˆ
U→∞
−1
MKK
Re
lim
ˆ →∞
U
3
Uˆ 2
ˆ ˆ a3
Uˆ 2 ∂U2ˆ a3 + 2U∂
U
3
Uˆ 2
ωa3
ˆ ˆ a3
Uˆ 2 ∂U2ˆ a3 + 2U∂
U
ωa3
,
L/R
.
(6.48)
L/R
Their combinations then give rise to the normal and axial AC conductivities. In
Fig.6.9, we illustrate the real part of the normal AC conductivity with different
chemical potentials. It turns out that the corrections from small chemical potentials
are almost negligible. Our primary interest will be the axial AC conductivity as
shown in Fig.6.10 and Fig.6.11, where different values of the axial chemical potentials
give rise to distinct amplitudes in oscillations. We find that the Re(σ5 ) will be
negative in some frequencies. This does not break the second law of thermodynamics
as shown in Appendix C.1.
6.5 Arbitrary Chemical Potentials
For large chemical potentials, the expansion of background fields becomes invalid.
We thus have to solve the full DBI action. By considering only the time component
of the background gauge fields, the D8/D8 actions in Poincare coordinates take the
140
ΣV ,Σ5
0.030
ΣV ,Σ5
0.030
0.025
0.025
0.020
0.020
0.015
0.015
0.010
0.010
0.005
0.005
ΜA
0.0
0.2
0.4
0.6
0.8
ΜV
1.0 T
0.5
Figure 6.4: The blue and red(dashed)
curves correspond to the normal DC
conductivity and the axial one with
µV = T , respectively.
Σ
ΜA
Σ
Σ
0.7
0.8
1.0 T
0.9
Figure 6.5: The blue and red(dashed)
curves correspond to the normal DC
conductivity and the axial one with
µA = 0.5T , respectively.
A
Μ
0.6
ΜA
V
1.0
1.0
0.8
0.8
0.6
0.6
0.4
0.4
0.2
0.2
A
Μ
Σ
V
ΜV
0.2
0.4
0.6
0.8
1.0
ΜA
0.02
T
Figure 6.6: Power-counting estimation in (6.9) with µA = 0.01T .
0.04
0.06
0.08
0.10
0.12
0.14
T
Figure 6.7: Power-counting estimation in (6.9) with µV = 0.2T .
form
SD8/D8 = −CL9/4
d4 xdUU 5/2
1 − (2πls2 )2 (FL/R )20U ,
(6.49)
where the solutions read
(FR/L )0U =
αR/L
2
U 5 + (2πls2 )2 αR/L
141
(6.50)
Re ΣV
Σ5
2.0
ΜV Μ A
0.0020
1.5
0.0015
1.0
0.0010
0.5
Ω
0.0005
ΜA
0.05
0.10
0.15
0.20
5
10
15
20 T
Figure
6.9:
The red(solid),
blue(dashed),
and
green(dotted)
curves correspond to the real part
of the normal AC conductivity with
µA = 0.2T , 0.5T , and 0.9T , respectively. Here µV = T .
0.30T
0.25
Figure 6.8: The red, blue(dashed),
and black(dot-dashed) curves correspond to the cases with µV = T , 0.6T ,
and 0, 3T . Here µ
ˆV /A = µV /A /T .
with integration constants αR/L . In the absence of a vector chemical potential, we
have αR = −αL . By requiring regularity at the horizon, we obtain
U
αR/L
dU ′
(AR/L )0 (U) =
2
UT
(6.51)
2
(U ′ )5 + (2πls2 )2 αR/L
which result in the chemical potentials on the boundary
µR/L = (AR/L )0 (U = ∞) =
αR/L
3
2
2 F1
3UT
2 2 2
3 1 13 (2πls ) αR/L
, , ,−
10 2 10
UT5
.
(6.52)
The result is the same as that found in EF coordinates[185].
Next, we should introduce the electric perturbation. By considering only the
fluctuation a3 (U, x0 ), the computation is considerably simplified. Following the same
setup in section III, one can show that the quadratic terms in the probe-brane actions
in Poincare coordinates now become
(2)
SD8/D8 = −C(2πls2 )2
d4 xdUU 5/2
2
1 − F˜0U
f (U)|∂U a3 |2 −
142
L
U
3
ω2
|a3 |2
f (U)
. (6.53)
Re Σ5
Im Σ5
0.006
0.004
0.004
0.002
Ω
0.002
Ω
5
10
5
20 T
15
10
15
20 T
0.002
0.002
0.004
0.004
0.006
0.006
Figure 6.10:
The red(solid),
blue(dashed), and green(dotted) curves
correspond to the real part of the axial
AC conductivity with µA = 0.2T ,
0.5T , and 0.9T , respectively. Here
µV = T .
Figure 6.11:
The red(solid),
blue(dashed),
and
green(dotted)
curves correspond to the imaginary
part of the axial AC conductivity
with µA = 0.2T , 0.5T , and 0.9T ,
respectively. Here µV = T .
The equation of motion is given by
Cf (U)∂U2 a3 + Bf (U)∂U a3 + Df (U)a3 (U) = 0,
2
Cf (U) = f (U)U 5/2 1 − F˜0U
Bf (U) = ∂U
Df (U) = U
5/2
−1/2
2
U 5/2 f (U) 1 − F˜0U
L
U
3
for
,
−1/2
ω2
2
1 − F˜0U
f (U)
,
−1/2
,
(6.54)
where the near-boundary solution takes the same form as (6.41). From (6.50), we
find that (FR/L )0U → U −5/2 for U → ∞, which do not contribute to the on-shell
2 −1/2
2
actions on the boundary. In fact, since (1 − F˜0U
)
→ 1 + F˜0U
/2 on the boundary,
the boundary action in (6.53) will be exactly the same as that in (6.39). We can then
follow the same procedure to carry out the holographic renormalization and evaluate
the conductivities, where the results are shown in Fig.6.12-Fig.6.18.
As shown in Fig.6.12, the result derived from solving the full DBI action and from
the background-field expansion deviate when the chemical potentials are increased.
143
ΣL R
0.045
0.040
0.035
0.030
ΜL R
0
1
2
3
4
T
Figure 6.12: The DC conductivities in the L/R bases versus the chemical potentials
scaled by temperature. The dashed red curve and solid blue curve correspond to the
result from the background-field expansion and from solving the full DBI action,
respectively.
Although we derive a critical chemical potential (µc )L/R ≈ 4.51T in (6.31), the
comparison of numerical results in Fig.6.12 may suggest that the background-field
expansion is approximately valid for µL/R < T . In Fig.6.13 and Fig.6.14, we present
the DC normal and axial conductivities with a fixed vector chemical potential and
with a fixed axial chemical potential, respectively. Compared to Fig.6.4 and Fig.6.5,
the increase of conductivities with respect to the increase of chemical potentials
become more pronounced for large chemical potentials.
Surprisingly, as shown in Fig.6.15, the relation σ
ˆ5 ∝ µV µA still holds even for
the cases with large chemical potentials, where the expected higher-order corrections
only result in negligible contributions. By comparing Fig.6.15 with Fig.6.8, we also
find a small correction for the case with µ = T . In Fig.6.16-Fig.6.18, we further
illustrate the AC conductivities. As shown in Fig.6.16, the mild oscillatory behavior
appears as we turn up the chemical potentials. From Fig.6.17 and Fig.6.18, we find
that the increase of chemical potentials not only increases the amplitudes but also
leads to phase shifts.
144
ΣV ,Σ5
0.07
ΣV ,Σ5
0.07
0.06
0.06
0.05
0.05
0.04
0.04
0.03
0.03
0.02
0.02
0.01
ΜA
0
1
2
3
ΜV
4 T
3.0
Figure 6.13:
The blue and
red(dashed) curves correspond to
the normal DC conductivity and the
axial one with µV = 4T , respectively.
3.5
4.0
4.5
5.0 T
Figure 6.14:
The blue and
red(dashed) curves correspond to
the normal DC conductivity and the
axial one with µA = 3T , respectively.
6.6 Discussions
In this chapter, we have shown that the CESE exists in the presence of both vector
and axial chemical potentials for arbitrary magnitudes. In the framework of the SS
model characterizing a strongly coupled chiral plasma, we have evaluated both the
normal and axial DC conductivities induced by an electric field. Both conductivities
are enhanced by the increase of chemical potentials. In addition, we have found that
the axial conductivity is approximately proportional to the product of the vector
and axial chemical potentials for arbitrary magnitudes. We have computed the
AC conductivities led by a frequency-dependent electric field as well. The axial
conductivity oscillates with respect to the frequency of the electric field, where the
amplitude is increased and the phase is shifted when the chemical potentials are
increased.
The observation in section 6.3 that the cross terms of the background gauge fields
and fluctuating gauge fields result in an axial current from the equation of motion in
the bulk may imply that CESE is due to the medium effect in a thermal background.
In this paper, we only consider the case for µV > µA > 0, which corresponds to the
145
Re ΣV
Σ5
2.0
ΜV Μ A
1.5
0.0020
1.0
0.0015
0.5
0.0010
Ω
5
0.0005
ΜA
0.2
0.4
0.6
0.8
10
15
20 T
Figure 6.16:
The Green(solid),
red(long-dashed),
and black(dotdashed) curves correspond to the real
part of the normal AC conductivity
with (µV , µA ) = (4T, 3T ), (4T, T )
and (T, 0.9T ).
The blue(dashed)
curve corresponds to the one with
(µV , µA )
=
(T, 0.9T ) from the
background-field expansions.
1.0 T
Figure 6.15: The red, blue(dashed),
black(dot-dashed), and green(longdashed) curves correspond to the cases
with µV = 10T , 8T , 4T , and T . Here
µ
ˆV /A = µV /A /T .
system with more positive charged fermions than negative charged fermions and with
more right handed fermions than left handed fermions. The axial current is generated
parallel to the electric field, which is manifested by a positive axial conductivity. As
discussed in the end of section 6.4, all results remain unchanged for the cases with
µA > µV > 0 or with µV < 0 and µA < 0 based on the symmetries under the
transformations between µV and µA . Our approach can be easily applied to the
cases for µV > 0 > µA or µV < 0 < µA . The most significant change is that the
axial conductivities will become negative in such cases, which suggests that the axial
currents will be engendered anti-parallel to the electric fields as mentioned in [124].
Given that µV µA < 0 corresponding to µ2L > µ2R along with the monotonic increase
of σR/L by turning up µR/L , we directly obtain σ5 < 0 by definitions in the cases
with µV > 0 > µA or µV < 0 < µA . Notice that the normal conductivities will be
always positive in all the cases since σR/L > 0 for arbitrary values of the chemical
potentials. The entropy principle for CESE is further discussed in the appendix.
146
Re Σ5
Im Σ5
0.06
0.06
0.04
0.04
0.02
Ω
0.02
Ω
5
10
15
5
10
15
20 T
0.02
20 T
0.02
0.04
0.04
0.06
Figure 6.17: The real part of the
axial AC conductivity with the colors corresponding to the same cases as
Fig.6.16.
Figure 6.18: The imaginary part of
the axial AC conductivity with the colors corresponding to the same cases as
Fig.6.16.
Moreover, the most intriguing finding in our work is the relation σ5 ∝ µV µA
for arbitrary chemical potentials. From the weakly coupled approach in [124], it is
natural to anticipate such a relation as the leading-log order contribution for small
chemical potentials. Nevertheless, with large chemical potentials, one may expect the
relation would breakdown due to the higher-order corrections of µV /T and µA /T .
It turns out that the influence from the higher-order corrections are negligible in
the strongly coupled scenario at least in the setup of SS model. Since the axial
conductivity here can only be computed numerically, it is difficult to find the origin
of the suppression of the higher-order corrections. It would be thus interesting to
study CESE in different holographic models such as the D3/D7 system, where the
axial chemical potential is incorporated via rotating flavor branes as discussed in
[190], to explore the universality of this relation. On the other hand, we may as well
conjecture that there exists nontrivial resummation which leads to the cancellation
of higher-order corrections in the weakly coupled computations in QED(or QCD)
for the axial conductivity. Also, the coupling dependence of the axial conductivity
in the strongly coupled scenario is distinct from that derived in the weakly coupled
approaches. In our model, we find σ5 ∝ gY2 M Nc2 from (6.28), while it is found in [124]
147
that σ5 ∝ 1/(e3 ln(1/e)) in thermal QED.
From the phenomenological perspective as proposed in [124], the CESE along
with CME can be possibly observed through the charge azimuthal asymmetry in
heavy ion collisions. Whereas the chemical potential is small compared to the temperature in high-energy collisions[197], the CESE may be suppressed in such a case.
However, since CESE could exist for arbitrary chemical potentials as shown in our
model, the RHIC beam energy scan with lower collision energy[198], which can produce the plasma with the chemical potential comparable to the temperature, could
be promising to measure such an effect. Although the chemical potentials can be
drastically increased in the low-energy collisions, the collision energy can not be to
low such that QGP in the deconfined phase is not formed after the collisions. Furthermore, due to the rapid depletion of the electric field with respect to time in heavy
ion collisions[123], the CESE should be more robust in the pre-equilibrium phase. It
is thus desirable to investigate CESE in the out-of-equilibrium conditions.
148
7
Conclusions and Outlook
In this dissertation, we have addressed many important issues in heavy ion collisions
through different models in the AdS/CFT correspondence. For jet quenching, we
found that the thermalization of the medium is more influential for the probes with
lower energy. On the other hand, despite the model dependence, our results for
jet quenching and thermalization with nonzero chemical potentials could shed some
light on the upcoming RHIC beam energy scan. In particular, the small thermalization times with larger chemical potentials found in our study may be tested by
the hydrodynamical simulations for low-energy collisions. For pressure anisotropy,
we found the competing effects on the critical mass between the magnetic field and
pressure anisotropy close to the transition point, which is rather intriguing in theory.
For the thermal-photon v2 enhanced by a magnetic field, our study was unable to
confirm that the strong magnetic field is the dominant source for large elliptic flow of
direct photons, while it has shown that the magnetic field can lead to sizable results
in ideal conditions in the strongly coupled scenario. For CESE, it is striking that the
axial conductivity for CESE approximately proportional to the product of the vector chemical potential and the axial chemical potential for arbitrary magnitudes of
149
chemical potentials. Further studies of CESE in distinct holographic models will be
thus worthwhile. To conclude this dissertation, we will discuss the future directions
especially focused on the electromagnetic-field induced effects in strongly coupled
gauge theories.
We may continue our study in CESE in Chapter 6. In order to further analyze the universality of the relation between the axial conductivity and chemical
potentials, we will evaluate the axial conductivity in different holographic models.
Although we mention that the D3/D7 system could be an intuitive choice, chiral
symmetry is not manifest in the D3/D7 embeddings. Recently, the D3 − D7 − D7
embeddings in the AdS5 × T 1,1 background have been developed by Kuperstein and
Sonnenschein(KS)[199]. The KS model also possesses a chiral symmetry characterized by the D7 and D7 branes, which provides an alternative choice for investigating
anomalous effects in chiral systems via holography. In the framework of the KS
model, we can introduce different chemical potentials in the right-handed and lefthanded sectors on the D7 and D7 branes and evaluate the axial conductivity in
CESE by following the same approach in SS model. Furthermore, by considering
the leading-order backreacted metric as reported in [200], we can compute the corrections to the transport coefficients in terms of the λNf /Nc expansion with λ being
the t’Hooft coupling, which allows us to study CESE beyond the quenched approximation. On the other hand, since the 5-dimensional background geometry in KS
model is asymptotic AdS5 . We may apply the MT geometry to KS model to further
investigate the anisotropic effect upon CESE.
In addition, similar to CMW mentioned in Section 1.4, an electric field may induce
an chiral electric wave (CEW) from the density fluctuations in a chiral plasma[124].
We will thus continue the study in Chapter 6 to further explore CEW. We will invoke
both the SS model and KS model to evaluate the dispersion relation of CEW and
extract the wave velocity and diffusion constant by following the similar approach
150
for CMW[110]. In the previous studies of CMW, only small chemical potentials are
considered. Such a setup may characterize the energetic collisions in RHIC and LHC,
which result in small chemical potentials as mentioned in Chapter 1. However, we
will investigate CMW and CEW with a large vector chemical potential based on the
enhancement of CESE led by the increase of the vector chemical potential, which is
imperative for the collisions with lower energy in the RHIC beam energy scan[197,
198]. In particular, we anticipate that the density fluctuations will be more prominent
near the critical point of the chiral phase transition in the QCD phase diagram.
Therefore, the inclusion of a large vector chemical potential is essential to further
probe the QCD phase diagram with anomalous effects. In this case, we have to firstly
reformulate the wave equations and subsequently analyze the dispersion relation in
holography. To be more pragmatic in comparison with asymmetric collisions in
experiments, we have to consider the presence of both electric and magnetic fields,
where the interplay between CMW and CEW should result in nontrivial physics.
As briefly referred in Section 5.1, the presence of a strong magnetic field may
favor the chiral symmetry breaking and the formation of fermionic condensates.
The competing effects on the critical mass between the magnetic field and pressure
anisotropy close to the transition point may imply that the anisotropy disfavors
the chiral symmetry breaking as opposed to the magnetic field. To confirm our
speculation, it is desirable to calculate the quark condensate near the transition
point between the confined and deconfined phases, for which we have to study the
Minkowski embedding in the MT background. Moreover, we may also include a
finite chemical potential in such a model. We can then study the phase diagram
with respect to the temperature, chemical potential, magnetic field, and anisotropy
in a strongly interacting gauge theory. On the other hand, since the chiral symmetry
breaking is not manifest in the D3/D7 systems, we should also analyze the magnetic
catalysis in the KS model with the MT background. Alternatively, we can consider
151
the anisotropy induced by the presence of a magnetic field in an originally isotropic
background. Practically, one should study the backreaction from the magnetic field
coupling to the flavor branes in the KS model by making a λNf /Nc expansion. Such
a computation will be sophisticated. However, it is indispensable for understanding
the influence from a magnetic field and the induced anisotropy in the unquenched
limit.
Although the studies in static conditions could bring about profound results, it
is desirable to generalize the studied to time-dependent conditions more analogous
to heavy ion experiments. We may investigate CME and CESE in the SS and KS
models in the presence of time-dependent electromagnetic fields in the quenched
approximation. Given that the time-dependent backreactions to the background
geometries are neglected, the conventional AdS/CFT prescriptions for the computations of transport coefficients in static conditions may not be applied. A new
formalism for the computations of time-dependent correlation functions to tackle
the problems is needed. Tentatively, we may take the Wigner transform to replace
Fourier transform when evaluating the time-dependent correlation functions.
Similarly, we may investigate the anomalous transport in the AdS-Vaidya type
geometry to mimic the non-equilibrium phase in heavy ion collisions. We may implement the AdS-Vaidya metric as the background geometry and incorporate the
gauge fluctuations contributing to the chemical potentials. Such a setup corresponds
to the case with small chemical potentials. For finite chemical potentials, we could
utilize the AdS-RN-Vaidya geometry by assigning the time-dependent charge to a
finite axial chemical potential emerging from a thermalizing medium. Nonetheless,
to involve both the vector and axial chemical potentials, the AdS-RN-Vaidya geometry has to be modified to include two charges. The studies involving time-dependent
electromagnetic fields or non-equilibrium geometries not only provide us significant
information in heavy-ion phenomenology, but also introduce potential recipes for
152
analyzing quantum quench and other problems related to the non-equilibrium and
strongly interacting systems in condensed matter and cold atom physics.
153
Appendix A
Appendices for Chapter 3
A.1 Perturbative Expansions of the Dilaton Field
In [63], it is showed that the AdS-vaidya metric is the leading-order solution in the
expansion of a weak dilaton field as a non-normalizable excitation with respect to
time. At late times, the higher-order terms in the weak-field expansion may dominate
and thus undermine the perturbation. However, the dilaton field on the boundary is
time-varying only within a period which is approximately equivalent to the thickness
of the falling shell on the boundary in AdS-Vaidya spacetime. At late times, the
dual geometry should be governed by AdS-Schwarzschild metric; the dilaton field on
the boundary vanishes, while it diffuses near the future horizon, which corresponds
to the quasi-normal mode led by the scattering between the dilaton field and the
backreaction of the spacetime metric. If the time period for the time-varying dilaton
filed on the boundary were short, the perturbative expansion would be the exact
solution within that time period. The non-vanishing higher-order terms near the
future horizon should match the quasi-normal mode outside that time period. In the
following, we will show that the quasi-normal mode would be negligible by choosing a
154
Gaussian profile of the dilaton field on the boundary with the appropriate amplitude
and width.
Recall the expansion of the dilaton field and the mass function in [63],
φ(r, v) = φ0 (v) +
m(v) =
where φ3 =
1
4r 3
v
−∞
1
2
∂v φ0 φ3
+ 3 +O
r
r
1
r4
for r = z −1 ,
(A.1)
v
3
dt (∂t2 φ0 )2 + (∂t φ0 )4 − 3(∂t φ0 )φ3 ,
4
−∞
(A.2)
dt (−(∂t φ0 )m(t) + (∂t φ0 )2 ∂t2 φ0 ) is at O(ǫ3 ) for ǫ denoting the
field amplitude on the boundary. Then we take φ0 (v) = ǫe−v
2 /v 2
0
for v0 = 0.1 and
ǫ = 0.02306, which leads to m(v → ∞) = M ≈ 1. Since the future horizon rh =
M 1/3 ≈ 1, this choice satisfies the required condition for AdS-Vaidya metric that
rδt ≫ ǫ at large r by approximating δt ∼ v0 , where δt denotes the time period for
the time-varying dilaton field on the boundary. The mass functions up to the leading
order O(ǫ2 ) and to the next leading order O(ǫ4 ) are illustrated in Fig.A.1, whereas
two functions almost coincide due to the O(ǫ2 ) suppression of the correction from
the next leading order. The mass function may degenerate to a step function at the
thin-shell limit when v0 → 0. Here the two turning points appearing in Fig.A.1 come
from the second derivatives of the dilaton field with the Gaussian profile encoded in
the leading-order contribution of the mass function.
Subsequently, we will match the perturbative solution and the quasi-normal mode
at v = δt/2, where the dilaton field on the boundary is time-varying within −δt/2 <
v < δt/2. As showed in Fig.A.2, the O(ǫ3 ) terms may dominate φ(v, r) as v ∼ δt.
Although the dilaton field with the Gaussian profile should decay to zero at v → ∞,
the perturbation would breakdown at large v > δt/2 and the dilaton field has to
match the quasi-normal mode in the AdS-Schwarzchild spacetime. Here we take
δt/2 = 3v0 . It is showed in [63] that the quasi-normal mode φq (r, (v − δt/2)) as the
solution of the dilaton equation in the AdS-Schwarzschild spacetime is determined
155
by the initial condition φq (r, 0) = φ3 (r, 0)/r 3 and the boundary condition φq (∞, v −
δt/2) = 0. Since the maximum amplitude of the lowest quasi-normal mode is small
compared with the leading order terms of φ( r, v) for −3v0 < v < 3v0 , the broadening
of the dilaton field by the higher order perturbation and the quasi-normal mode
may be ignored. In [63], this quasi-normal mode is interpreted as the resummed
perturbation at the third order.
Φ r rh ,v
0.2
mv
1.0
0.8
0.1
0.6
0.3
0.4
0.2
0.1
0.1
0.2
0.3
v
0.1
0.2
0.3
0.2
0.1
0.1
0.2
0.3
v
Figure A.2: The red curve and blue
curve illustrate the φ(z = 0.99, v) up
to O(ǫ) and O(ǫ3 ), respectively. When
v ≈ 3v0 , the contribution from the
higher order terms starts to increase,
while its amplitude is rather small as v
is still within (−3v0 , 3v0 ).
Figure A.1: The comparison between the leading-order mass function
to O(ǫ2 ) and the next leading-order one
to O(ǫ4 ) in terms of v. Two results coincide and cannot be distinguished in
the figure.
A.2 Quasi-Static Approximation and the Thin-Shell Limit
In this subsection, we will discuss about the validity of the quasi-static approximation
and the thin-shell limit by investigating the mass shell generated by the dilaton field
with the Gaussian profile in AdS4 background. By taking φ0 (v) = ǫe−v
2 /v 2
0
, the
leading-order mass function is given by
1
m(v) =
2
2
v
−∞
dt(∂t2 φ0 (t))2
ke−k
M
= M √ (1 − 2k 2 ) + (1 + erf (k)),
2
3 π
156
(A.3)
where k =
√
2v
,
v0
M=
√
3 2π 2
ǫ,
4v03
and erf (k) is the error function. By applying the quasi-
static approximation, the redshift factor can be computed from the integral of (3.8)
along with the linear approximation in (A.5) at d = 3, while we will not restrict
the computation in the thin-shell limit. Since the mass function in (A.3) now is
more complex than the hyperbolic tangent-like function in the Section.II, we have
to solve the integral in (3.8) numerically. The positions of the center of the shells
with different setups obtained from the numerical solutions of the redshift factors
are shown in Fig.A.3. These setups have different ǫ and v0 but all lead to M = 1.
On the other hand, we can numerically solve v(t, z) by using (3.7),
∂
∂z
∂v(t, z)
∂t
=
=
∂f (v, z)
∂v
z
1
f (v, z)2
−z 3
(1 − m(v)z 3 )2
∂m(v)
∂v
∂v(t, z)
∂t
∂v(t, z)
∂t
,
(A.4)
with the following boundary and initial conditions, v(t, 0) = t and v(0, z) = −z.
Given that the thickness of the shell is not too large, the initial condition v(0, z)
should be approximately valid since the spacetime in the early time is governed by
the pure AdS metric. The mass function m(v) as a function of t and z from this full
numerical computation is shown in Fig.A.5. Compared to Fig.A.3, the falling shells
obtained from the quasi-static approximation and from the numerical solution match
qualitatively. To have a closer comparison, we may track the centers of the shells
from the numerical solutions, which are as well illustrated in Fig.A.3 in comparison
with the result from the quasi-static approximation. It turns out that the quasi-static
approximation with the linear approximation qualitatively describes the scenario of
the falling shell even beyond the thin-shell limit.
In addition, the qualitative behavior of the falling shell is independent of the
spacetime dimensions. In the early time, the shell with distinct thickness all fall
with the speed of light. Since the spacetime is still analogous to the pure vacuum,
157
the profiles of the shell or the distributions of the injected energy will be irrelevant.
While in the later time, the shell with larger thickness falls faster. At the late stage of
the thermalization, the shell with larger thickness covers larger range of the virtuality
scale, which may facilitate the thermalization process. The small deviations based
on the different thickness of the shells can be observed in Fig.A.4. We see that the
deviation between the quasi-static approximation and the full numerical computation
only emerges in late times.
z
1.0
z
1.00
0.95
0.90
0.85
0.80
0.75
0.70
0.65
t
0.7 0.8 0.9 1.0 1.1 1.2 1.3
0.8
0.6
0.4
0.2
0.0
0.0
0.2
0.4
0.6
0.8
1.0
1.2
t
Figure A.3: The solid red, orange,
and blue curves represent the position
of the center of the shell using the
linear approximation for (v0 , ǫ)=(0.1,
0.02306), (0.2, 0.06523), and (0.4,
0.18451), respectively.
The dashed
curves are the result of numerically
computing v(t, z).
Figure A.4: Same plot as in Fig.A.3,
but zooming onto late time evolution.
In Appendix A.1, we discuss the broadening of the dilaton field along the v direction based on the scattering between the dilaton field and the backreaction of the
spacetime metric, whereas the amplitude of the broadening is negligible. Along the
z direction, the upper portion of the shell may receive stronger gravitational force
and thus falls faster than the lower portion of the shell. The scenario should be more
manifest when the shell approaches the future horizon. Therefore, we may expect
the compression of the shell near the future horizon. As illustrated in Fig.A.6, where
158
mv
1.0
0.8
0.6
0.4
0.2
0.2
0.4
0.6
0.8
1.0
1.2
1.4
z
Figure A.6: The red and blue curves
represent the leading order mass function to O(ǫ2 ) for v0 = 0.1 and ǫ =
0.02306 at z0 = 0.99 and z0 = 0.3, respectively.
Figure A.5: The full numerical computation for m(v) at v0 = 0.1 and
ǫ = 0.02306.
we evaluate the mass function in terms of z from the solution of v(t(z0 ), z) by solving
(A.4) numerically, the upper portion of the shell shrinks when approaching the future
horizon and the profile of the shell becomes asymmetric. Since the thickness of the
shell along the z direction may be compressed and the broadening along the v direction can be discarded, we conclude that the thin-shell limit should be appropriate in
the framework of the AdS-Vaidya spacetime.
A.3 The Redshift Factor and Thermalization times
In this appendix, we will introduce further approximations to compute the redshift
factor and thermalization time of the medium. To solve the integral in (3.9), we have
to write v(t, z) in terms of z at fixed t(z0 ). In principle, we can employ the numerical
solution of v(t, z) from (A.4), while we may make further approximations to obtain
an analytical solution without losing the generality. Given that the integrand in (3.9)
is non-vanishing only in the vicinity of z0 when the thickness of the shell is small, we
159
g z z0
1.0
z0
1.0
0.8
0.8
0.6
0.6
0.4
0.4
0.2
0.2
0.2
0.4
0.6
0.8
1.0
z0
0.5
Figure A.7: The red curve represents
the redshift factor c(z0 ) as a function
of the position of the shell, while the
blue curve represents F (z0 ), where the
future horizon is at zh = 1.
1.0
1.5
2.0
t
Figure A.8: The blue and red curves
represent the positions of the shell obtained from (3.18) and (A.8), respectively. Here the blue dashed line denotes the future horizon at zh = 1.
may approximate it by a linear function,
v(t(z0 ), z) ≈
z − z0
∂v(t(z0 ), z)
(z − z0 ) = −
,
∂z
1 − Mz04 /2
(A.5)
to solve for g(t(z0 ), zp ). Now the integral in the exponent of (3.8) can be simplified
as
ap
log g(t(z0 ), zp ) =
da
−∞
where a =
z−z0
.
v0 (1−M z04 /2)
−(2 − Mz04 )sech2 a
Mz04
tanh a +
2−M z04
M z04
2,
(A.6)
When v0 is small, a → +(−)∞ for zp being inside(outside)
the shell and a = 0 for z = z0 . Since we take the integration from the boundary to
the bulk, the lower bound of the integral should be at a → −∞. Solving the integral
in (A.6) analytically, we obtain the redshift factor,
1
M z4
exp − 2(1−M0z 4 )
0
g(z0 , zp ) =
M z 4 (1− M z 4 )
c(z0 ) = exp − 01−M z24 0
(
0)
160
if v > 0(zp < z0 ),
if v = 0(zp = z0 ),
if v < 0(zp > z0 ).
(A.7)
The redshift factor inside the shell c(z0 ) only depends on the position of the shell.
As shown in Fig.A.7, the redshift effect pronounces only when the shell is away the
boundary. It also deviates from F (z0 ) in the region close to the horizon. Now, by
combining (3.5) and (A.7), we can track the position of the shell,
t0 =
M zs4
2(1−M zs4 )
exp
z0
dzs
0
1−
M 4
z
2 s
,
(A.8)
which is illustrated in Fig.A.8 for M = zh−4 = 1. Compared to the trajectory obtained
from (3.18), the position of the shell shown in (A.8) falls much slower.
From the redshift factor in (A.7), we can compute the falling velocities of the
different portions of the shell even though the thickness of the shell is small. We find
vt (z0 ) = F (z0 ) = 1 −
vc (z0 ) =
1−
z04
2zh4
z04
,
zh4
exp −
vb (z0 ) = c(z0 ) = exp −
z04 /zh4
,
2(1 − z04 /zh4 )
z04 /zh4 1 −
z04
2zh4
(1 − z04 /zh4 )
,
(A.9)
where vt , vc , and vb represent the falling velocities of the top, center, and the bottom
of the shell, respectively. When the shell is away from the horizon, vt (z0 ) ≈ vc (z0 ) ≈
vb (z0 ) up to the order of z04 /zh4 , which implies the thickness of the shell remains
unchanged. When the shell approaches the horizon, the expansion of z04 /zh4 becomes
invalid and vc (z0 )
vb (z0 ) < vt (z0 ), where vb (z0 ) < vt (z0 ) suggests the compression
of the shell as discussed in Appendix A.2. Counter-intuitively, vc (z0 )
vb (z0 ) may
suggest that the bottom of the shell will be pulled back by the center of the shell when
approaching the horizon. This effect comes from an error of the linear approximation
around the center of the shell in our computation. In fact, the linear approximation
161
breakdowns when the shell is deformed when approaching the horizon as shown in
the later paragraph by considering the next leading order correction.
Given that the center and the bottom of the shell fall much slower than the top
of the shell, we may define the thermalization time at tth = t0 |z0 =0.98zh . We find
tth T =0.49, 1.52, and 1.36 for solving t0 from the top, the center, and the bottom
of the shell, respectively. Recall that 0.15 ≤ tth T ≤ 1.52 for the QGP generated in
RHIC, the thermalization time of the center of the shell roughly matches the upper
bound. However, to fix the counter-intuitive result that vc (z0 )
vb (z0 ), we have to
compute the falling velocities to the next leading order; we will find that the bottom
of the shell falls slower than the center of the shell as expected.
Before proceeding to the next leading order computation, we may recall that we
not only make the linear approximation of v(t(z0 ), z) in the integral of (A.6) but
also approximate z as z0 to obtain the analytic result. To verify that this further
approximation does not affect the falling velocities qualitatively, we should carry
out the integral in (3.9) numerically by only substituting the v(t(z0 ), z) with the
expression in (A.5). Now, we have to define the upper bound zp in the integral to
characterize the top and the bottom of the shell. We may define |z − z0 | = 3v0
as the edges of the shell based on m(v = 3v0 ) ≈ M and z − z0 ≈ −v at the
leading order expansion. In other words, by taking the numerical integral with
respect to z from 0 to zp = z0 + 3v0 , we can obtain the redshift factor c(z0 ) in the
quasi-AdS spacetime and compute the falling velocity of the bottom of the shell.
In this condition, we find the falling velocities, vt (z0 ) = 1 − z04 = 0.078, vc (z0 ) =
(1−z04 /2)g(z0, zp = z0 ) = 0.0019, and vb (z0 ) = g(z0 , zp = z0 +3v0 ) = 0.0022 by taking
M = 1 and z0 = 0.98. By using (A.9), we obtain vt (z0 ) = 0.078, vc (z0 ) = 0.0014,
and vb (z0 ) = 0.0017 with the same M and z0 . It turns out that vc < vb in both
cases with and without approximating z as z0 in the integrand when computing the
redshift factor, which suggests that the primary error should stem from the linear
162
approximation of v(t(z0 ), z).
To the next leading order, we have
1
v(t(z0 ), z) ≈ ∂z v(t(z0 ), z)|z=z0 (z − z0 ) + ∂z2 v(t(z0 ), z)|z=z0 (z − z0 )2
(A.10)
2
2
4
z − z0
(z − z0 )
dm(v)
z0
= −
−
Mz03 −
|z=z0 ,
4
2
M z04
4
M z0
M
z
dv
1− 2
2 1− 2
1− 20
where we use the chain rule
∂f (v,z)
∂z
t
=
∂f (v,z)
∂z
v
+
∂f (v,z)
∂v
z
∂v(t,z)
∂z
t
for deriving
the second equality. Here the derivative of the mass function
M
dm(v)
=
sech2
dv
2v0
v
v0
=
2m(v)
m(v)
1−
v0
M
is highly localized at z0 ; we may thus substitute
dm(v)
|z=z0
dv
with
(A.11)
M
θ(v0
2v0
− |z − z0 |) in
(A.10), where θ denotes the unit step function. When |z − z0 | ≈ v0 , this term leads
to comparative contribution compared to the leading order term. By computing
the falling velocities with the redshift factor obtained from the numerical integral
of (3.9) up to the next leading order, we find vt (z0 ) = 1 − z04 = 0.078, vc (z0 ) =
(1 − z04 /2)g(z0, zp = z0 ) = 0.020, and vb (z0 ) = g(z0 , zp = z0 + 3v0 ) = 0.017 by taking
M = 1 and z0 = 0.98. Now, we acquire the plausible relation vt > vc > vb , while
the values of vc and vb are much larger than those derived from the leading order
approximation. To extract the accurate falling velocities of different portions of the
shell when approaching the future horizon, it is necessary to compute the redshift
factor up to the higher order. Nevertheless, the velocity of the top of the shell is
not affected by the higher order correction and it may provide an upper limit for the
thermalization time of the medium.
163
A.4 The String Profile in the Quasi-AdS Spacetime
In this appendix, we will analyze more details about the string profile in the quasiAdS spacetime and reproduce the ratio of the energy to momentum of the massless
particle in (3.25) by following the approach in [103]. We require that the initial
trajectory of the particle coincide with the direction of a lightlike signal traveling
down the string worldsheet, where the later leads to the minimum stopping distance
of the falling string. By taking hαβ lα lβ = 0, we obtain the basis of the lightlike
vectors to be
√
lα = (1/ 1 − v˜2 , 1)
or
√
(1, − 1 − v˜2 ) .
(A.12)
By taking the first basis in (A.12), we can form the spacetime vector
lµ = l α
∂Xµ
1
=√
(−1, v˜, 0, 0, 0) ,
α
∂σ
1 − v˜2
(A.13)
which transmits the lightlike signal on the string worldsheet and falls into the future
horizon. Now the 4-momentum of the massless particle should be proportional to
the spacetime direction: qµ ∝ lµ . Thus we can write down the momentum ratio
q˜i
li
= = −˜
v.
q˜0
l0
(A.14)
It turns out that the spacetime vector lµ is independent of z in the quasi-AdS spacetime. By approximating the small pieces of the string as massless particles and
matching their initial momenta with lµ , all pieces of the string will carry the same
initial momentum. Thus the initial trajectories of all pieces of the string should be
parallel. Furthermore, since q˜µ is conserved in the quasi-AdS spacetime, they continually move along the null geodesic and the string thus remains straight, which
supports our argument in the context.
164
A.5 The Dangling String and Wave velocity in the Quasi-AdS Spacetime
In this appendix, we compute the wave velocity by investigating a dangling string
in the quasi-AdS spacetime. We firstly write down the Nambu-Goto action in the
quasi-AdS spacetime. By choosing t˜ and z as the worldsheet coordinates and setting
x1 (t˜, z) we get
−1
S=
2πα′
1
dt˜dz 2
z
1−
dx1
dt˜
2
+
dx1
dz
2
.
(A.15)
As mentioned in the context, the profile of the string in the quasi-AdS spacetime
should remain straight. We thus set
x1 (t˜, z) = v˜t˜ + δx1 (t˜, z) .
(A.16)
After taking the expansion of the Lagrangian in (A.15) with respect to the derivatives
of δx1 , we write down the equation of motion by extremizing the deviation of the
Lagrangian. We find
1 ˜
2
1 ˜
d2 δx1 (t˜, z)
−1 dδx (t, z)
2 −1 d δx (t, z)
−
2z
=
(1
−
v
˜
)
.
dz 2
dz
dt˜2
(A.17)
From the equation above and dt˜ = F (z0 )dt, we derive the wave velocity
vw =
√
1 − v˜2 F (z0 ) .
(A.18)
On the other hand, the velocity of the falling shell in the thin-shell limit can be
derived from (3.18),
v0 =
dz0
= F (z0 ) .
dt
(A.19)
At the collision point, z0 = zc , the wave velocity in the quasi-AdS spacetime is
always smaller than the velocity of the falling shell unless the string is static. Thus
165
the information may not be transmitted to the lower part of the string inside the
shell from the collision point.
A.6 Finding the Stopping Distance in Eddington-Finkelstein Coordinates
It is technically difficult to track the null geodesic of the massless particle beyond
the thin shell limit in Poincare coordinates, since the trajectory of the particle is
continuously deflected by interactions with the shell. However, irrespective of the
details of the interaction, it is easier to compute the stopping distance of the probe
in EF coordinates. Similar computations have been performed in section 3.2. By
using the metric in (3.35) or (3.36) and setting the momentum component of the
massless particle non-zero only along v, z, and x1 directions, we can write down the
geodesic equations in terms of the affine parameter λ,
d2 v
+ Γvvv
dλ2
dv
dλ
2
d2 z
+ Γzvv
dλ2
dv
dλ
2
d2 x1
+ 2Γ1z1
dλ2
dz
dλ
+
Γv11
+
2Γzvz
dx1
dλ
dx1
dλ
dv
dλ
2
=0
dz
dλ
=0.
+
Γz11
dx1
dλ
2
+
Γzzz
dz
dλ
2
=0,
(A.20)
166
For d = 3, the relevant Chiristoffel symbols are given by
Γvvv =
1
z
1
1
1 + m(v)z 3 − Q2 m(v)4/3 z 4 , Γv11 = − ,
2
z
Γzvv =
1
z
1
1
3
1
−1 + m(v)z 3 + m(v)2 z 6 − Q2 m(v)7/3 z 7 + z 8 Q4 m(v)8/3
2
2
4
4
−
1
z
1 4 1 2
z − Q m(v)1/3 z 5
2
3
Γzvz = −
1
z
1
2
1 + m(v)z 3 − Q2 m(v)4/3 z 4 , Γzzz = − ,
2
z
1
z
Γz11 =
dm(v)
,
dv
(A.21)
1
1
1 − m(v)z 3 − Q2 m(v)4/3 z 4 , Γ1z1 = − .
2
z
For d = 4,
Γvvv =
1
z
4
1
1 + m(v)z 4 − Q2 m(v)3/2 z 6 , Γv11 = − ,
3
z
Γzvv =
1
z
2
8
−1 + m(v)2 z 8 + Q2 m(v)3/2 z 6 − 2Q2 m(v)5/2 z 10 + Q4 m(v)3 z 12
3
9
−
Γzvz = −
Γz11 =
1
z
1 5
dm(v)
z − Q2 z 7 m(v)1/2
,
2z
dv
1
z
(A.22)
4
2
1 + m(v)z 4 − Q2 m(v)3/2 z 6 , Γzzz = − ,
3
z
2
1
1 − m(v)z 4 + Q2 m(v)3/2 z 6 , Γ1z1 = − .
3
z
In addition to these, the mass function is defined as
m(v) =
M
2
1 + tanh
v
1
−
v0 2
,
(A.23)
where the shift in the hyperbolic-tangent function is to fit the setup illustrated in
Fig.A.9. In the thin-shell limit, the mass function defined here will degenerate to the
167
1
expression in (3.38). The momentum along the x1 direction q1 = |q| = z −2 dx
from
dλ
ν
is conserved in EF coordinates. Thus, we may rewrite the
the definition qµ = gµν dx
dλ
geodesic equations in terms of the derivative with respect to x1 ,
dxµ dx1
dxµ
=
= z 2 |q|x′µ ,
dλ
dx1 dλ
d2 xµ
= |q|2 z 2 (x′′µ z 2 + 2zz ′ x′µ ) ,
dλ2
(A.24)
where the prime denotes the derivative with respect to x1 . By inserting (A.24) into
the geodesic equations, we find the last equation in (A.20) is automatically satisfied
due to the conservation of momentum along x1 . We then have to introduce proper
initial conditions to solve other two geodesic equations in (A.20). Even though the
energy of the particle is not conserved in the AdS-RN-Vaidya spacetime, initially
the gravitational effect led by the falling shell is negligible. Therefore, we may write
down the initial conditions as a massless particle falling in the pure AdS metric. For
a particle ejected from zI , we have
z|x1 =0 = zI , v|x1 =0 = t|x1 =0 − z|x1 =0 = −zI ,
v ′ |x1 =0 = (t′ − z ′ )|x1 =0 =
z ′ |x1 =0 =
ω0
−
|q|
ω02 − |q|2
,
|q|
ω02 − |q|2
,
|q|
(A.25)
where ω0 and q represent the initial energy and momentum of the massless particle
in Poincare coordinates. The stopping distance obtained in EF coordinates is shown
in Fig.A.10 for d = 4 in the thin-shell limit, where we also make a comparison with
the result illustrated in Fig.3.17 with the same initial conditions. The results match
and cannot be distinguished from the plot. This holds for d = 3 as well. We can
also evaluate the stopping distance with the thick shell in EF coordinates, it turns
out that the deviation from the thin shell is negligible.
168
z
qAdS
xsT
shell
0.5
0.4
0.3
AdS − RN
zI
0.2
0.1
t
t = 0 v0
Figure A.9: The scenario of a massless particle ejecting from the boundary as the shell starts to fall, where v0
denotes the thickness of the shell and
the solid red curves and the dashed red
curve represent the surfaces and the
center of the shell, respectively. Here
the blue dashed line represents the masselss particle ejected from zI .
Χ4
0.2 0.4 0.6 0.8 1.0
Figure A.10: The green points represent the stopping distances in AdSRN-Vaidya spacetime in EF coordinates, which match those derived in
Poincare coordinates as shown by the
blue points. Here the initial conditions
are the same as those in Fig.3.17 and
we take v0 = 0.0001.
A.7 The Dyonic Black Hole
Here we will summarize some properties of the dyonic black hole in d = 3. The
action we consider is the following
S0 =
1
8πGN
1
2
√
1
d4 x −g(R − 2Λ) −
4
d4 xF 2
,
(A.26)
1
gµν F 2 ,
4
(A.27)
=0,
(A.28)
which results in the following eom
1
(R − 2Λ) gµν = g αρ Fρµ Fαν −
2
√
√
∂ρ −gF ρσ = 0 , ∂ρ −g(⋆F )ρσ
Rµν −
where (⋆F ) is the Hodge dual of F . In (3 + 1)-bulk dimensions, the Hodge dual of
the bulk electro-magnetic field is another two form. Thus it is possible for a black
hole to possess both electric and magnetic charges. Such a dyonic black hole is given
169
by
L2
ds = 2
z
2
dz 2
−f dt +
+ dx2
f
2
f (z) = 1 − Mz 3 +
Λ=−
,
3
,
L2
1
Q2e + Q2m z 4 ,
2
2L
F = Qe dz ∧ dt + Qm dx ∧ dy ,
(A.29)
(A.30)
(A.31)
where Qe and Qm denote the electric and the magnetic charges respectively.
In the extremal case, the function f can be written as
f (z) = 1 − 4
z
zH
3
+3
z
zH
4
,
(A.32)
where zH is the location of the event-horizon. It is easy to check that the temperature
is given by
4πT = −
df
dz
=0.
(A.33)
zH
Therefore for the extremal case, we can write
3
zH
=
4
,
M
Q2e + Q2m =
6 1
.
4
L2 zH
(A.34)
We can now find the corresponding Vaidya-type background sourced by appropriate matter field
S = S0 + κSext .
(A.35)
This will give the following equations of motion
Rµν −
1
1
ext
(R − 2Λ) gµν − g αρ Fρµ Fαν + gµν F 2 = (16πGN κ) Tµν
, (A.36)
2
4
∂ρ
√
(A.37)
∂ρ
√
−gF ρσ = (8πGN κ) Jeσ ,
σ
−g(⋆F )ρσ = (8πGN κ) Jm
.
(A.38)
170
Here Je denotes the electric current and Jm denotes the magnetic current. The
dyonic-Vaidya background takes the following form
L2
−f dv 2 − 2dvdz + dx2 ,
z2
ds2 =
f (z, v) = 1 − m(v)z 3 +
1
qe (v)2 + qm (v)2 z 4 ,
2L2
(A.39)
with the following vector fields
Fzv = qe (v) ,
Fxy = qm (v) .
(A.40)
The above background is sourced by the following stress-energy tensor
ext
2κTµν
=
z2
L2
L2
dm
dqe
dqm
− z qe
+ qm
dv
dv
dv
δµv δνv .
(A.41)
The electric and magnetic sources are given by
κJeµ =
dqe µv
δ ,
dv
µ
κJm
=
dqm µv
δ .
dv
(A.42)
The extremal limit is now obtained by considering
zH (v)3 =
4
,
m(v)
qe (v)2 + qm (v)2 =
6
1
.
2
L zH (v)4
(A.43)
Once m(v) is chosen, we can pick the electric and magnetic charge functions according
to the above formula. An obvious such choice is given by
3
qe (v) =
4L2
2
m(v)
√
2
171
4/3
= qm (v)2 .
(A.44)
Appendix B
Appendices for Chapter 4 and Chapter 5
B.1 General Expressions for Field Equations
In this appendix, we demonstrate the derivation of general expressions of field equations in the string frame in gauge invariant forms. From the quadratic term of the
field strength in the DBI action, we have the field equations in the Maxwell form as
shown in (5.8). By taking Fourier transform of the gauge field as shown in (4.20),
the field equations in the gauge of Au = 0 now read
(MGuu Gjj A′j )′ − MGjj (Gtt ω 2 + Gii q 2 )Aj = 0,
(MGuu Gtt A′t )′ − MGtt Gii (q 2 At + qωAi ) = 0,
(MGuu Gtt A′i )′ − MGtt Gii (ω 2 Ai + qωAt ) = 0,
ωGtt A′t − qGii A′i = 0,
where M = e−φ
(B.1)
−detGµν and i denotes the propagating direction and j denotes
the polarization of the gauge field. The first equation here represents the transverse
mode and the rest three contribute to the longitudinal modes. To rewrite the field
172
equations into the gauge invariant form, we define
Ei = qAt + ωAi ,
Ej = ωAj ,
(B.2)
where we set k0 = −ω and ki = q. By using the first equation of (B.1) and (B.2), we
obtain the gauge invariant form for the transverse modes,
Ej′′ + (log(MGuu Gjj ))′ Ej′ −
1
(Gtt ω 2 + Gii q 2 )Ej = 0.
Guu
(B.3)
By combining the rest three equations in (B.1) and (B.2) and doing some algebras,
we then derive the gauge invariant form for the longitudinal modes,
Ei′′
uu
ii
′
+ (log(MG G )) + log
Gtt
Gii
′
Gii q 2
k2
′
E
−
Ei = 0,
i
k2
Guu
(B.4)
where k 2 = Gtt ω 2 + Gii q 2 . Furthermore, by using the last equation in (B.1), we can
also rewrite the near-boundary action into the gauge invariant form as
Sǫ = −2KD7
= −2KD7
d4 k uu
G M Gtt A∗t A′t + Gjj A∗j A′j + Gii A∗i A′i
4
(2π)
d4 k uu
G M
(2π)4
Gii Gtt
Gjj ∗ ′
∗ ′
E
E
+
E E .
q 2 Gii + ω 2 Gtt i i
ω2 j j
(B.5)
Finally, by implementing (4.26), we obtain the photon spectral density
Guu MGjj Ej′ (u, ω)
χǫj (ω) = 8KD7 Im lim
.
u→0
Ej (u, ω)
(B.6)
B.2 Near-Boundary Expansion
To analyze the asymptotic behavior of ψ(u) with black-hole embedding near the
boundary in MT metric, we may consider the situation with small anisotropy since
the leading-order expansion of the MT geometry in terms of a/T can be solved
173
analytically. In this limit for a/T <≪ 1, the leading-order solution of MT geometry
reads [14],
F (u) = 1 −
u4
+ a2 F2 (u) + O(a4 ),
u4h
B(u) = 1 + a2 B2 (u) + O(a4 ),
H(u) = e−φ(u) , φ(u) = a2 φ2 (u) + O(a4 ),
(B.7)
where the coefficients for the anisotropic contributions are given by
F2 (u) =
u2
1
2 2
2
4
4
4
8u
(u
−
u
)
−
10u
log2
+
(3u
+
7u
)log
1
+
h
h
24u2h
u2h
B2 (u) = −
u2h
10u2
u2
+
log
1
+
24 u2h + u2
u2h
φ2 (u) = −
u2h
u2
log 1 + 2
4
uh
,
,
.
(B.8)
We then insert the analytic expression of the background metric above into (4.34)
and solve for ψ(u) near the boundary. We may assume that the asymptotic expansion
of ψ(u) takes form,
ψ(u) = ψ1
u
u3
u5
+ ψ3 3 + ψ5 5 + a2 log
uh
uh
uh
u
uh
ρ3
u3
u5
+
ρ
5 5
u3h
uh
+ ...,
(B.9)
where the logarithmic terms come from anisotropy and have to vanish as a → 0. Up
to the O(a2 ) and O(u6 ) of (4.34), we find
ψ5 =
1
a2
ψ1 (1 + 8ψ1 ψ3 ) + (8ψ13 − 9ψ3 + ψ1 (−2 + log 32)),
8
96
ρ3 =
5
ψ1 ,
24
ρ5 = ψ12 ρ3 ,
(B.10)
where the coefficients of higher-order terms are determined by ψ1 and ψ3 associated
with the quark mass and condensate, respectively. Since the leading-order logarithmic term dominates the O(u3 ) term near the boundary, it is awkward to extract
174
ψ3 in terms of the expansion in the u coordinate when the background geometry is
anisotropic.
175
Appendix C
Appendices for Chapter 6
C.1 Entropy Principle for CESE
As shown in Eq. (6.5), σ5 can be negative if σR < σL . However, as known, the normal
transport coefficients should be always positive definite according to the second law
of thermodynamics. So in the section, we will prove that negative σ5 will also obey
the entropy principle.
Let us start from the relativistic hydrodynamics with chiral fermions. The energymomentum and charge conservation equations read,
∂µ T µν = eF νλ (JR,λ + JL,λ ),
∂µ JRµ = 0,
∂µ JLµ = 0,
(C.1)
where JRµ and JLµ are four vector form of right and left haned currents, F µν is the field
strength tensor. Here we neglect the chiral anomaly in this discussion for simplicity.
Those quantities can be decomposed as,
T µν = (ǫ + P + Π)uµ uν − (P + Π)g µν + π µν ,
176
(C.2)
and
µ
µ
JR/L
= nR/L uµ + νR/L
,
(C.3)
where ǫ, P , nR/L and uµ are the energy density, the pressure, the number density of
right (left) handed fermions and fluid velocity, respectively. g µν is the metric and we
µ
choose it as diag {+, −, −, −}. The dissipative terms Π, π µν and νR/L
denote the bulk
viscous pressure, the shear viscous tensor and the diffusion currents, respectively.
Note that we have chosen the Landau frame where the heat flux current in T µν does
not appear.
For simplicity, we neglect the viscosities in the following discussion and only
concentrate on the diffusion currents. The complete discussion can be found in the
Sec II. of [195]. With the help of Gibbs-Duhem relation dǫ = T ds + µRdnR + µL dnL ,
with s the entropy density, from uν ∂µ T µν + µR∂µ JRµ + µL ∂µ JLµ = uν eF νλ (JR,λ + JL,λ),
we get,
∂µ S µ = −
νiµ ∂µ
i=R,L
µi eEµ
+
,
T
T
(C.4)
where the electric field is defined in a comoving frame, E µ = F µν uν , S µ is the
covariant entropy flow defined as [76, 201],
Sµ =
1
µR µ µL µ
[P uµ + T µν uν − µR JRµ − µL JLµ ] = suµ −
ν −
ν .
T
T R
T L
The second law of thermodynamics requires, ∂µ S µ ≥ 0. It can be satisfied if νVµ have
the following forms,
νiµ =
j=R,L
λij (g µν − uµ uν ) ∂ν
µj eEν
+
,
T
T
(C.5)
and
1
λRR λLL − (λRL + λLR )2 ≥ 0, λRR ≥ 0, λLL ≥ 0,
4
177
(C.6)
where the factor g µν − uµ uν guaranteed uµ νVµ = 0. We find the heat and electric
conductivities form a unique combination and share the same transport coefficient
[195]. If the system has a time reversal symmetry, then we get
λRL = λLR ,
(C.7)
which is called Onsager relation and has been proved in various of approaches, e.g.
from kinetic theory [195].
Now we turn to the vector and axial vector currents, JVµ and Jaµ . Inserting the
constrains (C.6) and Onsager relation (C.7), yields,
σV
= (λRR + λLR + λRL + λLL )T ≥ 0,
σ5 = (λRR + λRL − λLR − λLL )T = (λRR − λLL )T,
(C.8)
where σV as a normal conductivity is found to be positive, but σ5 can be negative.
We find the entropy principle does not constrain σ5 directly and does also not
require a positive definite σ5 . The similar conclusion is also obtained for a fluid with
the multi-flavor case [195].
178
Bibliography
[1] B. Back, M. Baker, M. Ballintijn, D. Barton, B. Becker, et al., Nucl.Phys.
A757, 28 (2005), nucl-ex/0410022.
[2] P. Huovinen, P. Kolb, U. W. Heinz, P. Ruuskanen, and S. Voloshin, Phys.Lett.
B503, 58 (2001), hep-ph/0101136.
[3] K. Ackermann et al. (STAR Collaboration), Phys.Rev.Lett. 86, 402 (2001),
nucl-ex/0009011.
[4] S. Adler et al. (PHENIX Collaboration), Phys.Rev.Lett. 91, 182301 (2003),
nucl-ex/0305013.
[5] J. Adams et al. (STAR Collaboration), Phys.Rev.Lett. 92, 052302 (2004),
nucl-ex/0306007.
[6] U. W. Heinz, pp. 3–12 (2005), nucl-th/0512051.
[7] W. Florkowski, R. Ryblewski, and M. Strickland, Nucl.Phys. A916, 249 (2013),
1304.0665.
[8] D. d’Enterria (2009), 0902.2011.
[9] S. Bass et al., Hot and Dense QCD Matter: Unraveling the Mysteries of the
Strongly Interacting Quark-Gluon-Plasma. A Community White Paper on the
Future of Relativistic Heavy-Ion Physics in the US (2012).
[10] A. Adare et al. (PHENIX Collaboration), Phys.Rev.Lett. 109, 122302 (2012),
1105.4126.
[11] J. Erdmenger, N. Evans, I. Kirsch, and E. Threlfall, Eur.Phys.J. A35, 81
(2008), 0711.4467.
[12] J. Casalderrey-Solana, H. Liu, D. Mateos, K. Rajagopal, and U. A. Wiedemann
(2011), 1101.0618.
[13] D. Mateos and L. Patino, JHEP 0711, 025 (2007), 0709.2168.
[14] D. Mateos and D. Trancanelli, JHEP 1107, 054 (2011), 1106.1637.
179
[15] T. Sakai and S.
hep-th/0412141.
Sugimoto,
Prog.Theor.Phys.
113,
843
(2005),
[16] O. Bergman, J. Erdmenger, and G. Lifschytz, Lect.Notes Phys. 871, 591
(2013), 1207.5953.
[17] D. J. Gross and F. Wilczek, Phys.Rev.Lett. 30, 1343 (1973).
[18] H. D. Politzer, Phys.Rev.Lett. 30, 1346 (1973).
[19] R. Baier, A. H. Mueller, D. Schiff, and D. Son, Phys.Lett. B502, 51 (2001),
hep-ph/0009237.
[20] T. Hirano and K. Tsuda, Phys.Rev. C66, 054905 (2002), nucl-th/0205043.
[21] P. F. Kolb and U. W. Heinz (2003), nucl-th/0305084.
[22] M. Tannenbaum, Rept.Prog.Phys. 69, 2005 (2006), nucl-ex/0603003.
[23] P. M. Chesler and L. G. Yaffe, Phys.Rev.Lett. 102, 211601 (2009), 0812.2053.
[24] P. M. Chesler and L. G. Yaffe, Phys.Rev. D82, 026006 (2010), 0906.4426.
[25] V. Balasubramanian, A. Bernamonti, J. de Boer, N. Copland, B. Craps, et al.,
Phys.Rev.Lett. 106, 191601 (2011), 1012.4753.
[26] V. Balasubramanian, A. Bernamonti, J. de Boer, N. Copland, B. Craps, et al.,
Phys.Rev. D84, 026010 (2011), 1103.2683.
[27] M. P. Heller, R. A. Janik, and P. Witaszczyk, Phys.Rev.Lett. 108, 201602
(2012), 1103.3452.
[28] M. P. Heller, R. A. Janik, and P. Witaszczyk, Phys.Rev. D85, 126002 (2012),
1203.0755.
[29] M. P. Heller, D. Mateos, W. van der Schee, and D. Trancanelli, Phys.Rev.Lett.
108, 191601 (2012), 1202.0981.
[30] P. Kovtun, D. Son, and A. Starinets, Phys.Rev.Lett. 94, 111601 (2005),
hep-th/0405231.
[31] B. Andersson, G. Gustafson, G. Ingelman, and T. Sjostrand, Phys.Rept. 97,
31 (1983).
[32] B. Webber, Nucl.Phys. B238, 492 (1984).
[33] J. C. Collins, Nucl.Phys. B396, 161 (1993), hep-ph/9208213.
180
[34] D. Molnar and S. A. Voloshin,
nucl-th/0302014.
Phys.Rev.Lett. 91,
092301 (2003),
[35] R. Fries, B. Muller, C. Nonaka, and S. Bass, Phys.Rev.Lett. 90, 202303 (2003),
nucl-th/0301087.
[36] R. Fries, B. Muller, C. Nonaka, and S. Bass, Phys.Rev. C68, 044902 (2003),
nucl-th/0306027.
[37] V. Greco, C. Ko, and P. Levai, Phys.Rev.Lett. 90, 202302 (2003),
nucl-th/0301093.
[38] F. Karsch, E. Laermann, and A. Peikert, Phys.Lett. B478, 447 (2000),
hep-lat/0002003.
[39] Y. Aoki, Z. Fodor, S. Katz, and K. Szabo, Phys.Lett. B643, 46 (2006),
hep-lat/0609068.
[40] A. Mocsy and P. Petreczky, Phys.Rev.Lett. 99, 211602 (2007), 0706.2183.
[41] J. M. Maldacena, Adv.Theor.Math.Phys. 2, 231 (1998), hep-th/9711200.
[42] S. Gubser, I. R. Klebanov, and A. M. Polyakov, Phys.Lett. B428, 105 (1998),
hep-th/9802109.
[43] E. Witten, Adv.Theor.Math.Phys. 2, 253 (1998), hep-th/9802150.
[44] E. Witten, Adv.Theor.Math.Phys. 2, 505 (1998), hep-th/9803131.
[45] O. Aharony, S. S. Gubser, J. M. Maldacena, H. Ooguri, and Y. Oz, Phys.Rept.
323, 183 (2000), hep-th/9905111.
[46] G. Policastro, D. Son, and A. Starinets, Phys.Rev.Lett. 87, 081601 (2001),
hep-th/0104066.
[47] A. Buchel and J. T. Liu, Phys.Rev.Lett. 93, 090602 (2004), hep-th/0311175.
[48] D. Mateos, Class.Quant.Grav. 24, S713 (2007), 0709.1523.
[49] L. D. McLerran and R. Venugopalan, Phys.Rev. D49, 3352 (1994),
hep-ph/9311205.
[50] L. D. McLerran and R. Venugopalan, Phys.Rev. D49, 2233 (1994),
hep-ph/9309289.
[51] E. Iancu, A. Leonidov, and L. D. McLerran, Nucl.Phys. A692, 583 (2001),
hep-ph/0011241.
181
[52] E. Ferreiro, E. Iancu, A. Leonidov, and L. McLerran, Nucl.Phys. A703, 489
(2002), hep-ph/0109115.
[53] D. Kharzeev and M. Nardi, Phys.Lett. B507, 121 (2001), nucl-th/0012025.
[54] D. Kharzeev, E. Levin, and M. Nardi, Nucl.Phys. A747, 609 (2005),
hep-ph/0408050.
[55] T. Hirano, U. W. Heinz, D. Kharzeev, R. Lacey, and Y. Nara, Phys.Lett. B636,
299 (2006), nucl-th/0511046.
[56] H.-J. Drescher, A. Dumitru, A. Hayashigaki, and Y. Nara, Phys.Rev. C74,
044905 (2006), nucl-th/0605012.
[57] H.-J. Drescher and Y. Nara, Phys.Rev. C76, 041903 (2007), 0707.0249.
[58] B. Schenke, P. Tribedy, and R. Venugopalan, Phys.Rev.Lett. 108, 252301
(2012), 1202.6646.
[59] D. Grumiller and P. Romatschke, JHEP 0808, 027 (2008), 0803.3226.
[60] S. S. Gubser, S. S. Pufu, and A. Yarom, Phys.Rev. D78, 066014 (2008),
0805.1551.
[61] J. L. Albacete, Y. V. Kovchegov, and A. Taliotis, JHEP 0807, 100 (2008),
0805.2927.
[62] L. Alvarez-Gaume, C. Gomez, A. Sabio Vera, A. Tavanfar, and M. A. VazquezMozo, JHEP 0902, 009 (2009), 0811.3969.
[63] S. Bhattacharyya and S. Minwalla, JHEP 09, 034 (2009), 0904.0464.
[64] S. Lin and E. Shuryak, Phys.Rev. D79, 124015 (2009), 0902.1508.
[65] J. L. Albacete, Y. V. Kovchegov, and A. Taliotis, JHEP 0905, 060 (2009),
0902.3046.
[66] S. S. Gubser, S. S. Pufu, and A. Yarom, JHEP 0911, 050 (2009), 0902.4062.
[67] J. Casalderrey-Solana, M. P. Heller, D. Mateos, and W. van der Schee (2013),
1305.4919.
[68] J. Bjorken, Phys.Rev. D27, 140 (1983).
[69] A. Bialas, M. Bleszynski, and W. Czyz, Nucl.Phys. B111, 461 (1976).
[70] M. L. Miller, K. Reygers, S. J. Sanders, and
Ann.Rev.Nucl.Part.Sci. 57, 205 (2007), nucl-ex/0701025.
182
P.
Steinberg,
[71] D. Kharzeev and E. Levin, Phys.Lett. B523, 79 (2001), nucl-th/0108006.
[72] D. Kharzeev, E. Levin, and M. Nardi, Phys.Rev. C71, 054903 (2005),
hep-ph/0111315.
[73] H.-J. Drescher and Y. Nara, Phys.Rev. C75, 034905 (2007), nucl-th/0611017.
[74] P. Huovinen, Int.J.Mod.Phys. E22, 1330029 (2013), 1311.1849.
[75] K. Aamodt et al. (ALICE Collaboration), Phys.Rev.Lett. 105, 252302 (2010),
1011.3914.
[76] W. Israel and J. Stewart, Annals Phys. 118, 341 (1979).
[77] A. Muronga, Phys.Rev.Lett. 88, 062302 (2002), nucl-th/0104064.
[78] H. Song and U. W. Heinz, Phys.Rev. C77, 064901 (2008), 0712.3715.
[79] M. Luzum and P. Romatschke, Phys.Rev. C78, 034915 (2008), 0804.4015.
[80] P. Bozek and W. Broniowski, Phys.Rev. C85, 044910 (2012), 1203.1810.
[81] P. Romatschke and M. Strickland,
hep-ph/0304092.
Phys.Rev. D68,
036004 (2003),
[82] M. Martinez and M. Strickland, Nucl.Phys. A848, 183 (2010), 1007.0889.
[83] M. Martinez and M. Strickland, Nucl.Phys. A856, 68 (2011), 1011.3056.
[84] M. Martinez, R. Ryblewski, and M. Strickland, Phys.Rev. C85, 064913 (2012),
1204.1473.
[85] R. Ryblewski and W. Florkowski, Phys.Rev. C85, 064901 (2012), 1204.2624.
[86] D. Bazow, U. W. Heinz, and M. Strickland (2013), 1311.6720.
[87] R. Ryblewski, J.Phys. G40, 093101 (2013).
[88] A. Adare et al. (PHENIX Collaboration), Phys.Rev.Lett. 101, 232301 (2008),
0801.4020.
[89] J. Adams et al. (STAR Collaboration), Phys.Rev.Lett. 91, 072304 (2003),
nucl-ex/0306024.
[90] S. Adler et al. (PHENIX Collaboration), Phys.Rev.Lett. 91, 072303 (2003),
nucl-ex/0306021.
[91] M. Gyulassy and
nucl-th/9306003.
X.-n.
Wang,
183
Nucl.Phys.
B420,
583
(1994),
[92] R. Baier, Y. L. Dokshitzer, A. H. Mueller, S. Peigne, and D. Schiff, Nucl.Phys.
B484, 265 (1997), hep-ph/9608322.
[93] B. Zakharov, JETP Lett. 65, 615 (1997), hep-ph/9704255.
[94] U. A. Wiedemann, Nucl.Phys. B588, 303 (2000), hep-ph/0005129.
[95] M. Gyulassy, P. Levai, and I. Vitev, Nucl.Phys. B594, 371 (2001),
nucl-th/0006010.
[96] X.-f. Guo and X.-N. Wang, Phys.Rev.Lett. 85, 3591 (2000), hep-ph/0005044.
[97] H. Liu, K. Rajagopal, and U. A. Wiedemann, Phys.Rev.Lett. 97, 182301
(2006), hep-ph/0605178.
[98] H. Liu, K. Rajagopal, and U. A. Wiedemann, JHEP 0703, 066 (2007),
hep-ph/0612168.
[99] S. S. Gubser, Phys.Rev. D74, 126005 (2006), hep-th/0605182.
[100] C. Herzog, A. Karch, P. Kovtun, C. Kozcaz, and L. Yaffe, JHEP 0607, 013
(2006), hep-th/0605158.
[101] W. Horowitz, Nucl.Phys. A904-905, 186c (2013), 1210.8330.
[102] P. M. Chesler, K. Jensen, A. Karch, and L. G. Yaffe, Phys. Rev. D79, 125015
(2009), 0810.1985.
[103] S. S. Gubser, D. R. Gulotta, S. S. Pufu, and F. D. Rocha, JHEP 10, 052
(2008), 0803.1470.
[104] P. Arnold and D. Vaman, JHEP 10, 099 (2010), 1008.4023.
[105] P. Arnold and D. Vaman, JHEP 1104, 027 (2011), 1101.2689.
[106] B. Betz and M. Gyulassy, Phys.Rev. C86, 024903 (2012), 1201.0281.
[107] J. S. Schwinger, Phys.Rev. 82, 664 (1951).
[108] D. Kharzeev and A. Zhitnitsky, Nucl.Phys. A797, 67 (2007), 0706.1026.
[109] D. E. Kharzeev, L. D. McLerran, and H. J. Warringa, Nucl.Phys. A803, 227
(2008), 0711.0950.
[110] D. E. Kharzeev and H.-U. Yee, Phys.Rev. D83, 085007 (2011), 1012.6026.
[111] D. Son and A. R. Zhitnitsky, Phys.Rev. D70, 074018 (2004), hep-ph/0405216.
[112] K. Fukushima, D. E. Kharzeev, and H. J. Warringa, Phys.Rev. D78, 074033
(2008), 0808.3382.
184
[113] Y. Burnier, D. E. Kharzeev, J. Liao, and H.-U. Yee, Phys.Rev.Lett. 107,
052303 (2011), 1103.1307.
[114] G. Wang (STAR Collaboration), Nucl.Phys.A904-905 2013, 248c (2013),
1210.5498.
[115] H. Ke (STAR Collaboration),
1211.3216.
J.Phys.Conf.Ser. 389,
012035 (2012),
[116] K. Tuchin, Phys.Rev. C83, 017901 (2011), 1008.1604.
[117] K. Tuchin (2012), 1206.0485.
[118] G. Basar, D. Kharzeev, D. Kharzeev, and V. Skokov, Phys.Rev.Lett. 109,
202303 (2012), 1206.1334.
[119] K. Fukushima and K. Mameda, Phys.Rev. D86, 071501 (2012), 1206.3128.
[120] A. Bzdak and V. Skokov, Phys.Rev.Lett. 110, 192301 (2013), 1208.5502.
[121] D. Lohner (ALICE Collaboration) (2012), 1212.3995.
[122] A. Bzdak and V. Skokov, Phys.Lett. B710, 171 (2012), 1111.1949.
[123] Y. Hirono, M. Hongo, and T. Hirano (2012), 1211.1114.
[124] X.-G. Huang and J. Liao, Phys.Rev.Lett. 110, 232302 (2013), 1303.7192.
[125] H.-T. Ding, A. Francis, O. Kaczmarek, F. Karsch, E. Laermann, et al.,
Phys.Rev. D83, 034504 (2011), 1012.4963.
[126] K. Tuchin (2013), 1301.0099.
[127] L. McLerran and V. Skokov (2013), 1305.0774.
[128] E. Caceres, A. Kundu, B. Muller, D. Vaman, and D.-L. Yang (2012),
1208.6368.
[129] E. Caceres, A. Kundu, and D.-L. Yang, JHEP 1403, 073 (2014), 1212.5728.
[130] B. Muller and D.-L. Yang, Phys.Rev. D87, 046004 (2013), 1210.2095.
[131] S.-Y. Wu and D.-L. Yang, JHEP 1308, 032 (2013), 1305.5509.
[132] B. Muller, S.-Y. Wu, and D.-L. Yang, Phys.Rev. D89, 026013 (2014),
1308.6568.
[133] S. Pu, S.-Y. Wu, and D.-L. Yang (2014), 1401.6972.
[134] H. Nastase (2007), 0712.0689.
185
[135] A. V. Ramallo (2013), 1310.4319.
[136] G. T. Horowitz and A. Strominger, Nucl.Phys. B360, 197 (1991).
[137] I. R. Klebanov, Nucl.Phys. B496, 231 (1997), hep-th/9702076.
[138] J. Polchinski, Phys.Rev.Lett. 75, 4724 (1995), hep-th/9510017.
[139] W. Mueck and K.
hep-th/9805145.
Viswanathan,
Phys.Rev.
D58,
106006 (1998),
[140] A. Karch and L. Randall, JHEP 0106, 063 (2001), hep-th/0105132.
[141] A. Karch and E. Katz, JHEP 0206, 043 (2002), hep-th/0205236.
[142] J. Babington, J. Erdmenger, N. J. Evans, Z. Guralnik, and I. Kirsch, Phys.Rev.
D69, 066007 (2004), hep-th/0306018.
[143] D. Mateos, R. C. Myers, and R. M. Thomson, Phys.Rev.Lett. 97, 091601
(2006), hep-th/0605046.
[144] C. Hoyos-Badajoz, K. Landsteiner, and S. Montero, JHEP 0704, 031 (2007),
hep-th/0612169.
[145] D. Mateos, R. C. Myers, and R. M. Thomson, JHEP 0705, 067 (2007),
hep-th/0701132.
[146] E. Caceres and A. Kundu, JHEP 1209, 055 (2012), 1205.2354.
[147] Y. Hatta, E. Iancu, and A. H. Mueller, JHEP 05, 037 (2008), 0803.2481.
[148] S. B. Giddings and A. Nudelman, JHEP 0202, 003 (2002), hep-th/0112099.
[149] F. Dominguez, C. Marquet, A. Mueller, B. Wu, and B.-W. Xiao, Nucl.Phys.
A811, 197 (2008), 0803.3234.
[150] D. Galante and M. Schvellinger, JHEP 1207, 096 (2012), 1205.1548.
[151] E. Caceres and A. Guijosa, JHEP 0612, 068 (2006), hep-th/0606134.
[152] E. Caceres and A. Guijosa, JHEP 0611, 077 (2006), hep-th/0605235.
[153] P. M. Chesler and L. G. Yaffe, Phys.Rev.Lett. 106, 021601 (2011), 1011.3562.
[154] R. A. Janik and P. Witaszczyk, JHEP 0809, 026 (2008), 0806.2141.
[155] D. Mateos and D. Trancanelli, Phys.Rev.Lett. 107, 101601 (2011), 1105.3472.
[156] D. Giataganas, JHEP 1207, 031 (2012), 1202.4436.
186
[157] A. Rebhan and D. Steineder, JHEP 1208, 020 (2012), 1205.4684.
[158] M. Chernicoff, D. Fernandez, D. Mateos, and D. Trancanelli, JHEP 1208, 041
(2012), 1203.0561.
[159] M. Chernicoff, D. Fernandez, D. Mateos, and D. Trancanelli, JHEP 1208, 100
(2012), 1202.3696.
[160] K. B. Fadafan and H. Soltanpanahi (2012), 1206.2271.
[161] M. Chernicoff, D. Fernandez, D. Mateos, and D. Trancanelli (2012),
1208.2672.
[162] L. Patino and D. Trancanelli, JHEP 1302, 154 (2013), 1211.2199.
[163] P. Romatschke and M. Strickland,
hep-ph/0406188.
Phys.Rev. D70,
116006 (2004),
[164] M. Panero, Phys.Rev.Lett. 103, 232001 (2009), 0907.3719.
[165] R. Baier, Nucl.Phys. A715, 209 (2003), hep-ph/0209038.
[166] S. Caron-Huot, P. Kovtun, G. D. Moore, A. Starinets, and L. G. Yaffe, JHEP
0612, 015 (2006), hep-th/0607237.
[167] D. T. Son and A. O. Starinets, JHEP 0209, 042 (2002), hep-th/0205051.
[168] P. K. Kovtun and A. O. Starinets, Phys.Rev. D72, 086009 (2005),
hep-th/0506184.
[169] K. A. Mamo, JHEP 1308, 083 (2013), 1210.7428.
[170] Y.
Bu,
Phys.
Rev.
D
87,
026005
(2013),
http://link.aps.org/doi/10.1103/PhysRevD.87.026005.
URL
[171] H.-U. Yee, Phys.Rev. D88, 026001 (2013), 1303.3571.
[172] T. Albash, V. G. Filev, C. V. Johnson, and A. Kundu, JHEP 0808, 092 (2008),
0709.1554.
[173] K. Tuchin (2013), 1305.5806.
[174] J. Casalderrey-Solana and D. Mateos, Phys.Rev.Lett. 102, 192302 (2009),
0806.4172.
[175] S. Chakraborty and N. Haque, Nucl.Phys. B874, 821 (2013), 1212.2769.
[176] A. Dumitru, Y. Guo, and M. Strickland, Phys.Lett. B662, 37 (2008),
0711.4722.
187
[177] A. Dumitru, Y. Guo, and M. Strickland, Phys.Rev. D79, 114003 (2009),
0903.4703.
[178] M. Strickland and D. Bazow, Nucl.Phys. A879, 25 (2012), 1112.2761.
[179] M. Strickland, Phys.Rev.Lett. 107, 132301 (2011), 1106.2571.
[180] A. Mocsy, P. Petreczky, and M. Strickland, Int.J.Mod.Phys. A28, 1340012
(2013), 1302.2180.
[181] A. Rebhan and D. Steineder, Phys.Rev.Lett. 108, 021601 (2012), 1110.6825.
[182] S. S. Gubser, Phys.Rev. D76, 126003 (2007), hep-th/0611272.
[183] C. Shen, U. W. Heinz, J.-F. Paquet, I. Kozlov, and C. Gale (2013), 1308.2111.
[184] B. Hassanain and M. Schvellinger, Phys.Rev. D85, 086007 (2012), 1110.0526.
[185] H.-U. Yee, JHEP 0911, 085 (2009), 0908.4189.
[186] A. Rebhan, A. Schmitt, and S. A. Stricker, JHEP 1001, 026 (2010), 0909.4782.
[187] A. Gorsky, P. Kopnin, and A. Zayakin, Phys.Rev. D83, 014023 (2011),
1003.2293.
[188] A. Gynther, K. Landsteiner, F. Pena-Benitez, and A. Rebhan, JHEP 1102,
110 (2011), 1005.2587.
[189] T. Kalaydzhyan and I. Kirsch, Phys.Rev.Lett. 106, 211601 (2011), 1102.4334.
[190] C. Hoyos, T. Nishioka, and A. O’Bannon, JHEP 1110, 084 (2011), 1106.4030.
[191] I. Gahramanov, T. Kalaydzhyan, and I. Kirsch, Phys.Rev. D85, 126013 (2012),
1203.4259.
[192] T. Sakai and S.
hep-th/0507073.
Sugimoto,
Prog.Theor.Phys.
114,
1083
(2005),
[193] S. Lin and H.-U. Yee, Phys.Rev. D88, 025030 (2013), 1305.3949.
[194] V. Rubakov (2010), 1005.1888.
[195] J.-W. Chen, Y.-F. Liu, S. Pu, Y.-K. Song, and Q. Wang, Phys.Rev. D88,
085039 (2013), 1308.2945.
[196] K. Peeters, J. Sonnenschein, and M. Zamaklar, Phys.Rev. D74, 106008 (2006),
hep-th/0606195.
[197] A. Andronic, P. Braun-Munzinger, and J. Stachel, Nucl.Phys. A772, 167
(2006), nucl-th/0511071.
188
[198] L. Kumar (STAR Collaboration), Nucl.Phys. A904-905, 256c (2013),
1211.1350.
[199] S. Kuperstein and J. Sonnenschein, JHEP 0809, 012 (2008), 0807.2897.
[200] M. Ihl, A. Kundu, and S. Kundu, JHEP 1212, 070 (2012), 1208.2663.
[201] S. Pu (2011), 1108.5828.
[202] D.-L. Yang and B. Muller, J.Phys. G39, 015007 (2012), 1108.2525.
[203] T. Mehen and D.-L. Yang, Phys.Rev. D85, 014002 (2012), 1111.3884.
189
Biography
Di-Lun Yang was born in Kaohsiung, Taiwan on January 23, 1985. He received his
bachelor degree of science from Department of Physics, National Taiwan University
in June, 2007. In Fall 2009, he entered the Physics Graduate Program at Duke
University. He will get Doctor of Philosophy in May 2014 from Department of
Physics at Duke University. He passed the preliminary exam and became the doctoral
candidate in February 2012. As a graduate student at Duke University, he has written
the articles listed in [202, 203, 128, 129, 130, 131, 132, 133].
190


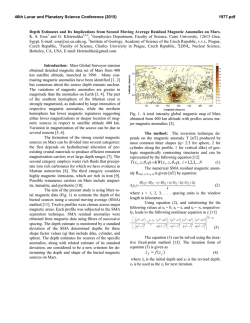
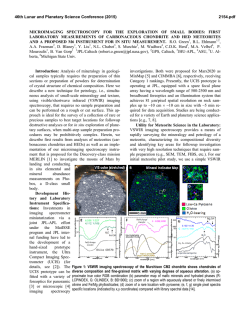
© Copyright 2026