
Daily Market Commentary
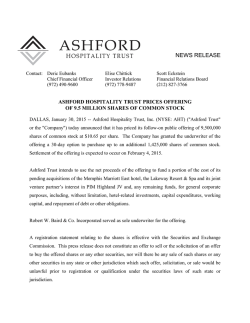
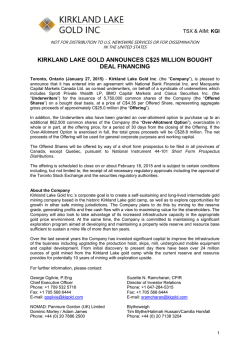
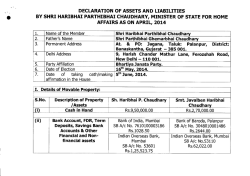
Morning Express
29 January 2015
Focus of the Day
Indices
China Market Strategy
Margin of Danger
Hao HONG, CFA
[email protected]
Strategy
The CSRC announced to further investigate margin trading activities. Shanghai once again
stalled at the significant resistance level of 3,400 that we first identified in our report
“Shanghai Rising: Raising Our Market View to 3,400” (20141205) and “China: 5 Surprises
in 2015” (20141224). With leverage and escalating cash, we should continue to see
heightened volatility and actions from regulators. Futures turnover relative to that of
index is plunging towards its lows and bodes ill for the market, and market leaders such
as financials and property are lagging. Shanghai must convincingly break through 3,400
before it can commence its path to 4,200 as we previously discussed in our report
“Margin Destruction. But is 4,200 possible?” (20150119).
New World Development (17.HK)
Neutral
Securing urban landbank at a low cost
Alfred LAU, CFA
Last Closing: HK$9.17
[email protected]
Upside:+18.9%
LT
BUY
BUY
SELL
Stock
Target Price: HK$10.90→
New World announced its 40% stake acquisition in Kut Cheong Mansion from Chow Tai
Fook for HK$1.78bn. After the transaction, New World will hold 90% in the project, and it
should just be a matter of time to acquire the remaining 10% following the title
unification in 4Q14. We believe this provides a cheap landbanking source to the company,
with an estimated overall land cost as low as HK$6.8k/sqft (GFA), which we project a yield
on cost of over 6%, with EBIT margin easily exceeding 30% upon sale. We believe the
current stock valuation is still attractive at 0.5x P/B, with a 4.6% FY15E-17E yield, and a
53.6% discount to its NAV of HK$19.76. Reiterate Buy on the counter, with a target price
of HK$10.90, based on a 45% target NAV discount.
Close
HSI
24,862
H Shares
11,964
SH A
3,464
SH B
292
SZ A
1,608
SZ B
1,070
DJIA
17,191
S&P 500
2,002
Nasdaq
4,638
FTSE
6,826
CAC
4,611
DAX
10,711
Source: Bloomberg
1d %
0.22
-0.55
-1.41
-0.39
-0.72
-0.38
-1.13
-1.35
-0.93
0.21
-0.29
0.78
Ytd %
5.32
-0.18
2.20
0.54
8.77
4.00
-3.54
-2.76
-2.07
3.96
7.92
9.23
Close
48.47
1,284.80
17.98
5,421.00
117.49
1.51
1.13
3m %
-43.66
6.00
5.18
-19.45
-7.32
-5.41
-10.64
Ytd %
-15.45
8.43
14.48
-13.95
1.95
-2.77
-6.70
bps change
HIBOR
0.38
US 10 yield
1.72
Source: Bloomberg
3m
0.01
-0.60
6m
0.01
-0.74
Indicators
Brent
Gold
Silver
Copper
JPY
GBP
EURO
HSI Technical
HSI
50 d MA
200 d MA
14 d RSI
Short Sell (HK$m)
Source: Bloomberg
24,862
23,755
23,622
65
7,459
BOCOM Int'l Corporate Access
4 Feb
5 Feb
5 Feb
Download our reports from Bloomberg: BOCM〈enter〉
China National Household Paper
Industry Association
Jingdong (JD.US)
Shengmu Organic Milk Distributor
(1432.HK)
Morning Express
29 January 2015
Hang Seng Index (1 year)
26,000
25,000
Link REIT (823.HK)
24,000
A pricy ticket to a greenfield project
Alfred LAU, CFA
Last Closing: HK$53.20
23,000
22,000
[email protected]
Upside: N/A
Not Rated
Target Price: N/A
21,000
The Link REIT and Nan Fung formed a 60:40 JV and won the Kwun Tong commercial site
for of HK$5.86bn, which also marks Link REIT’s first development project and the first
office project. Net gearing would remain low at 13.4%/16%, before/after fully incurring
the construction cost. While we believe there would be ~2% DPS enhancement upon
project completion, thanks to the low funding cost, we believe the REIT could have better
investment opportunities, instcluding acquiring completed projects or redeveloping
existing malls, rather than chasing high land prices. The REIT is currently yielding at
3.4%-4.0% FY15E-17E, based on Bloomberg consensus. We have no rating on the stock at
the moment.
Renewable Sector
HS China Enterprise Index (1 year)
13,000
12,000
11,000
10,000
9,000
8,000
Source: Company data, Bloomberg
Highlights: Germany announces 2014 renewable energy development
data; China’s 2015 PV grid-connection plan disclosed; PV prices
continued to fall this week
Louis SUN
Source: Company data, Bloomberg
[email protected]
UP
MP
OP
Shanghai A-shares (1 year)
4,000
3,500
3,000
1) PV, wind, biofuel and hydropower generation accounted for 9.9%, 6.3%, 10.3%
and 3.5% of total power generation, and 20.1%, 21.5%, 4.6% and 3.2% of total
installed capacity, respectively, in Germany in 2014. Compared with Germany,
China’s new energy installations remain low. In 2014, wind power, PV and
biofuel accounted for 7%, 1.9% and almost 0% of total installed capacity in China,
respectively. This, however, suggests that the potential of new energy
development is notable in China.
1) According to media reports, the National Energy Administration (NEA) plans to
add 15GW PV capacity in 2015 nationwide, comprising 8GW capacity for
centralized power plants and 7GW capacity for distributed PV (not less than
3.15GW for roof distributed PV). China’s PV capacity reached 10.3GW in 2014,
far behind the 14GW target set in the beginning of the year, mainly due to the
obstacles of the development of distributed PV projects. Given the improvement
in the policy environment, we expect the distributed PV sector to achieve
explosive growth in 2015. We believe that the key difficulty of target
achievement will remain with the roof distributed PV sector.
2) PV product prices declined further this week. PV product prices have been falling
since Dec 2014 due to the weaker-than-expected market demand in China, but
the magnitude of fall was limited. The prices of polysilicon raw
materials/polysilicon
wafers/solar
cells/
battery
modules
were
-0.21%/-0.35%/-0.32%/-0.16% this week. The product prices were
-7.1%/-1.8%/-3.1%/-1.6% since last Dec. PV product prices may slip slightly
further ahead.
Download our reports from Bloomberg: BOCM〈enter〉
2,500
2,000
Source: Company data, Bloomberg
Shenzhen A-shares (1 year)
1,800
1,700
1,600
1,500
1,400
1,300
1,200
1,100
1,000
900
800
Source: Company data, Bloomberg
29 January 2015
China Market Strategy
Hao Hong, CFA
Margin of Danger
[email protected]
“When disillusion falls upon an overoptimistic and overbought market, it should fall with sudden and even catastrophic force.” –
John M. Keynes
Summary: The CSRC announced to further investigate margin trading activities. Shanghai once again stalled at the significant
resistance level of 3,400 that we first deliberated in our report “Shanghai Rising: Raising Our Market View to 3,400” (20141205)
and “China: 5 Surprises in 2015” (20141224). With rising leverage, we should continue to see heightened volatility and actions
from regulators. Futures turnover relative to that of index is plunging towards its lows in history and heralds market headwinds,
and market leaders such as financials and property are starting to lag. The fact that the CSRC had found irregularities in China’s
big three brokers, as well as the market’s vulnerability towards the news, suggests that risks have risen and warrant regulators’
attention. Shanghai must break through 3,400 convincingly before it can eventually commence its path to 4,200, as we discussed
in our previous report “Margin Destruction. But is 4,200 possible?” (20150119).
CSRC continues its investigation into non-compliant margin trading: After market close on Wednesday, news broke that the
CSRC will continue to investigate the remaining 46 brokers for any potential non-compliant margin trading activities. The A50
futures traded in Singapore immediately started to plunge, and, at its depth, fell more than 5%, till the CSRC issued a statement
through Xinhua that it would be an ongoing and routine investigation. The news also mentioned that funds provided by banks
were strictly forbidden to enter the market. Eventually, the A50 futures recovered some of its loss but still ended down almost
2%. Once again, Shanghai stalled at 3,400 – a level that we previously deliberated as a significant resistance level in our report
“Shanghai Rising: Raising Our Market View to 3,400” (20141205) and “China: 5 Surprises in 2015” (20141224).
We should expect heighted volatility and ongoing regulation due to rising leverage. Many find solace in the CSRC’s timely
clarification. We are, however, more reserved than consensus. Let us recount some of the known facts and infer from there
regulators’ likely reaction, as well as the market’s potential path. We know that: 1) non-compliant margin trading has been
aggressive, and umbrella trusts and other instruments have been created to provide unchecked liquidity to margin trading. The
fact that the CSRC found irregularities in China’s big three brokers, as well as the market’s susceptibility towards even the news
about the investigations, suggests that risks have accumulated to a level drawing regulators’ attention.
Figure 1: Sectors with large index weight have more leverage.
Margin Trading
MCap Weight
Turnover/Total
Turnover
Manufacturing
3.3%
15.0%
37.5%
Financials
3.2%
24.1%
25.4%
IT
5.5%
16.9%
3.7%
Mining
1.3%
21.1%
11.4%
Property
3.1%
18.6%
4.4%
Contrustrion
4.2%
21.3%
3.1%
Retail and Wholesale
3.9%
16.7%
3.3%
Power
3.2%
18.8%
3.3%
Transportation
2.0%
14.8%
4.0%
Culture
5.0%
21.8%
0.9%
Conglomerate
6.4%
18.3%
0.5%
Commerical Services
3.7%
18.0%
0.8%
Agriculture
3.8%
14.4%
0.7%
Utilities
3.1%
14.3%
0.6%
Research
2.9%
7.0%
0.2%
Healthcare
1.5%
7.0%
0.1%
Education
2.6%
16.2%
0.0%
Average
3.5%
16.7%
100.0%
Source: Bloomberg, Bank of Communications (Int’l)
Industry
Margin
Balance/Mkt Cap
Download our reports from Bloomberg: BOCM〈enter〉
29 January 2015
Last Closing: HK$9.17
Upside:+18.9%
Target Price: HK$10.90→
HK Property Sector
New World Development (17.HK)
UP
Securing urban landbank at a low cost
MP
OP
Financial Highlights
FY13
FY14
FY15E
FY16E
FY17E
Revenue (HK$ m)
46,780
YoY growth (%)
31.3
Core profit (HK$ m)
6,327
Core EPS (HK$)
1.02
EPS growth (%)
9.6
Vs. Consensus (+/- %)
P/E (x)
9.0
DPS (HK$)
0.420
Dividend yield (%)
4.6
Source: Company, BOCOM Int’l estimates
Y/E 30 Jun
56,501
20.8
6,507
0.92
(10.1)
43,943
(22.2)
5,833
0.67
(26.6)
-17.8
13.6
0.420
4.6
52,213
18.8
6,215
0.72
6.6
-19.6
12.8
0.420
4.6
58,563
12.2
6,388
0.74
2.8
-11.0
12.4
0.420
4.6
10.0
0.420
4.6
LT
BUY
Neutral
BUY
SELL
Stock
We believe the acquisition provides
a cheap landbanking source to the
company in securing urban sites.
New World announced its 40% stake acquisition in Kut Cheong Mansion (吉祥大廈) from
Chow Tai Fook for HK$1.78bn. The project has a total GFA of 487,500sqft, based on a 15x
plot ratio for an office/retail development. The transaction price implies an AV of
Stock valuation remains attractive
at 0.5x P/B, with a 4.6% FY15E-17E
yield and 53.6% NAV discount
HK$9.1k/sqft (GFA). After the transaction, New World will hold 90% in the project, whereas
other owners hold the remaining 10%. The title unification of the project was completed in
Reiterate Buy.
4Q14; therefore, this should just be a matter of time for New World to acquire the
remaining 10% at a pre-fixed price of about HK$6.2k/sqft (GFA). Judging from the original
book value of the project, we estimate the overall land cost to still be low at HK$6.8k/sqft
(GFA), which we project a yield on cost of over 6%, with EBIT margin easily exceeding 30%
upon sale. While assembling old building redevelopment is time-consuming, we believe this
provides a cheap landbanking source to the company. We believe the current stock
valuation is still attractive at 0.5x P/B, with a 4.6% FY15E-17E yield, and 53.6% discount to its
NAV of HK$19.76. Reiterate Buy on the counter, with a target price of HK$10.90, based on a
45% target NAV discount, in line with its 5-year average.
Figure 1: Kut Cheong Mansion redevelopment
Project
Address
Site area (sqft)
Plot rati (x)
GFA (sqft)
Original book cost (HK$m, Jun 2014)
Est. original book AV (HK$/sqft)
Acquisition cost of the remaining 40%/10% stake (HK$/sqft, GFA)
Est. overall land cost after the acquisitions (HK$/sqft, GFA)
Est. rent / price (HK$/sqft)
Est. yield on cost / EBIT margin (%)
Source: BOCOM Int'l estimates
Download our reports from Bloomberg: BOCM〈enter〉
Kut Cheong Mansion
704 King’s Road, North Point
32,500
15.0
487,500
2,423.8
HK$5.0k/sqft
HK$9,1/sqft / HK$6.2k/sqft
HK$6.8k/sqft
HK$50 / HK$15,000
6% / 30%
Stock data
52w High (HK$)
10.48
52w Low (HK$)
7.15
Market cap (HK$m)
81,553
Issued shares (m)
8,893
Avg daily vol (m)
17.28
1-mth change (%)
3.9
YTD change (%)
2.8
50d MA (HK$)
9.08
200d MA (HK$)
9.15
14-day RSI
55.66
Source: Company data, Bloomberg
1 Year Performance chart
HSI
20%
17.HK
10%
0%
-10%
-20%
-30%
Jan-14
Apr-14
Jul-14
Oct-14
Jan-15
Source: Company data, Bloomberg
Alfred Lau, CFA, FRM
[email protected]
Tel: (852) 2977 9235
29 January 2015
Last Closing: HK$53.20
Upside: N/A.
Target Price: N/A
HK Property Sector
The Link REIT (823.HK)
Not Rated
A pricy ticket to a greenfield project
Financial Highlights
FY13
FY14
FY15E
FY16E
FY17E
Revenue (HK$ m)
6,506
YoY growth (%)
9.7
Core profit (HK$ m)
3,349
Core EPS (HK$)
1.465
EPS growth (%)
13.1
Vs. Consensus (+/- %)
P/E (x)
36.3
DPS (HK$)
1.465
Dividend yield (%)
2.75
Source: Company, Bloomberg consensus
Y/E 30 Mar
7,155
10.0
3,830
1.657
13.2
7,719
7.9
4,356
1.826
10.2
n.a.
29.1
1.811
3.40
8,281
7.3
4,558
1.999
9.5
n.a.
26.6
1.966
3.70
8,924
7.8
4,960
2.153
7.7
n.a.
24.7
2.149
4.04
32.1
1.657
3.11
The Link REIT and Nan Fung formed a 60:40 JV and won the commercial site for of
HK$5.86bn, or an AV of HK$6.63k/sqft (GFA), ~20% higher than street estimates. The project
has a total GFA of 884,000 sqft and will consist of a retail podium, two office towers and a
car parking area. Estimated total investment is ~HK$10.5bn (attributable HK$6.3bn,
HK$11.9k/sqft GFA), with the targeted completion before June 2020. Nan Fung and Link REIT
would be in charge of the construction and management, respectively. The Link will
capitalize the project's interest expense, so it will not affect DPS during the construction. The
total investment will only account for 4.9% of Link REIT’s gross asset value, and September
2014 pro-forma net gearing would only increase to 13.4%/16%, before/after fully incurring
the construction cost, which is still the lowest among HK REITs, and well below the 45% cap.
This marks Link REIT’s first development project and the first office project, and we believe it
would be a DPS enhancement of ~2% if the REIT can secure a cheap funding cost at 3%, in
line with the existing loan portfolio. However, we wonder if it would be difficult to justify
such a high price. The land price is already 9% higher than valuation by CBRE (appointed by
The Link itself). The all-in-cost of HK$11.9k/sqft already exceeded the ~HK$10k/sqft achieved
in Wheelock's One Bay East sold last year. We concur with the flexibility of the design &
building specifications, and the cost should still justify the completion value. However, we
believe it is difficult to justify financially participating in the development process, with a
minimal development profit, especially when it should have plenty of investment
opportunities elsewhere with possibly better return, including acquiring completed projects
and redeveloping some of their existing malls, in our view. The management attributes the
aggressive bid to their positive office rental outlook. In order to justify a 4.5%-5% gross yield
on cost, which we estimate would require a target office rent of up to HK$45-50/sqft, versus
HK$35/sqft achieved by nearby Grade A offices at the moment. Link REIT is currently yielding
at 3.4%-4.0% FY15E-17E, based on Bloomberg consensus. We have no rating on the stock at
the moment.
Download our reports from Bloomberg: BOCM〈enter〉
The Link REIT entered into a
greenfield development and office
project for the first time.
The management expects no impact
to DPS during the construction, as
interest expenses will be capitalized.
Stock data
52w High (HK$)
53.30
52w Low (HK$)
34.5
Market cap (HK$m)
121,922
Issued shares (m)
2,292
Avg daily vol (m)
4.14
1-mth change (%)
9.69
YTD change (%)
9.58
50d MA (HK$)
49.56
200d MA (HK$)
44.66
14-day RSI
70.94
Source: Company data, Bloomberg
1 Year Performance chart
60%
50%
40%
30%
20%
10%
0%
-10%
Jan-14
HSI
Apr-14
823.HK
Jul-14
Oct-14
Jan-15
Source: Company data, Bloomberg
Alfred Lau, CFA, FRM
[email protected]
Tel: (852) 2977 9235
Morning Express
29 January 2015
Market Review
Hong Kong stocks closed higher on Wednesday, ahead of the Fed meeting, as investors
speculated the Fed will not raise interest rates until the second half of the year. The Hang
Seng Index gained 54.53 points, or 0.22%, to close at 24,861.81. CR Power (836.HK) was
the top blue-chip gainer, with a jump of 6.54%. Developers rallied. SHKP (16.HK) rose
1.3%. Hang Lung (101.HK) gained 3.4%. Wharf (4.HK) added 1.5%. Mainland banks fell.
CMB (3968.HK) dropped 1.6% and MSB (1988.HK) lost 1.3%. However, CCB (939.HK) rose
1%. CITIC Securities (6030.HK) rose 2% as 2014 net profit surged 115%. Haitong Securities
(6837.HK) edged up 0.8%. TCM (570.HK), which will buy 81.5% interest in Jiangyin
Tianjiang Pharma, soared 10.7% after trading resumed.
US stocks fell sharply on Wednesday. The S&P 500 dropped 27.39 points, or 1.4%, to
2,002.23. The DJIA fell 195.84 points, or 1.1%, to 17,191.37. European stock markets
edged up. The Stoxx Europe 600 rose 0.1% to close at 369.08.
News Reaction
SOE reform plan to be introduced before CNY in form of “1+N” pattern. Peng Jianguo,
deputy director of SASAC research centre, said the state-owned enterprise (SOE) reform
plan will be presented in the form of “1+N” pattern, i.e. one general guiding opinion on
deepening the SOE reform and 30-40 supplementary documents on SOE reform. SASAC
will strive to introduce the reform plan before the Spring Festival.
RMB overtakes CAD as world’s top five payment currencies, SWIFT says. According to
the statistics from the Society for Worldwide Interbank Financial Telecommunication
(SWIFT), RMB broke into the top five most-used payment currencies in Dec 2014,
reaching a record high share of 2.17% in global payments by value. Global RMB payments
increased by 20.3% in value in Dec 2014 compared to a year earlier, while the growth for
payments across all currencies was 14.9% for the same period. Canadian dollar (CAD)
ranked 6th and Australian dollar (AUD) ranked 7th.
CBRC to introduce regulatory rules on Internet finance in 2015. According to media
reports, CBRC vice chairman Wang Zhaoxing said a series of regulatory rules governing
Internet finance will be introduced in 2015. CBRC will regulate on third-party payments,
P2P and Internet finance companies engaging in sales in the online platforms.
China plans to add 15GW PV capacities in 2015. According to media reports, the
National Energy Administration (NEA) issued the Consultation Draft on 2015 National
Additional PV Capacity Plan. The NEA intends to add 15GW PV capacities nationwide in
2015, comprising 8GW capacities for centralized power plants and 7GW capacities for
distributed PV (including roof distributed PV of not less than 3.15GW).
Yahoo plans tax-free spinoff of Alibaba stake. Yahoo announced its plan to spin off its
15% stake in Alibaba. The spin-off will be tax-free. This marked the first step of the
widely-expected spin-off of Yahoo’s stake in Alibaba. The valuation amounted to about
US$40bn.
Download our reports from Bloomberg: BOCM〈enter〉
Morning Express
29 January 2015
Economic releases for this week - USA
Date Time
27-Jan
27-Jan
27-Jan
28-Jan
29-Jan
Source: Bloomberg
Event
Durable goods order
New Home sales (k)
Consumer Confidence
MBA mortgage applications
Initial jobless claims (k)
Economic releases for this week - China
Survey
0.5%
450.0
95.0
-
Prior
-0.9%
438.0
92.6
14.2%
307.0
Date Time
Event
Survey
Prior
Source: Bloomberg
BOCOM Research Latest Reports
Data
28 Jan 201 5
28 Jan 201 5
27 Jan 201 5
27 Jan 2015
27 Jan 2015
26 Jan 2015
23 Jan 2015
23 Jan 2015
23 Jan 2015
23 Jan 2015
23 Jan 2015
22 Jan 2015
22 Jan 2015
21 Jan 2015
21 Jan 2015
20 Jan 2015
20 Jan 2015
19 Jan 2015
19 Jan 2015
19 Jan 2015
16 Jan 2015
Report
Energy Sector - Bocom Energy Weekly
Kerry Logistics Network (636 HK) - Robust outlook expected for 2015
Kingsoft (3888.HK) - Raise Kingsoft Cloud valuation; lift TP and upgrade to Buy
Container Shipping Sector - Weekly container shipping commentary
Hang Lung Properties (101.HK) - Well-positioned against challenges
Property Sector - HK/China Property Weekly 20150123
Transportation Sector - Weekly transportation news wrap
Daphne (210.HK) - Another year of profit warning; de-rating imminent
Austar Lifesciences Limited (6118.HK) - Revisiting our forecasts
Sinotrans Limited (598.HK) - Robust fundamentals unchanged in 2015
GOME (493.HK) - China's leading consumer appliances retailer with strong O2O growth; Initiate with Buy
Tencent (700.HK) - Moments feed ads indicate the commercialization of Weixin
Vipshop (VIPS.US) - High growth story but largely priced in; initiate with Neutral
Orient Overseas International Limited (316 HK) – Company Update – Cautiously positive on lower bunker
prices
Energy Sector – Bocom Energy Weekly
Container Shipping Sector - Weekly container shipping commentary
Energy Sector - Lower oil erodes benefit of higher Special Upstream Levy threshold; New crude oil price
forecast spells caution and leads to downgrade
China South City Holdings Limited (1668.HK) - Slowdown in property sales, but new businesses still on track
Property Sector - HK/China Property Weekly 20150116
China Market Strategy – Margin Destruction. But Is 4,200 possible?
Insurance Sector - Don't miss the insurance bull market in 2015
Source: Company data, BOCOM International
Download our reports from Bloomberg: BOCM〈enter〉
Analyst
Fei Wu, Tony Liu
Geoffrey Cheng, CFA
Ma Yuan (Martina), Ph.D, Gu Xinyu (Connie), CPA
Geoffrey Cheng, CFA
Alfred Lau, CFA, FRM
Luella Guo, Alfred Lau, CFA, FRM
Geoffrey Cheng, CFA, Fay Zhou
Phoebe Wong
Milo Liu
Geoffrey Cheng, CFA
Anita Chu, Phoebe Wong
Ma Yuan (Martina), Ph.D, Gu Xinyu (Connie), CPA
Phoebe Wong, Anita Chu
Geoffrey Cheng, CFA
Fei Wu, Tony Liu
Geoffrey Cheng, CFA
Fei Wu, Tony Liu
Alfred Lau, CFA, FRM
Luella Guo, Alfred Lau, CFA, FRM
Hao Hong, CFA
Li Wenbing
Morning Express
29 January 2015
Hang Seng Index Constituents
Company
name
Cheung Kong
Hang Lung Proper
Hengan Intl
China Shenhua-H
Hang Seng Bk
China Res Land
Cosco Pac Ltd
Henderson Land D
Aia Group Ltd
Hutchison Whampo
Kunlun Energy Co
Ind & Comm Bk-H
China Merchant
Want Want China
Sun Hung Kai Pro
New World Dev
Belle Internatio
China Coal Ene-H
Swire Pacific-A
Sands China Ltd
Clp Hldgs Ltd
Bank East Asia
Ping An Insura-H
Boc Hong Kong Ho
China Life Ins-H
Citic Pacific
China Res Enterp
Cathay Pac Air
Hong Kg China Gs
Tingyi Hldg Co
Esprit Hldgs
Bank Of Commun-H
China Petroleu-H
Hong Kong Exchng
Bank Of China-H
Wharf Hldg
Li & Fung Ltd
Hsbc Hldgs Plc
Power Assets Hol
Mtr Corp
China Overseas
Tencent Holdings
China Unicom Hon
Sino Land Co
China Res Power
Petrochina Co-H
Cnooc Ltd
China Const Ba-H
China Mobile
Lenovo Group Ltd
Hang Seng Index
BBG
code
1 HK
101 HK
1044 HK
1088 HK
11 HK
1109 HK
1199 HK
12 HK
1299 HK
13 HK
135 HK
1398 HK
144 HK
151 HK
16 HK
17 HK
1880 HK
1898 HK
19 HK
1928 HK
2 HK
23 HK
2318 HK
2388 HK
2628 HK
267 HK
291 HK
293 HK
3 HK
322 HK
330 HK
3328 HK
386 HK
388 HK
3988 HK
4 HK
494 HK
5 HK
6 HK
66 HK
688 HK
700 HK
762 HK
83 HK
836 HK
857 HK
883 HK
939 HK
941 HK
992 HK
Share
price
(HK$)
145.30
22.70
85.75
21.45
135.00
21.00
11.30
55.40
46.35
101.60
8.29
5.72
28.45
9.16
127.90
9.17
8.94
4.29
104.10
39.65
69.15
31.90
84.85
26.90
31.25
13.50
17.34
17.96
17.82
18.46
8.76
6.62
6.24
179.40
4.45
62.50
7.80
73.00
81.90
33.70
23.80
136.90
12.00
13.12
22.80
8.60
10.46
6.35
103.40
10.32
Mkt
cap
(HK$m)
336,539
101,817
104,991
471,303
258,099
137,147
33,227
166,219
558,291
433,158
66,920
2,048,510
72,913
120,876
361,086
81,553
75,402
90,637
150,820
319,884
174,704
74,865
801,803
284,408
1,237,645
336,195
41,986
70,652
187,325
103,445
17,025
542,993
888,983
209,569
1,530,109
189,383
65,211
1,402,790
174,796
196,354
194,541
1,282,846
287,364
79,560
109,379
2,642,675
467,012
1,597,717
2,114,914
114,641
5d
chg
(%)
3.3
5.8
2.2
-1.4
2.6
-1.4
-0.2
3.6
3.5
3.9
7.0
0.0
3.1
-8.8
4.1
1.4
-2.2
-3.4
2.2
8.5
0.7
2.9
-2.0
1.9
-1.7
-1.2
7.3
4.4
1.0
3.2
4.5
-0.7
1.1
1.1
1.1
3.5
5.0
3.4
5.3
1.0
-3.3
6.4
-0.2
5.1
8.8
0.4
-0.6
-0.3
1.3
-0.6
Ytd
chg
(%)
11.5
4.4
5.8
-6.5
4.5
2.7
2.5
2.0
7.4
13.8
13.1
1.1
9.0
-10.4
8.1
2.8
2.5
-11.7
3.1
3.9
2.8
2.1
7.3
3.7
2.6
2.1
6.8
6.3
0.3
4.2
-5.6
-8.6
-0.2
4.5
1.8
11.6
7.4
-1.4
8.8
6.0
3.3
21.7
15.4
4.8
14.0
0.0
0.2
-0.3
14.3
1.2
24,861.8 15,413,729
2.1
5.3
Source: Bloomberg
Download our reports from Bloomberg: BOCM〈enter〉
–––– 52-week ––––
Hi
Lo
(HK$)
(HK$)
152.00
105.95
26.45
19.80
86.70
74.05
24.40
19.12
135.50
117.60
23.60
13.62
11.92
9.40
57.20
36.46
46.45
34.65
108.50
85.90
14.02
6.88
5.90
4.33
29.10
22.75
13.10
8.92
128.60
90.35
10.48
7.15
10.00
7.00
5.44
3.72
108.00
80.55
68.00
34.50
69.20
56.00
34.45
28.50
88.70
55.60
27.95
21.50
32.80
19.72
16.88
9.35
24.55
15.12
18.30
13.56
18.90
13.91
23.25
16.02
15.24
8.10
7.36
4.53
8.23
5.74
189.00
112.80
4.54
3.03
63.45
46.35
10.70
7.06
84.90
69.75
82.00
57.85
33.80
26.55
26.70
17.52
138.00
93.00
14.22
9.03
14.16
9.83
24.90
17.56
11.70
7.31
15.88
9.72
6.62
4.89
105.10
63.65
12.70
7.62
25,363.0
21,137.6
–––––––––– PE –––––––––––
2014A
2015E
2016E
(X)
(X)
(X)
7.8
9.5
10.0
8.7
15.7
16.2
29.0
28.0
23.2
8.0
8.8
8.7
15.5
15.5
13.9
8.0
10.9
9.3
14.5
12.9
11.6
9.3
17.8
17.4
29.3
22.5
20.1
9.2
12.0
12.6
10.5
10.8
11.1
5.8
5.8
5.6
16.5
16.8
15.4
22.4
22.7
19.4
10.3
16.4
15.3
6.9
11.1
10.2
N/A
13.4
12.9
33.2
54.0
30.9
11.9
15.3
13.9
15.6
16.0
16.9
19.4
16.5
16.2
10.7
11.6
11.3
17.1
14.2
13.2
12.3
11.6
10.5
26.5
19.3
16.9
9.6
9.5
7.0
22.8
92.2
54.0
24.0
20.2
11.9
26.9
25.5
23.7
32.0
29.8
23.8
80.2
74.2
33.3
6.2
6.1
5.8
8.6
9.7
14.0
44.6
40.8
30.5
6.0
6.0
5.6
7.9
16.0
14.1
10.0
16.5
14.4
11.8
10.8
10.2
2.8
19.9
19.5
13.2
18.6
18.2
7.8
8.5
7.3
46.5
43.1
32.8
18.3
17.7
15.7
8.8
14.9
14.5
9.4
9.1
8.4
9.6
10.8
16.2
6.8
7.3
12.8
5.6
5.5
5.3
14.4
15.5
15.3
15.4
18.5
15.8
10.5
11.5
10.4
Yield
P/B
(%)
2.4
3.3
2.2
5.3
4.1
2.1
2.7
1.8
1.0
2.3
2.8
N/A
2.7
2.9
2.6
4.5
N/A
2.3
3.5
4.4
3.7
3.5
1.0
3.8
1.2
2.0
1.4
1.4
1.8
1.5
0.8
N/A
4.8
2.0
5.5
2.8
6.1
5.2
3.1
2.7
2.1
0.2
1.7
3.8
3.3
4.6
5.4
5.9
3.0
2.3
(X)
0.9
0.8
6.4
1.2
2.4
1.4
0.9
0.7
2.6
1.0
1.3
1.1
1.1
8.2
0.8
0.5
2.4
0.5
0.7
7.9
1.9
1.1
2.6
1.7
3.0
0.6
0.8
1.2
3.7
4.4
1.0
0.9
1.0
10.2
1.0
0.7
1.8
0.9
1.4
1.2
1.6
13.8
1.0
0.7
1.6
1.1
1.0
1.1
2.0
4.5
3.5
1.4
Morning Express
29 January 2015
China Ent Index Constituents
Company
name
Shandong Weig-H
China Shenhua-H
Sinopharm-H
China Shipping-H
Zoomlion Heavy-H
Yanzhou Coal-H
Agricultural-H
New China Life-H
Ind & Comm Bk-H
Tsingtao Brew-H
China Com Cons-H
China Coal Ene-H
China Minsheng-H
Guangzhou Auto-H
Ping An Insura-H
Picc Property &
Great Wall Mot-H
Weichai Power-H
Aluminum Corp-H
China Pacific-H
China Life Ins-H
China Oilfield-H
Zijin Mining-H
China Natl Bdg-H
Bank Of Commun-H
Jiangxi Copper-H
China Petroleu-H
China Rail Gr-H
China Merch Bk-H
Bank Of China-H
Dongfeng Motor-H
Citic Securiti-H
Haitong Securi-H
China Telecom-H
Air China Ltd-H
Petrochina Co-H
Huaneng Power-H
Anhui Conch-H
China Longyuan-H
China Const Ba-H
China Citic Bk-H
Hang Seng China Ent Indx
BBG
code
1066 HK
1088 HK
1099 HK
1138 HK
1157 HK
1171 HK
1288 HK
1336 HK
1398 HK
168 HK
1800 HK
1898 HK
1988 HK
2238 HK
2318 HK
2328 HK
2333 HK
2338 HK
2600 HK
2601 HK
2628 HK
2883 HK
2899 HK
3323 HK
3328 HK
358 HK
386 HK
390 HK
3968 HK
3988 HK
489 HK
6030 HK
6837 HK
728 HK
753 HK
857 HK
902 HK
914 HK
916 HK
939 HK
998 HK
Share
price
(HK$)
Mkt
cap
(HK$m)
5d
chg
(%)
Ytd
chg
(%)
6.21
21.45
28.75
5.74
4.96
6.28
3.84
44.65
5.72
53.15
8.83
4.29
9.95
7.21
84.85
15.10
43.85
31.75
3.69
38.70
31.25
13.18
2.51
7.60
6.62
12.76
6.24
5.93
17.66
4.45
11.70
25.45
17.24
4.73
7.02
8.60
10.74
26.85
8.61
6.35
5.83
27,798.27
471,302.97
79,553.98
29,674.95
55,529.94
62,249.23
1,424,271.42
182,387.13
2,048,510.12
70,989.11
230,334.75
90,636.62
404,708.15
60,169.97
801,802.69
223,910.52
158,093.26
65,829.58
82,313.18
378,477.34
1,237,645.36
94,804.17
88,003.79
41,032.60
542,992.54
64,028.70
888,983.32
206,920.83
452,997.16
1,530,109.39
100,808.61
382,430.98
235,787.56
382,810.13
116,836.39
2,642,675.01
148,939.59
136,038.45
69,193.31
1,597,716.92
369,821.44
3.3
-1.4
0.2
-3.7
-6.6
-0.5
-1.5
0.0
0.0
-1.4
-5.2
-3.4
-3.6
2.9
-2.0
-0.4
5.2
-0.3
-3.7
-0.5
-1.7
-1.6
-0.4
-0.7
-0.7
-1.5
1.1
-2.0
-3.0
1.1
0.7
-4.0
-1.7
4.4
-1.8
0.4
-2.7
-2.9
0.6
-0.3
0.0
-0.8
-6.5
4.7
7.9
-16.1
-4.4
-2.0
14.0
1.1
1.0
-5.4
-11.7
-2.5
2.1
7.3
0.1
-0.6
-2.9
2.8
-1.8
2.6
-2.1
14.1
0.8
-8.6
-4.1
-0.2
-7.1
-9.2
1.8
6.6
-12.8
-11.7
4.2
12.0
0.0
2.5
-7.6
6.7
-0.3
-6.3
10.2
24.4
34.5
6.3
6.5
7.3
4.1
45.3
5.9
64.0
10.2
5.4
10.7
9.9
88.7
16.2
45.7
34.9
4.3
42.0
32.8
23.4
2.7
8.4
7.4
15.2
8.2
6.7
20.0
4.5
15.2
34.0
23.2
5.2
7.5
11.7
11.6
35.7
10.0
6.6
6.3
11,964
4,889,669
-0.5
-0.2
12,400.4
Source: Bloomberg
Download our reports from Bloomberg: BOCM〈enter〉
–––– 52-week ––––
Hi
Lo
(HK$)
(HK$)
––––––––––– PE –––––––––––
2014A
2015E
2016E
Yield
P/B
(X)
(X)
(X)
(%)
(X)
5.7
19.1
19.7
4.0
3.5
4.9
3.0
21.1
4.3
50.4
4.9
3.7
5.9
6.6
55.6
9.4
26.1
25.8
2.5
23.6
19.7
11.7
1.6
6.7
4.5
11.6
5.7
3.0
12.1
3.0
9.6
13.7
9.5
3.1
4.2
7.3
6.1
24.0
7.1
4.9
3.6
73.2
8.0
23.2
N/A
16.7
6.7
5.6
18.7
5.8
29.1
9.0
33.2
6.1
11.9
17.1
15.6
13.3
9.8
N/A
26.4
26.5
6.2
20.6
5.3
6.2
10.0
8.6
10.2
6.2
6.0
6.0
28.4
31.6
16.6
26.5
9.6
10.6
9.4
28.6
5.6
5.4
22.5
8.8
20.9
53.2
19.9
15.2
5.4
15.0
5.8
28.1
8.5
54.0
5.7
10.8
14.2
12.7
13.2
10.4
N/A
22.9
19.3
6.5
17.9
5.7
6.1
12.1
9.7
9.7
6.2
6.0
6.4
24.3
19.2
16.7
21.3
10.8
9.9
9.9
22.3
5.5
5.4
18.9
8.7
17.6
15.6
15.1
18.5
5.1
13.8
5.6
24.8
7.7
30.9
5.5
8.3
13.2
11.8
10.0
10.8
N/A
19.4
16.9
7.4
17.7
5.4
5.8
13.4
14.0
8.7
5.6
5.6
6.0
19.7
15.3
15.0
11.2
16.2
9.2
9.2
15.6
5.3
5.1
1.2
5.3
1.1
0.0
3.8
0.4
N/A
0.4
N/A
N/A
2.6
2.3
2.0
3.1
1.0
1.8
2.3
1.0
N/A
1.3
1.2
4.0
N/A
2.6
N/A
4.9
4.8
1.4
4.4
5.5
1.9
N/A
0.9
2.5
0.8
4.6
4.4
1.6
0.7
5.9
N/A
2.4
1.2
2.7
0.7
0.7
0.6
1.1
2.6
1.1
3.7
1.2
0.5
1.2
1.1
2.6
2.6
3.6
1.6
1.0
2.7
3.0
1.1
1.6
0.9
0.9
0.8
1.0
1.1
1.3
1.0
1.2
2.4
2.1
1.1
1.4
1.1
1.9
1.9
1.7
1.1
0.9
9,159.8
8.4
8.1
7.3
3.9
1.3
Morning Express
29 January 2015
BOCOM International
11/F, Man Yee Building, 68 Des Voeux Road, Central, Hong Kong
Main: + 852 3710 3328
Fax: + 852 3798 0133
Rating System
Company Rating
www.bocomgroup.com
Sector Rating
Buy: Expect more than 20% upside in 12 months
LT Buy: Expect more than 20% upside but longer than 12 months
Neutral: Expect low volatility
Sell: Expect more than 20% downside in 12 months
Outperform (“OP”): Expect more than 10% upside in 12 months
Market perform (“MP”): Expect low volatility
Underperform (“UP”): Expect more than 10% downside in 12 months
Research Team
Head of Research
@bocomgroup.com
Raymond CHENG, CFA, CPA, CA
(852) 2977 9393
@bocomgroup.com
raymond.cheng
Strategy
Economics
(852) 2977 9384
hao.hong
(852) 2977 9212
yangqingli
Fei WU
(852) 2977 9392
fei.wu
Shanshan LI, CFA
(86) 10 8800 9788 - 8058
lishanshan
Tony LIU
(852) 2977 9390
xutong.liu
Li WAN, CFA
(86) 10 8800 9788 - 8051
Wanli
Hao HONG, CFA
Banks/Network Financials
Qingli YANG
(86) 10 8800 9788 - 8043
miaoxian.li
Oil & Gas/ Gas Utilities
Consumer Discretionary
Property
Phoebe WONG
(852) 2977 9391
phoebe.wong
Anita CHU
(852) 2977 9205
anita.chu
Summer WANG
(852) 2977 9221
summer.wang
Shawn WU
(852) 2977 9386
shawn.wu
(852) 2977 9387
milo.liu
Consumer Staples
Alfred LAU, CFA, FRM
(852) 2977 9235
alfred.lau
Luella GUO
(852) 2977 9211
luella.guo
(86) 21 6065 3606
louis.sun
(852) 2977 9209
lizhiwu
(852) 2977 9216
miles.xie
Geoffrey CHENG, CFA
(852) 2977 9380
geoffrey.cheng
Fay ZHOU
(852) 2977 9381
fay.zhou
(86) 21 6065 3675
wei.yao
Renewable Energy
Healthcare
Louis SUN
Telecom & Small/ Mid-Caps
Milo LIU
Insurance & Brokerage
Zhiwu LI
Technology
Jerry LI
(852) 2977 9389
liwenbing
Jennifer ZHANG
(852) 2977 9250
yufan.zhang
Yuan MA, PhD
(86) 10 8800 9788 - 8039
yuan.ma
Connie GU, CPA
(86) 10 8800 9788 - 8045
conniegu
Internet
Miles XIE
Transportation & Industrial
Metals & Mining
Jovi LI
Miaoxian LI
Automobile
(852) 2977 9243
jovi.li
Download our reports from Bloomberg: BOCM〈enter〉
Wei YAO
Morning Express
29 January 2015
Analyst Certification
The authors of this report, hereby declare that: (i) all of the views expressed in this report accurately reflect their personal views about any
and all of the subject securities or issuers; and (ii) no part of any of their compensation was, is, or will be directly or indirectly related to the
specific recommendations or views expressed in this report; (iii) no insider information/ non-public price-sensitive information in relation to
the subject securities or issuers which may influence the recommendations were being received by the authors.
The authors of this report further confirm that (i) neither they nor their respective associates (as defined in the Code of Conduct issued by the
Hong Kong Securities and Futures Commission) have dealt in or traded in the stock(s) covered in this research report within 30 calendar days prior
to the date of issue of the report; (ii)) neither they nor their respective associates serve as an officer of any of the Hong Kong listed companies
covered in this report; and (iii) neither they nor their respective associates have any financial interests in the stock(s) covered in this report.
Disclosure of relevant business relationships
BOCOM International Securities Limited, and/or its associated companies, has investment banking relationship with Bank of Communications,
Harbin Bank Co., Ltd., Azure Orbit International Finance Limited, Hanhua Financial Holding Co., Ltd., Central China Securities Company Limited,
China New City Commercial Development Limited, China Shengmu Organic Milk Limited, Broad Greenstate International Company Limited, China
National Culture Group Limited, Sichuan Development Holding Co. Ltd., Austar Lifesciences Limited and BAIC Motor Corporation Limited within
the preceding 12 months.
BOCOM International Holdings Company Limited currently holds more than 1% of the equity securities of Shanghai Fosun Pharmaceuticals Group
Co. Ltd.
BOCOM International Securities Limited currently holds more than 1% of the equity securities of Sanmenxia Tianyuan Aluminum Company Limited.
Disclaimer
By accepting this report (which includes any attachment hereto), the recipient hereof represents and warrants that he is entitled to receive
such report in accordance with the restrictions set forth below and agrees to be bound by the limitations contained herein. Any failure to
comply with these limitations may constitute a violation of law.
This report is strictly confidential and is for private circulation only to clients of BOCOM International Securities Ltd. This report is being
supplied to you strictly on the basis that it will remain confidential. No part of this report may be (i) copied, photocopied, duplicated, stored
or reproduced in any form by any means or (ii) redistributed or passed on, directly or indirectly, to any other person in whole or in part, for
any purpose without the prior written consent of BOCOM International Securities Ltd.
BOCOM International Securities Ltd, its affiliates and related companies, their directors, associates, connected parties and/or employees may own
or have positions in securities of the company(ies) covered in this report or any securities related thereto and may from time to time add to or
dispose of, or may be interested in, any such securities. Further, BOCOM International Securities Ltd, its affiliates and its related companies may
do and seek to do business with the company(ies) covered in this report and may from time to time act as market maker or have assumed an
underwriting commitment in securities of such company(ies), may sell them to or buy them from customers on a principal basis and may also
perform or seek to perform investment banking, advisory, underwriting, financing or other services for or relating to such company(ies) as well as
solicit such investment, advisory, financing or other services from any entity mentioned in this report. In reviewing this report, an investor
should be aware that any or all of the foregoing, among other things, may give rise to real or potential conflicts of interest.
The information contained in this report is prepared from data and sources believed to be correct and reliable at the time of issue of this
report. This report does not purport to contain all the information that a prospective investor may require and may be subject to late
delivery, interruption and interception. BOCOM International Securities Ltd does not make any guarantee, representation or warranty,
express or implied, as to the adequacy, accuracy, completeness, reliability or fairness of any such information and opinion contained in this
report and accordingly, neither BOCOM International Securities Ltd nor any of its affiliates nor its related persons shall not be liable in any
manner whatsoever for any consequences (including but not limited to any direct, indirect or consequential losses, loss of profits and
damages) of any reliance thereon or usage thereof.
This report is general in nature and has been prepared for information purposes only. It is intended for circulation amongst BOCOM
International Securities Ltd’s clients generally and does not have regard to the specific investment objectives, financial situation and the
particular needs of any specific person who may receive this report. The information and opinions in this report are not and should not be
construed or considered as an offer, recommendation or solicitation to buy or sell the subject securities, related investments or other
financial instruments thereof.
The views, recommendations, advice and opinions in this report may not necessarily reflect those of BOCOM International Securities Ltd or
any of its affiliates, and are subject to change without notice. BOCOM International Securities Ltd has no obligation to update its opinion or
the information in this report.
Investors are advised to make their own independent evaluation of the information contained in this research report, consider their own
individual investment objectives, financial situation and particular needs and consult their own professional and financial advisers as to the
legal, business, financial, tax and other aspects before participating in any transaction in respect of the securities of company(ies) covered in
this report. The securities of such company(ies) may not be eligible for sale in all jurisdictions or to all categories of investors.
This report is not directed to, or intended for distribution to or use by, any person or entity who is a citizen or resident of or located in any
locality, state, country or other jurisdiction where such distribution, publication, availability or use would be contrary to any law, regulation,
rule or other registration or licensing requirement.
BOCOM International Securities Ltd is a wholly owned subsidiary of Bank of Communications Co Ltd.
Download our reports from Bloomberg: BOCM〈enter〉
© Copyright 2026