
Daily Market Commentary
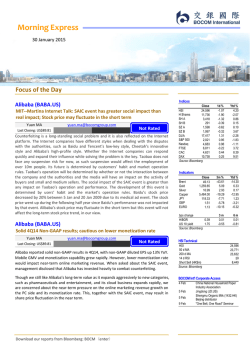
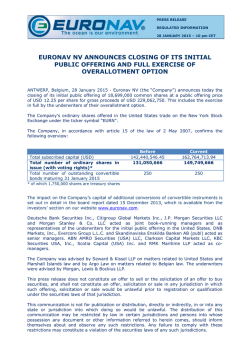
Morning Express
03 February 2015
Focus of the Day
Indices
Consumer Discretionary
HK Consumer – Disappointing Dec HK retail sales; a challenging year for
2015E
Phoebe WONG
[email protected]
UP
MP
OP
Hong Kong retail sales (in value) in Dec came in at a 3.9% YoY decline, well below the
market consensus of 4.4% growth. This was a sharp reversal compared with a 4.2%
growth in Nov and a 1.4% growth even for the “protest” month of Oct. Given the already
easier comps, the Dec results were notably disappointing, in our view. We believe the key
setback was the slowdown in the growth of Chinese tourist arrivals to 13% in Dec (vs.
+24% in Nov and +18% in Oct). The segment that showed the strongest slowdown was
jewelry & watches (-16% vs. -2% in Nov), followed by department stores (-5% vs. +6% in
Nov), consumer durable goods (+4% vs. +14% in Nov) and medicine & cosmetics (+4% vs.
+10% in Nov). The most resilient segment, namely supermarket, also slowed from 4% to
zero. See Fig 1 for details.
For the full year of 2014, this led to a 0.2% YoY sales decrease for the sector, the first
decline since 2004 after SARS. Looking ahead, we are increasingly cautious on the 2015E
outlook. With sustained easing growth of Chinese tourists and their spending, and the
unfavorable change of their spending pattern towards buying more lower-priced
products including daily necessities, coupled with increasingly sluggish local consumption,
a worse year in 2015E would not come as a surprise. In our HK coverage universe, our
only Buy call is Luk Fook (590 HK), and we maintain Neutral on Chow Tai Fook (1929 HK),
Sa Sa (178 HK) and Lifestyle (1212 HK).
Close
HSI
24,485
H Shares
11,578
SH A
3,278
SH B
289
SZ A
1,570
SZ B
1,064
DJIA
17,361
S&P 500
2,021
Nasdaq
4,677
FTSE
6,783
CAC
4,628
DAX
10,828
Source: Bloomberg
1d %
-0.09
-1.21
-2.56
-0.10
-0.63
-0.53
1.14
1.30
0.89
0.49
0.51
1.25
Ytd %
3.73
-3.39
-3.30
-0.45
6.22
3.46
-2.59
-1.85
-1.25
3.30
8.31
10.43
Close
54.75
1,273.39
17.21
5,500.00
117.49
1.50
1.13
3m %
-36.23
9.25
6.49
-17.85
-2.93
-5.92
-9.18
Ytd %
-4.50
7.47
9.57
-12.70
1.95
-3.54
-6.30
bps change
HIBOR
0.39
US 10 yield
1.67
Source: Bloomberg
3m
0.01
-0.67
6m
0.01
-0.82
Indicators
Brent
Gold
Silver
Copper
JPY
GBP
EURO
HSI Technical
HSI
50 d MA
200 d MA
14 d RSI
Short Sell (HK$m)
Source: Bloomberg
24,485
23,813
23,647
56
7,942
BOCOM Int'l Corporate Access
4 Feb
4 Feb
5 Feb
9 Feb
Download our reports from Bloomberg: BOCM〈enter〉
China National Household Paper
Industry Association
Shengmu Organic Milk (1432.HK)
Beijing distributor
Jingdong (JD.US)
"One Belt, One Road" Seminar
Morning Express
03 February 2015
Hang Seng Index (1 year)
Internet Sector
26,000
Internet monthly report – Jan 2015
Yuan MA
[email protected]
25,000
24,000
UP
MP
OP
23,000
22,000
Internet companies achieved great progress in the mobile terminal field in 2014. We
analyzed the development, positioning, strengths, weaknesses and potential growth of
the mobile terminal business of BAT and 3M (360 and Xiaomi), and compared the traffic,
revenue, core business revenue and market share data of the mobile terminal business of
the internet companies. China liberalized the credit market to the community in Jan 2015.
Ali and Tencent were allowed to enter the market. Weixin launched Moments feeds ad as
a first attempt of monetization. In addition, we lift our valuation of the cloud business
and raise Kingsoft’s TP to HK$22.6, with the rating upgraded to Buy. Alibaba announced
its quarterly results ended 31 Dec 2014 on 29 Jan. Despite the steady results, the share
price of Alibaba would fluctuate in the short term given the lower monetization rate and
the recent counterfeiting issues. We are positive on the industry outlook, especially the
profit model of the performance-based ads, and the opportunities arising from the
development and expansion of mobile terminal, payment and other sub-sectors. We
maintain Outperform rating on the sector and recommend Baidu (BIDU.US), Kingsoft
(3888.HK), Tencent (700.HK) and Qihoo (QIHU.US).
21,000
Source: Company data, Bloomberg
HS China Enterprise Index (1 year)
13,000
12,000
11,000
10,000
9,000
8,000
Source: Company data, Bloomberg
Shanghai A-shares (1 year)
4,000
3,500
HK Property Sector
3,000
How long can high rent sustain?
2,500
2,000
Alfred LAU, CFA
[email protected]
UP
MP
OP
Private housing completion hit its 8-year high, but did not help to ease the high rents,
mainly due to the delayed deliveries, with up to 7,000 units falling into 1Q15. Together
with the increasing public housing supply, we expect a total housing supply of 35,000
units in 2015. On the other hand, we estimate housing demand to stay at 30,000 units in
2015, rather than the long-term target of 48,000 units, when some of the redevelopment
and replacement of subdivided units are on hold. Therefore, we expect a flat to a 5%
decline in rents in 2015 and maintain our view of a 10%/20% decline in property prices,
before/after taking into account the potential U.S. rate hike.
The sector is trading at a
34.5% NAV discount. We maintain Market Perform on the sector, and prefer landlords to
developers. Top pick: Hysan (14 HK, Buy, TP HK$43.60).
Container Shipping Sector
Weekly container shipping commentary
Geoffrey CHENG, CFA [email protected]
UP
MP
OP
Drewry commented that the new alliance structure for the Asia-Europe tradelane did not
reduce the competition and service levels. SCFI reversed to a decline of 3.4% WoW for
the week ended 30th January 2015. Freight rates on both of the two major East-West
tradelanes went down last week.
We maintain our MARKET PERFORM
recommendation. Share prices of the two H-share container shipping companies went
down despite their positive profit alert for FY14.
Download our reports from Bloomberg: BOCM〈enter〉
Source: Company data, Bloomberg
Shenzhen A-shares (1 year)
1,800
1,700
1,600
1,500
1,400
1,300
1,200
1,100
1,000
900
800
Source: Company data, Bloomberg
03 February 2015
Sector note
Consumer Discretionary Sector
HK Consumer
UP
MP
Disappointing Dec HK retail sales; a challenging year for
2015E
Hong Kong retail sales (in value) in Dec came in at a 3.9% YoY decline, well below the
market consensus of 4.4% growth. This was a sharp reversal compared with a 4.2%
growth in Nov and a 1.4% growth even for the “protest” month of Oct. Given the
already easier comps, the Dec results were notably disappointing, in our view. We
believe the key setback was the slowdown in the growth of Chinese tourist arrivals to
13% in Dec (vs. +24% in Nov and +18% in Oct). The segment that showed the
strongest slowdown was jewelry & watches (-16% vs. -2% in Nov), followed by
department stores (-5% vs. +6% in Nov), consumer durable goods (+4% vs. +14% in
Nov) and medicine & cosmetics (+4% vs. +10% in Nov). The most resilient segment,
namely supermarket, also slowed from 4% to zero. See Fig 1 for details.
For the full year of 2014, this led to a 0.2% YoY sales decrease for the sector, the first
decline since 2004 after SARS. Looking ahead, we are increasingly cautious on the
2015E outlook. With sustained easing growth of Chinese tourists and their spending,
and the unfavorable change of their spending pattern towards buying more
lower-priced products including daily necessities, coupled with increasingly sluggish
local consumption, a worse year in 2015E would not come as a surprise. In our HK
coverage universe, our only Buy call is Luk Fook (590 HK), and we maintain Neutral
on Chow Tai Fook (1929 HK), Sa Sa (178 HK) and Lifestyle (1212 HK).
Figure 1: Hong Kong retail sales growth by key category
Oct 2014
Overall growth
1%
Jewelry and watches
-12%
Consumer durable goods
26%
Apparel
-8%
Department stores
1%
Supermarkets
2%
Medicine and cosmetics
8%
Food, alcoholic drinks and tobacco
5%
Source: Census and Statistics Department of HKSAR
Nov 2014
4%
-2%
14%
-3%
6%
4%
10%
10%
Dec 2014
-4%
-16%
4%
-4%
-5%
0%
4%
7%
2014
-0.2%
-14%
2%
4%
1%
5%
9%
7%
Figure 2: Hong Kong monthly retail sales growth
(HK$bn)
60
HK retail sales (LHS)
Retail sales growth (RHS)
50%
40%
50
30%
40
30
(YoY %)
`
20
20%
10%
0%
10
-10%
0
-20%
Source: Census and Statistics Department of HKSAR
Download our reports from Bloomberg: BOCM〈enter〉
Phoebe Wong
[email protected]
Tel: (852) 2977 9391
OP
03 February 2015
HK Property Sector
HK Property Sector
UP
How long can high rent sustain?
MP
OP
Cover chart: 7,000 units to be delivered in 1Q15
Completion and delivery
Completion
(No. of units)
The 7,000 units completed in 2014 will
only be delivered in 1Q15, explaining the
rental surge last year.
Delivery
up to 7,000 units delayed into 1Q15
18,000
16,000
14,000
However, together with the increasing
public housing supply, we expect a flat to
5% decline in rents in 2015.
We expect property prices to drop by
10%/20%, before/after taking into
account the potential rate hike.
12,000
10,000
8,000
6,000
4,000
2,000
0
2009
2010
2011
2012
2013E
2014E
2015E
Source: BOCOM Int’l
Surge in completion in 2014 yet to be reflected. Private housing completion amounted
to 15,700 units in 2014, reaching an 8-year high, according to the Transport and Housing
Bureau. However, we believe the market should focus more on the delivery (or with
reference to certificate of compliance), which is calculated by the Lands Department and
should be more relevant for the current users/rental-driven cycle. We maintain our view
that property rent is determined by fundamental demand-supply dynamics. Even when
some homeowners may take advantage of the low interest rate and deliberately leave
the units vacant to push up rent, the game should no longer work at a time of increasing
supply, where supply should be measured by delivery, rather than completion, in this
case. The difference between completion and delivery used to be only 3-6 months, when
the project was fully furnished and ready for use/rental, after the physical
super-structure was completed. However, the time lag has extended to as much as 9-12
months over the past two years, partly due to the delayed construction pace, in our view.
We estimate there are close to 7,000 units completed in 2014, including major projects,
e.g. Park Signature (1,620 units), City Point (1,717 units), Mont Vert (1,071 units), and The
Austin (576 units), with their delivery delayed to 1Q15. This explains the housing shortage
in 2014, and together with the increasing public housing completion, we expect an
overall supply of as much as 35,000 units in 2015.
Property rent on the downside. On the other hand, on top of the suspension of CIES, we
believe the government is aware of the adverse impact of overnight demand creation.
It has put the redevelopment projects and replacement of subdivided units on hold, and
focused on rebuilding land reserve through rezoning. Therefore, we expect property
demand to reach only 30,000 units in 2015, rather than the average annual demand of
48,000 units as the long-term target (Figure 1). This means that property market may see
surplus supply for the first time in three years (Figure 2), and we expect a flat to a 5%
decline in rents in 2015. In light of the weaker rental outlook, we expect rental yield to
expand and property prices to drop by 10%/20%, before/after taking into account for
potential U.S. rate hike. The sector is trading at a 34.5% NAV discount and 0.72x 2014
P/B, in line with its average since 2009, which may retreat to its lower range in the case
that market changes its positive outlook on property prices, in our view. We maintain
Market Perform on the sector, and prefer landlords over developers. Top pick: Hysan (14
HK, Buy, TP HK$43.60).
Download our reports from Bloomberg: BOCM〈enter〉
Alfred Lau, CFA, FRM
[email protected]
Tel: (852) 2977 9235
03 February 2015
Container Shipping Weekly
Container Shipping Sector
Container Shipping Sector
UP
Weekly container shipping commentary
MP
OP
Container shipping companies - Valuation summary
Company
Name
BBG
code
Sh. Price
2 Feb 15
Rating Target
Price
+/-
–––––– PER ––––––
2013 2014E 2015E
–––––– PBR ––––––
2013 2014E 2015E
(LC)
(LC)
(%)
(X)
(X)
(X)
(X)
(X)
(X)
China COSCO
1919 HK
3.76 NEUTRAL
3.10
(17.6)
129.7
N.A.
15.1
1.26
1.27
1.16
CSCL
NOL
2866 HK
NOL SP
2.37 NEUTRAL
0.99
SELL
2.1
0.73
(11.4)
(28.3)
N.A. 259.38
N.A.
N.A.
13.0
35.5
0.91
0.90
0.82
1.09
0.80
1.05
OOIL
316 HK
BUY
58.0
13.7
87.0
12.4
8.9
0.92
0.87
0.80
SITC
1308 HK
4.25 LT BUY
Source: Company, BOCOM Int’l estimates
4.78
12.5
12.5
11.0
8.1
1.90
1.71
1.50
51.00
News flow – New alliance begins to work.
Drewry, an international shipping
consultant, commented that the new alliance structure since the start of the year,
Drewry commented that the new
alliance structure for the
Asia-Europe tradelane did not
reduce the competition and service
levels.
SCFI reversed to a decline of 3.4%
WoW for the week ended 30th
January 2015. Freight rates on
both of the two major East-West
tradelanes went down last week.
We maintain our MARKET PERFORM
recommendation. Share prices of
the two H-share container shipping
companies went down despite their
positive profit alert for FY14.
with the four mega alliances representing virtually all capacity of the Asia – Europe
(Northern Europe) tradelane, did not affect the competition and service levels.
Meanwhile, Evergreen Shipping has finalized the plan to charter 11 ultra-large
container vessels (ULCV) from Shoei Kisen Kaisha for delivery three years from now,
Geoffrey Cheng, CFA
in order to meet the continual competition amongst container shipping companies to
[email protected]
Tel: (852) 2977 9380
drive costs lower.
Reality – SCFI reversed trend.
With the freight rates on the Transpacific tradelane
th
moving back to the pre-GRI implementation (15 January) level, and the freight rates
on the Asia-Europe tradelane westbound voyages spiraling down after the GRI
implementation, the Shanghai Container Freight Index lost 3.4% WoW.
According
to Shanghai Shipping Exchange, the weekly shipping capacity on the Asia-Pacific
tradelane increased by 5% YoY in January, contributing to the weakened rates last
week, notwithstanding a high load factor.
On the Transpacific tradelane, the
increase in supply capacity to East Coast destinations has dragged the freight rates
lower (down 1.4% WoW) while the freight rates to West Coast destinations dropped
4.1% WoW as cargo owners avoided congestion at the West Coast ports.
We maintain our MARKET PERFORM recommendation.
The two HK-listed
container shipping companies with A-shares listed on the Shanghai Shipping
Exchange dropped most among the HK-listed container shipping companies for the
nd
week ended 2 February, despite their positive profit alert for FY2014.
Indeed, the
two container shipping companies were able to turn around last year largely because
of non-recurrent income.
We maintain our Market Perform recommendation.
Download our reports from Bloomberg: BOCM〈enter〉
Morning Express
03 February 2015
Market Review
Hong Kong stocks fell on Monday after the final reading of HSBC Jan China manufacturing
PMI came in lower than expectation. The Hang Seng Index closed 22 points, or 0.1%,
lower at 24,484. Want Want (151.HK) and Hengan (1044.HK) were the worst blue-chip
performers, down 2.6% and 2.4%, respectively. MSB (1988.HK) fell 3.1%, dragged by
rumors that the President is being investigated. Other mainland lenders also edged lower.
Chongqing Bank (1963.HK) lost 2.7% and CQRCB (3618.HK) fell 2.3%. BOC (3988.HK) shed
1.2%. China Life (2628.HK) dropped 2.3% despite positive profit alert. Hong Kong
developers rose. Henderson land (12.HK) climbed 2%. SHKP (16.HK) edged up 0.6%.
US stocks surged on Monday following a late-session rally driven by rising oil prices and
upbeat earnings. The S&P 500 gained 25.86 points, or 1.3%, to 2,020.86. The DJIA rose
196 points, or 1.1%, to 17,361.04. European stocks posted moderate gains. The Stoxx
Europe 600 added 0.1% to 367.29.
News Reaction
China raises general transfer payment ratio to above 60%. To deal with the problems
and deficiencies of the central and local transfer payment systems, the State Council
issued the Opinions on the Reform and Optimization of the Central and Local Transfer
Payment Systems, which consolidates the general transfer payments, establishes a
steadily-growing mechanism of the general transfer payments and gradually raises the
general transfer payment ratio to above 60%.
Jan HSBC China’s final Manufacturing PMI hits below 50 for second month; demand
remains sluggish. The final reading of HSBC China’s manufacturing PMI in Jan was revised
down slightly and hit below the 50.0 level that separates growth from contraction for the
second consecutive month. The new order and new export order sub-indices were
revised down slightly but remained slightly above the 50.0 mark. The job market had
contracted for 15 months in a row. The manufacturing demand remained sluggish,
requiring more easing support ahead.
PBOC to introduce registration system for asset securitization products. According to
the informed sources, China’s central bank had communicated with the market
institutions about the potential replacement of the approval system for the asset
securitization products in the interbank market with a registration system. This will mark
the removal of the approval system for the asset securitization products in the interbank
and exchanges markets.
Jan average home prices in 100 Chinese cities end 8-month losing streak; YoY decline
widens. According to the 100 City Price Index Report released by China Index Research
Institute, the average home price of 100 cities in China was slightly up 0.21% in Jan after
experiencing an 8-month losing streak, but the YoY decline of 3.09% was 0.4 ppt higher
than the previous month. Overall, the home prices in 100 cities stabilized in the first
month of 2015 amid better expectations on the property market performance, with
significant growth in the number of cities reporting a price hike. In particular, all the tier-1
cities showed MoM growth in home prices.
NDRC regrets Mexico’s decision to indefinitely suspend high-speed railway project. The
National Development and Reform Commission (NDRC) said on Monday that it regrets
Mexico’s decision to indefinitely suspend the high-speed railway project from Mexico City
to Queretaro and urged the Mexican government to effectively protect the legitimate
rights and interests of the Chinese companies.
Download our reports from Bloomberg: BOCM〈enter〉
Morning Express
03 February 2015
Economic releases for this week - USA
Date Time
5-Feb
5-Feb
6-Feb
6-Feb
6-Feb
Source: Bloomberg
Event
Initial jobless claims (k)
Trade balance (US$ bn)
Change in Non-farm payrolls(k)
Change in Private payrolls(k)
Unemployment rate
Economic releases for this week - China
Survey
-38.0
231.0
220.0
5.6%
Prior
265.0
-39.0
252.0
240.0
5.6%
Date Time
1-Feb
4-Feb
Event
Manufacturing PMI
HSBC Manufacturing PMI
Survey
50.2
49.8
Prior
50.1
49.8
Source: Bloomberg
BOCOM Research Latest Reports
Data
02 Feb 201 5
02 Feb 201 5
02 Feb 201 5
30 Jan 201 5
30 Jan 201 5
30 Jan 201 5
29 Jan 201 5
29 Jan 201 5
29 Jan 201 5
28 Jan 201 5
28 Jan 201 5
27 Jan 201 5
27 Jan 2015
27 Jan 2015
26 Jan 2015
23 Jan 2015
23 Jan 2015
23 Jan 2015
23 Jan 2015
23 Jan 2015
22 Jan 2015
Report
Property Sector – HK/China Property Weekly 20150130
Vinda (3331 HK) - Winner in premium segment; BUY reiterated
HKEx (388.HK) - Lower TP to HK$195.3
Alibaba Group (BABA.US) - MIT--Martina Internet Talk: SAIC event has greater social impact than real
impact; Stock price may fluctuate in the short term
Transportation Sector - Weekly transportation news wrap
Alibaba Group (BABA.US) - Solid 4Q14 Non-GAAP results; cautious on lower monetization rate
The Link REIT (823.HK) - A pricy ticket to a greenfield project
New World Development (17.HK) - Securing urban landbank at a low cost
China Market Strategy - Margin of Danger
Energy Sector - Bocom Energy Weekly
Kerry Logistics Network (636 HK) - Robust outlook expected for 2015
Kingsoft (3888.HK) - Raise Kingsoft Cloud valuation; lift TP and upgrade to Buy
Container Shipping Sector - Weekly container shipping commentary
Hang Lung Properties (101.HK) - Well-positioned against challenges
Property Sector - HK/China Property Weekly 20150123
Transportation Sector - Weekly transportation news wrap
Daphne (210.HK) - Another year of profit warning; de-rating imminent
Austar Lifesciences Limited (6118.HK) - Revisiting our forecasts
Sinotrans Limited (598.HK) - Robust fundamentals unchanged in 2015
GOME (493.HK) - China's leading consumer appliances retailer with strong O2O growth; Initiate with Buy
Tencent (700.HK) - Moments feed ads indicate the commercialization of Weixin
Source: Company data, BOCOM International
Download our reports from Bloomberg: BOCM〈enter〉
Analyst
Luella Guo, Alfred Lau, CFA, FRM
Summer Wang
Wan Li, CFA, Li Shanshan, CFA
Ma Yuan (Martina), Ph.D, Gu Xinyu (Connie), CPA
Geoffrey Cheng, CFA, Fay Zhou
Ma Yuan (Martina), Ph.D, Gu Xinyu (Connie), CPA
Alfred Lau, CFA, FRM
Alfred Lau, CFA, FRM
Hao Hong, CFA
Fei Wu, Tony Liu
Geoffrey Cheng, CFA
Ma Yuan (Martina), Ph.D, Gu Xinyu (Connie), CPA
Geoffrey Cheng, CFA
Alfred Lau, CFA, FRM
Luella Guo, Alfred Lau, CFA, FRM
Geoffrey Cheng, CFA, Fay Zhou
Phoebe Wong
Milo Liu
Geoffrey Cheng, CFA
Anita Chu, Phoebe Wong
Ma Yuan (Martina), Ph.D, Gu Xinyu (Connie), CPA
Morning Express
03 February 2015
Hang Seng Index Constituents
Company
name
Cheung Kong
Hang Lung Proper
Hengan Intl
China Shenhua-H
Hang Seng Bk
China Res Land
Cosco Pac Ltd
Henderson Land D
Aia Group Ltd
Hutchison Whampo
Kunlun Energy Co
Ind & Comm Bk-H
China Merchant
Want Want China
Sun Hung Kai Pro
New World Dev
Belle Internatio
China Coal Ene-H
Swire Pacific-A
Sands China Ltd
Clp Hldgs Ltd
Bank East Asia
Ping An Insura-H
Boc Hong Kong Ho
China Life Ins-H
Citic Pacific
China Res Enterp
Cathay Pac Air
Hong Kg China Gs
Tingyi Hldg Co
Esprit Hldgs
Bank Of Commun-H
China Petroleu-H
Hong Kong Exchng
Bank Of China-H
Wharf Hldg
Li & Fung Ltd
Hsbc Hldgs Plc
Power Assets Hol
Mtr Corp
China Overseas
Tencent Holdings
China Unicom Hon
Sino Land Co
China Res Power
Petrochina Co-H
Cnooc Ltd
China Const Ba-H
China Mobile
Lenovo Group Ltd
Hang Seng Index
BBG
code
1 HK
101 HK
1044 HK
1088 HK
11 HK
1109 HK
1199 HK
12 HK
1299 HK
13 HK
135 HK
1398 HK
144 HK
151 HK
16 HK
17 HK
1880 HK
1898 HK
19 HK
1928 HK
2 HK
23 HK
2318 HK
2388 HK
2628 HK
267 HK
291 HK
293 HK
3 HK
322 HK
330 HK
3328 HK
386 HK
388 HK
3988 HK
4 HK
494 HK
5 HK
6 HK
66 HK
688 HK
700 HK
762 HK
83 HK
836 HK
857 HK
883 HK
939 HK
941 HK
992 HK
Share
price
(HK$)
149.60
22.85
90.00
21.15
136.40
19.64
11.16
56.50
45.20
104.70
8.06
5.50
28.50
9.08
127.40
9.30
8.73
4.16
104.50
37.70
69.00
32.20
80.70
27.45
29.90
13.30
16.80
17.98
17.82
18.92
8.66
6.46
6.07
179.10
4.29
62.80
7.53
71.25
81.75
34.00
22.80
135.80
11.74
13.14
21.60
8.44
10.28
6.16
103.90
10.18
Mkt
cap
(HK$m)
346,498
102,489
110,195
450,410
260,775
128,265
32,815
169,519
544,439
446,375
65,063
1,934,296
73,041
119,820
359,675
82,709
73,631
86,352
151,362
304,152
174,325
75,569
744,804
290,223
1,091,257
331,214
40,679
70,731
187,325
106,023
16,830
515,959
829,407
209,218
1,408,067
190,292
62,954
1,369,360
174,476
198,102
186,367
1,272,538
281,137
79,682
103,623
2,428,556
458,976
1,548,353
2,125,141
113,086
5d
chg
(%)
2.9
3.2
6.7
-1.2
2.2
-6.5
-3.3
0.9
-0.4
3.4
-0.9
-5.7
-0.9
-1.0
1.0
1.1
-3.0
-4.6
1.2
-3.3
0.0
2.1
-7.9
2.0
-8.1
-0.7
-3.9
-0.8
0.8
5.2
1.4
-6.0
-3.0
-1.5
-5.3
2.5
-3.1
-1.9
1.6
1.5
-6.2
-0.9
-2.0
0.2
3.1
-4.4
-2.5
-4.2
0.0
-4.0
Ytd
chg
(%)
14.8
5.1
11.0
-7.8
5.6
-4.0
1.3
4.1
4.8
17.3
10.0
-2.8
9.2
-11.2
7.7
4.3
0.1
-14.4
3.5
-1.2
2.6
3.0
2.0
5.8
-1.8
0.6
3.4
6.4
0.3
6.8
-6.7
-10.8
-2.9
4.3
-1.8
12.1
3.7
-3.7
8.6
6.9
-1.1
20.7
12.9
5.0
8.0
-1.9
-1.5
-3.3
14.8
-0.2
24,484.7 15,217,189
-1.7
3.7
Source: Bloomberg
Download our reports from Bloomberg: BOCM〈enter〉
–––– 52-week ––––
Hi
Lo
(HK$)
(HK$)
152.00
105.95
26.45
19.80
93.00
74.05
24.40
19.12
136.60
117.60
23.60
13.62
11.92
9.40
57.20
36.46
46.45
34.65
108.50
85.90
14.02
6.88
5.90
4.33
29.70
22.75
13.10
8.92
129.40
90.35
10.48
7.15
10.00
7.00
5.44
3.72
108.00
80.55
68.00
34.50
69.60
56.00
34.45
28.50
88.70
55.60
27.95
21.50
32.80
19.72
16.88
9.35
24.55
15.12
18.30
13.56
18.90
13.91
23.25
16.02
15.24
8.10
7.36
4.53
8.23
5.74
189.00
112.80
4.54
3.03
63.90
46.35
10.70
7.06
84.90
69.75
82.50
57.85
34.70
26.55
26.70
17.52
138.00
93.00
14.22
9.03
14.16
9.83
24.90
17.56
11.70
7.31
15.88
9.72
6.62
4.89
105.10
63.65
12.70
7.62
25,363.0
21,137.6
–––––––––– PE –––––––––––
2014A
2015E
2016E
(X)
(X)
(X)
8.0
9.7
10.3
8.7
15.8
16.4
30.5
29.3
24.2
7.9
8.7
8.6
15.6
15.7
14.1
7.5
10.2
8.7
14.3
12.7
11.2
9.5
18.1
17.6
28.5
21.9
19.6
9.5
12.4
13.0
10.3
10.5
10.9
5.6
5.6
5.4
16.5
16.9
15.4
22.2
23.0
19.2
10.2
16.3
15.2
7.0
11.2
10.3
N/A
13.1
12.6
32.3
54.2
30.5
11.9
15.4
14.0
14.8
15.3
16.3
19.3
16.5
16.2
10.8
11.7
11.6
16.3
13.5
12.6
12.6
11.9
10.8
25.4
19.2
16.5
9.4
7.6
6.9
22.1
105.0
54.7
24.0
20.4
12.0
26.9
25.5
23.7
32.8
30.5
24.6
79.2
73.4
32.9
6.0
6.0
5.7
8.3
9.5
13.6
44.6
40.6
30.3
5.8
5.8
5.4
8.0
16.3
14.4
9.7
15.9
13.9
11.5
10.5
10.0
2.8
19.9
19.4
13.3
18.7
18.4
7.5
8.2
7.0
46.2
42.8
32.6
18.0
17.4
15.4
8.8
15.0
14.5
8.9
8.6
7.9
9.5
10.6
15.9
6.7
7.2
12.6
5.5
5.4
5.1
14.5
15.6
15.4
15.1
16.6
13.7
10.4
11.4
10.2
Yield
P/B
(%)
2.4
3.3
2.1
5.3
4.0
2.3
2.7
1.8
1.0
2.3
2.9
N/A
2.7
3.0
2.6
4.4
N/A
2.4
3.4
4.6
3.8
3.4
1.1
3.7
1.2
2.0
1.5
1.4
1.8
1.5
0.8
N/A
4.9
2.0
5.7
2.8
6.3
5.3
3.1
2.7
2.1
0.2
1.7
3.8
3.5
4.7
5.5
6.0
3.0
2.4
(X)
0.9
0.8
6.7
1.2
2.4
1.3
0.9
0.7
2.5
1.1
1.3
1.1
1.1
8.2
0.8
0.5
2.3
0.5
0.7
7.5
1.9
1.1
2.5
1.7
2.8
0.5
0.8
1.2
3.7
4.5
1.0
0.8
1.0
10.1
1.0
0.7
1.7
0.9
1.4
1.3
1.6
13.7
1.0
0.7
1.5
1.1
1.0
1.0
2.1
4.5
3.5
1.4
Morning Express
03 February 2015
China Ent Index Constituents
Company
name
Shandong Weig-H
China Shenhua-H
Sinopharm-H
China Shipping-H
Zoomlion Heavy-H
Yanzhou Coal-H
Agricultural-H
New China Life-H
Ind & Comm Bk-H
Tsingtao Brew-H
China Com Cons-H
China Coal Ene-H
China Minsheng-H
Guangzhou Auto-H
Ping An Insura-H
Picc Property &
Great Wall Mot-H
Weichai Power-H
Aluminum Corp-H
China Pacific-H
China Life Ins-H
China Oilfield-H
Zijin Mining-H
China Natl Bdg-H
Bank Of Commun-H
Jiangxi Copper-H
China Petroleu-H
China Rail Gr-H
China Merch Bk-H
Bank Of China-H
Dongfeng Motor-H
Citic Securiti-H
Haitong Securi-H
China Telecom-H
Air China Ltd-H
Petrochina Co-H
Huaneng Power-H
Anhui Conch-H
China Longyuan-H
China Const Ba-H
China Citic Bk-H
Hang Seng China Ent Indx
BBG
code
Share
price
(HK$)
Mkt
cap
(HK$m)
5d
chg
(%)
Ytd
chg
(%)
(X)
(X)
1066 HK
1088 HK
1099 HK
1138 HK
1157 HK
1171 HK
1288 HK
1336 HK
1398 HK
168 HK
1800 HK
1898 HK
1988 HK
2238 HK
2318 HK
2328 HK
2333 HK
2338 HK
2600 HK
2601 HK
2628 HK
2883 HK
2899 HK
3323 HK
3328 HK
358 HK
386 HK
390 HK
3968 HK
3988 HK
489 HK
6030 HK
6837 HK
728 HK
753 HK
857 HK
902 HK
914 HK
916 HK
939 HK
998 HK
6.06
21.15
28.05
5.55
4.60
6.16
3.75
44.65
5.50
51.05
8.05
4.16
9.16
7.04
80.70
14.96
43.30
30.25
3.47
37.30
29.90
12.62
2.45
7.40
6.46
12.66
6.07
5.69
17.24
4.29
11.26
24.35
16.88
4.67
7.16
8.44
10.82
25.65
8.31
6.16
5.71
27,126.82
450,409.72
77,617.02
28,308.39
53,456.41
60,536.72
1,328,239.83
182,157.58
1,934,296.40
68,828.39
195,418.49
86,351.90
372,702.28
58,620.99
744,804.32
221,834.52
156,214.93
63,159.86
74,685.42
352,174.28
1,091,257.45
91,250.03
84,397.40
39,952.79
515,959.05
62,783.62
829,406.97
196,288.27
439,198.58
1,408,067.06
97,017.51
356,775.54
220,060.77
377,954.19
109,625.98
2,428,556.38
146,341.78
129,700.75
66,782.39
1,548,352.68
348,983.27
-5.2
-1.2
-5.1
-7.5
-8.2
-3.8
-4.1
0.0
-5.7
-4.5
-11.4
-4.6
-10.2
-2.1
-7.9
-4.2
1.5
-6.9
-8.0
-10.2
-8.1
-6.4
-6.1
-3.4
-6.0
-1.4
-3.0
-5.2
-7.0
-5.3
-3.9
-3.2
-3.4
-2.1
-3.5
-4.4
-3.7
-6.0
-4.5
-4.2
-4.0
-3.2
-7.8
2.2
4.3
-22.2
-6.2
-4.3
14.0
-2.8
-2.9
-13.7
-14.4
-10.2
-0.3
2.0
-0.8
-1.8
-7.5
-3.3
-5.3
-1.8
-6.2
11.4
-1.9
-10.8
-4.8
-2.9
-10.8
-11.4
-1.8
2.6
-16.6
-13.5
2.9
14.2
-1.9
3.2
-11.7
3.0
-3.3
-8.2
10.0
24.4
34.5
6.3
6.4
7.3
4.1
45.3
5.9
64.0
10.2
5.4
10.7
9.9
88.7
16.2
45.7
34.9
4.3
42.0
32.8
23.4
2.7
8.4
7.4
15.2
8.2
6.7
20.0
4.5
15.2
34.0
23.2
5.2
7.5
11.7
11.6
35.7
10.0
6.6
6.3
5.7
19.1
19.7
4.0
3.5
4.9
3.0
21.1
4.3
50.4
4.9
3.7
5.9
6.6
55.6
9.4
26.1
25.8
2.5
23.6
19.7
11.7
1.6
6.7
4.5
11.6
5.7
3.0
12.1
3.0
9.6
13.7
9.5
3.1
4.2
7.3
6.1
24.0
7.1
4.9
3.6
71.5
7.9
22.6
N/A
15.5
6.6
5.5
18.8
5.6
28.0
8.2
32.3
5.6
11.6
16.3
15.5
13.1
9.3
N/A
25.5
25.4
5.9
20.2
5.2
6.0
9.9
8.3
9.8
6.1
5.8
5.8
27.2
31.0
16.4
27.0
9.5
10.7
9.0
27.6
5.5
5.3
22.0
8.7
20.4
51.5
18.5
14.9
5.3
15.1
5.6
27.4
7.7
54.2
5.3
10.6
13.5
12.6
13.1
9.9
N/A
22.1
19.2
6.2
17.1
5.6
6.0
12.0
9.5
9.3
6.0
5.8
6.1
23.0
18.8
16.5
21.9
10.6
10.0
9.5
21.6
5.4
5.3
11,578
4,734,835
-5.3
-3.4
12,400.4
9,159.8
8.2
7.9
7.1
Source: Bloomberg
Download our reports from Bloomberg: BOCM〈enter〉
–––– 52-week ––––
Hi
Lo
(HK$)
(HK$)
––––––––––– PE –––––––––––
2014A
2015E
2016E
Yield
P/B
(X)
(%)
(X)
18.5
8.6
17.2
15.1
14.0
19.4
5.0
13.8
5.4
24.5
7.1
30.5
5.0
8.2
12.6
11.7
9.8
10.3
N/A
18.7
16.5
7.1
17.3
5.3
5.7
13.4
13.6
8.4
5.5
5.4
5.8
18.7
15.0
14.8
11.3
15.9
9.3
8.9
15.1
5.1
5.0
1.3
5.3
1.1
0.0
4.0
0.4
N/A
0.4
N/A
N/A
2.9
2.4
2.1
3.2
1.1
1.8
2.3
1.0
N/A
1.3
1.2
4.2
N/A
2.7
N/A
4.9
4.9
1.4
4.5
5.7
2.0
N/A
0.9
2.5
0.8
4.7
4.4
1.7
0.7
6.0
N/A
2.3
1.2
2.7
0.7
0.7
0.6
1.0
2.6
1.1
3.6
1.1
0.5
1.1
1.1
2.5
2.6
3.6
1.5
1.0
2.6
2.8
1.1
1.6
0.9
0.8
0.8
1.0
1.1
1.2
1.0
1.1
2.3
2.1
1.1
1.4
1.1
1.9
1.8
1.7
1.0
0.9
4.0
1.2
Morning Express
03 February 2015
BOCOM International
11/F, Man Yee Building, 68 Des Voeux Road, Central, Hong Kong
Main: + 852 3710 3328
Fax: + 852 3798 0133
Rating System
Company Rating
www.bocomgroup.com
Sector Rating
Buy: Expect more than 20% upside in 12 months
LT Buy: Expect more than 20% upside but longer than 12 months
Neutral: Expect low volatility
Sell: Expect more than 20% downside in 12 months
Outperform (“OP”): Expect more than 10% upside in 12 months
Market perform (“MP”): Expect low volatility
Underperform (“UP”): Expect more than 10% downside in 12 months
Research Team
Head of Research
@bocomgroup.com
Raymond CHENG, CFA, CPA, CA
(852) 2977 9393
@bocomgroup.com
raymond.cheng
Strategy
Economics
Hao HONG, CFA
Miaoxian LI
(852) 2977 9384
hao.hong
(852) 2977 9212
yangqingli
Fei WU
(852) 2977 9392
fei.wu
Shanshan LI, CFA
(86) 10 8800 9788 - 8058
lishanshan
Tony LIU
(852) 2977 9390
xutong.liu
Li WAN, CFA
(86) 10 8800 9788 - 8051
Wanli
Banks/Network Financials
Qingli YANG
miaoxian.li
Oil & Gas/ Gas Utilities
Consumer Discretionary
Property
Phoebe WONG
(852) 2977 9391
phoebe.wong
Anita CHU
(852) 2977 9205
anita.chu
Summer WANG
(852) 2977 9221
summer.wang
Shawn WU
(852) 2977 9386
shawn.wu
(852) 2977 9387
milo.liu
Consumer Staples
Alfred LAU, CFA, FRM
(852) 2977 9235
alfred.lau
Luella GUO
(852) 2977 9211
luella.guo
(86) 21 6065 3606
louis.sun
(852) 2977 9209
lizhiwu
(852) 2977 9216
miles.xie
Geoffrey CHENG, CFA
(852) 2977 9380
geoffrey.cheng
Fay ZHOU
(852) 2977 9381
fay.zhou
(86) 21 6065 3675
wei.yao
Renewable Energy
Healthcare
Louis SUN
Telecom & Small/ Mid-Caps
Milo LIU
Insurance & Brokerage
Zhiwu LI
Technology
Jerry LI
(852) 2977 9389
liwenbing
Jennifer ZHANG
(852) 2977 9250
yufan.zhang
Yuan MA, PhD
(86) 10 8800 9788 - 8039
yuan.ma
Connie GU, CPA
(86) 10 8800 9788 - 8045
conniegu
Internet
Miles XIE
Transportation & Industrial
Metals & Mining
Jovi LI
(86) 10 8800 9788 - 8043
Automobile
(852) 2977 9243
jovi.li
Download our reports from Bloomberg: BOCM〈enter〉
Wei YAO
Morning Express
03 February 2015
Analyst Certification
The authors of this report, hereby declare that: (i) all of the views expressed in this report accurately reflect their personal views about any
and all of the subject securities or issuers; and (ii) no part of any of their compensation was, is, or will be directly or indirectly related to the
specific recommendations or views expressed in this report; (iii) no insider information/ non-public price-sensitive information in relation to
the subject securities or issuers which may influence the recommendations were being received by the authors.
The authors of this report further confirm that (i) neither they nor their respective associates (as defined in the Code of Conduct issued by the
Hong Kong Securities and Futures Commission) have dealt in or traded in the stock(s) covered in this research report within 30 calendar days prior
to the date of issue of the report; (ii)) neither they nor their respective associates serve as an officer of any of the Hong Kong listed companies
covered in this report; and (iii) neither they nor their respective associates have any financial interests in the stock(s) covered in this report.
Disclosure of relevant business relationships
BOCOM International Securities Limited, and/or its associated companies, has investment banking relationship with Bank of Communications,
Harbin Bank Co., Ltd., Azure Orbit International Finance Limited, Hanhua Financial Holding Co., Ltd., Central China Securities Company Limited,
China New City Commercial Development Limited, China Shengmu Organic Milk Limited, Broad Greenstate International Company Limited, China
National Culture Group Limited, Sichuan Development Holding Co. Ltd., Austar Lifesciences Limited and BAIC Motor Corporation Limited within
the preceding 12 months.
BOCOM International Holdings Company Limited currently holds more than 1% of the equity securities of Shanghai Fosun Pharmaceuticals Group
Co. Ltd.
BOCOM International Securities Limited currently holds more than 1% of the equity securities of Sanmenxia Tianyuan Aluminum Company Limited.
Disclaimer
By accepting this report (which includes any attachment hereto), the recipient hereof represents and warrants that he is entitled to receive
such report in accordance with the restrictions set forth below and agrees to be bound by the limitations contained herein. Any failure to
comply with these limitations may constitute a violation of law.
This report is strictly confidential and is for private circulation only to clients of BOCOM International Securities Ltd. This report is being
supplied to you strictly on the basis that it will remain confidential. No part of this report may be (i) copied, photocopied, duplicated, stored
or reproduced in any form by any means or (ii) redistributed or passed on, directly or indirectly, to any other person in whole or in part, for
any purpose without the prior written consent of BOCOM International Securities Ltd.
BOCOM International Securities Ltd, its affiliates and related companies, their directors, associates, connected parties and/or employees may own
or have positions in securities of the company(ies) covered in this report or any securities related thereto and may from time to time add to or
dispose of, or may be interested in, any such securities. Further, BOCOM International Securities Ltd, its affiliates and its related companies may
do and seek to do business with the company(ies) covered in this report and may from time to time act as market maker or have assumed an
underwriting commitment in securities of such company(ies), may sell them to or buy them from customers on a principal basis and may also
perform or seek to perform investment banking, advisory, underwriting, financing or other services for or relating to such company(ies) as well as
solicit such investment, advisory, financing or other services from any entity mentioned in this report. In reviewing this report, an investor
should be aware that any or all of the foregoing, among other things, may give rise to real or potential conflicts of interest.
The information contained in this report is prepared from data and sources believed to be correct and reliable at the time of issue of this
report. This report does not purport to contain all the information that a prospective investor may require and may be subject to late
delivery, interruption and interception. BOCOM International Securities Ltd does not make any guarantee, representation or warranty,
express or implied, as to the adequacy, accuracy, completeness, reliability or fairness of any such information and opinion contained in this
report and accordingly, neither BOCOM International Securities Ltd nor any of its affiliates nor its related persons shall not be liable in any
manner whatsoever for any consequences (including but not limited to any direct, indirect or consequential losses, loss of profits and
damages) of any reliance thereon or usage thereof.
This report is general in nature and has been prepared for information purposes only. It is intended for circulation amongst BOCOM
International Securities Ltd’s clients generally and does not have regard to the specific investment objectives, financial situation and the
particular needs of any specific person who may receive this report. The information and opinions in this report are not and should not be
construed or considered as an offer, recommendation or solicitation to buy or sell the subject securities, related investments or other
financial instruments thereof.
The views, recommendations, advice and opinions in this report may not necessarily reflect those of BOCOM International Securities Ltd or
any of its affiliates, and are subject to change without notice. BOCOM International Securities Ltd has no obligation to update its opinion or
the information in this report.
Investors are advised to make their own independent evaluation of the information contained in this research report, consider their own
individual investment objectives, financial situation and particular needs and consult their own professional and financial advisers as to the
legal, business, financial, tax and other aspects before participating in any transaction in respect of the securities of company(ies) covered in
this report. The securities of such company(ies) may not be eligible for sale in all jurisdictions or to all categories of investors.
This report is not directed to, or intended for distribution to or use by, any person or entity who is a citizen or resident of or located in any
locality, state, country or other jurisdiction where such distribution, publication, availability or use would be contrary to any law, regulation,
rule or other registration or licensing requirement.
BOCOM International Securities Ltd is a wholly owned subsidiary of Bank of Communications Co Ltd.
Download our reports from Bloomberg: BOCM〈enter〉
© Copyright 2026