
Weekly Focus
02 February 2015
Contents
Contents ....................................................................................................................................2
Newsflash ..................................................................................................................................3
Market Comment ........................................................................................................................................................... 3
Other Commentators ...................................................................................................................................................... 5
Economic Update .......................................................................................................................7
STANLIB Money Market Fund ....................................................................................................................................... 11
STANLIB Enhanced Yield Fund ...................................................................................................................................... 11
STANLIB Income Fund ................................................................................................................................................... 11
STANLIB Flexible Income Fund...................................................................................................................................... 12
STANLIB Multi-Manager Absolute Income Fund .......................................................................................................... 12
Newsflash
The powerful dollar has laid a heavy hand on the dollar prices of most commodities,
as it usually does.
Market Comment
The US stock market has become temporarily beached after its potent moves over the past few years.
It was down 3.1% in January and is down 4.5% from its record high at end December, trading where it
was back in August last year, before its sharp correction.
Garzarelli (see below) still believes that the correction is unlikely to extend beyond 7% and
recommends buying on the dips.
Meanwhile other markets that didn’t perform as well in 2014 are perking up, such as Europe, Aussie
and our JSE, all three benefiting from a weak currency, while the US is being hurt by a rampant dollar.
The German and French markets gained around 9% in euros last month and the Eurostoxx 50 Index
gained 6.5%. The MSCI Europe Index was in fact flat in dollar terms because the dollar gained 6.7%
against the euro….in one month (January)!!!
Bloomberg reports that money is flowing out of the US stock market into Europe, especially via
Exchange Traded Funds, to take advantage of the weaker currency and cheaper markets, also the
benefits of quantitative easing.
Heck, it is time for other markets to take over the mantle for a while from the US market; give the US
market a breather from its leadership pattern. It has set the bar for others.
In dollar terms, the MSCI Europe Index is still down 13% since June last year.
Meanwhile the MSCI Emerging Markets Index outperformed the MSCI World Index by 2.5% in dollar
terms in January, bouncing from a trouncing last year (underperformed by 7.3% last year).
One of the strongest markets in the Emerging Markets space has been the biggest one, namely MSCI
China (22% of the MSCI EM Index), up 2.3% in dollar terms in January and is recommended by BCA and
other commentators.
Otherwise, emerging markets may need a decent bounce in commodity prices to continue their
outperformance.
The biggest commodity of them all - oil - has suddenly bounced about 7% from its recent lows (on
concerns of falling production) and is trading back over $51 today. Also, the massive jump in the dollar
(+19% versus the euro) has quietened down over the past week, giving some hope that the dollar could
possibly be in for a long overdue correction, which in turn could help commodity prices bounce…and
mining shares.
The powerful dollar has laid a heavy hand on the dollar prices of most commodities, as it usually does.
Already Sasol, in rands, has gained 18.5% from its low two weeks ago. Could something similar happen
to BHP, Anglo and others, even if it is just a bounce in an ongoing bear market?
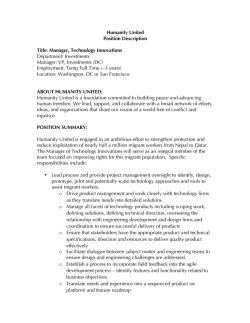
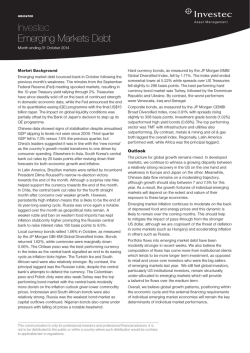
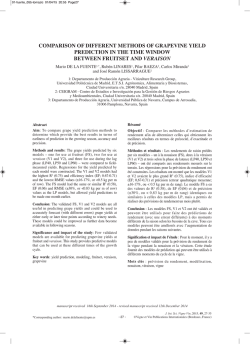
Put it this way, it could certainly help the JSE All Share Index, now up 3.1% in 2015 (total return
including dividends) - and up 2.9% last week. See the chart below of the ALSI.
The JSE battled to make any headway for about 3 months after the sharp correction in September and
October, but does seem to be gaining traction now, breaking out of its consolidation pattern and shortterm down-trend.
A new record high, the first since late July, could be in the offing quite soon, judging by the chart.
Of course, the weaker rand AND R4 fall (-28%) in our petrol price (as of midnight tomorrow) are
helping, as is the sharp slide in our 10-year bond yield (the so-called “risk free” rate used to discount
future earnings back to the present) and the view that interest rates may be on hold for much of 2015
too.
Source: I-Net Bridge
So far the JSE Financial & Industrial Index is up 3.5% in 2015, trading at a new record high, thereby
extending its six year old bull market, while the JSE Resources Index is up 2.5% and seems to be shaping
up for a bounce from very depressed levels, judging by the shape of its chart.
STANLIB and most SA fund managers see the JSE as overpriced/expensive, especially Industrial shares.
STANLIB is anticipating a return of about zero for our market in 2015 and of course the risk or
probability of a negative return in 2015 is the highest it has been since the bull market started, which is
natural after a 6 year bull market.
So…one needs to balance that with the knowledge that the bull market remains, for now, intact (except
for Mining shares) and that it is unlikely to end until the US market’s bull-trend ends.
How should financial advisors and investors handle this dilemma?
Mix and match is probably the way to go. For example, move retirement funds like RA’s or
pension/provident funds into more cautious, more conservative funds with lower exposure to the stock
market, but sufficient to enable them to equal or beat inflation; but keep a higher exposure outside of
one’s pension/provident funds, if feasible from a risk point of view.
In his book “Money: Master the Game”, top US Lifestyle expert Anthony Robbins, whose seminars I
attended with great enthusiasm when I lived in the US in the 1980’s and early 1990’s, outlines the
long-term virtually bullet-proof all-weather portfolio recommended by famous hedge fund manager,
Ray Dalio.
This portfolio, with a maximum loss of some 3.5% over the past 75 years, through many different
crashes, is 30% equities, 7.5% gold, 7.5% commodities and 55% in government bonds; of course the
portfolio would have benefited from the bull market in government bonds that has lasted all of 34
years and some caution is called for now, with yields so incredibly low, even though they could go
lower (prices higher).
But the point is that an exposure of 30% or so to equities makes a lot of sense for lower risk investors at
this time.
In the month of January the SA All Bond Index returned a phenomenal 6.5%, as bond yields fell sharply.
The R186 11/12 year bond yield fell from 7.96% at end 2014 to 7.12% at end January, causing the
bond’s price to rise nicely.
As a result of this fall in bond yields, the SA Listed Property index shot up by 7.4%, including dividends.
There could possibly be more to come, judging by the new record low in the US 30-year bond yield,
down from 2.75% at end 2014 to 2.24% at end January, causing the price to rise. This bond returned
over 25% last year.
Likewise the German 10-year bond yield fell from 0.54% at end December to 0.31% now, causing its
price/value to appreciate too. Last year this bond returned an absolutely amazing 38%.
Of course, if the oil price rallies strongly, bond yields may rise a bit.
Other Commentators
US MARKET ANALYST, ELAINE GARZARELLI
She says the S&P 500 Index is down 4.6% (5% at its worst intra-day) and she recommends buying into
the dips.
Her quants system reading is still a bullish 64.5%. The decline in US shares is due to earnings
disappointments, the strong dollar and lower oil prices.
She has lowered her earnings forecast for 2015 by about 4-5% - and therefore target for the market;
she now expects earnings to grow by 8.2% (down from about 12%), with a fair value target for the S&P
500 Index of 2222, an 11.4% gain from here.
BCA RESEARCH
BCA’s quantitative tactical asset allocation model marginally reduced its exposure to equities to 90% at
end January, from 92% before BUT noted that the risk index for equities in in “low-risk” territory!!
The allocation to US equities was heavily down-weighted from 27% to 8%, suggesting better riskadjusted returns elsewhere, while Japan was increased from 6% to 10%, Italy from 6% to 11% and Spain
from 8% to 12%; so Europe was up-weighted from 42% to 49% of equities.
Emerging Asian equities were up-weighted from 2% to 9%.
Bonds were up-weighted from 8% to 10%, although global bonds look pricey and extremely overbought
too, suggesting a possible tactical sell-off in coming weeks.
Interestingly, US government bonds are not as expensive as global bonds, nor as overbought.
The quants model suggests that the US dollar could be heading for a transient period of weakness in
the coming weeks; put it this way, the probability of this happening is now quite high.
On the fundamental research front, BCA remains cautious on a 3-6 month horizon towards US risk
assets, although they remain positive over 6-12 months.
The odds are on the Fed delaying hiking rates until 2016, although BCA’s base case is for the first hike
near the end of 2015.
BCA recommends buying Greek shares as a highly speculative trade. Greek shares are down 60% over
the 10 months.
Greek unit labour costs have fallen over 15% in the past 4 years and are now lower than the European
average. Also the Greek government has actually cut spending (excluding interest on loans) by 25%
more than it originally agreed to in 2010.
Greece’s primary (i.e. before accounting for interest paid) budget has gone from a deficit of 10.5% of
GDP in 2009 to a surplus of 1.5% in 2013 and 2014. This surplus could rise to 3% of GDP this year, per
the IMF.
So…the Greek government is generating more tax revenue than it is spending on its operations, before
accounting for interest paid on loans.
BCA expects that Greece will stay in the Eurozone via a compromise with the Troika and this would be
good for Greek shares and bonds.
BCA suspects that the oil price has not yet bottomed.
Paul Hansen
Director: Retail Investing
Economic Update
1. SA Reserve Bank left interest rates unchanged with significant focus on global circumstances,
especially the lower oil price.
2. SA credit growth slowed in December 2014, largely due to seasonal factors.
3. SA recorded a welcome trade surplus in December 2014 of R6.84bn.
4. SA petrol price to fall by a further 93c/l on Wednesday, 4 February.
5. US GDP grew by a relatively modest 2.6%q/q in the final quarter of 2014, hurt by an increase in
imports and a fall-off in defence activity.
6. Kenya inflation rate lower than expected.
7. Zambia inflation benefits from lower oil prices
1. The South African Reserve Bank opted to leave the Repo rate unchanged at 5.75% at its MPC meeting
last week. The Reserve Bank last adjusted interest rates on 18 September 2014, when they increased
rates by 25bps. The prime interest rate should remain unchanged at 9.25%. According to the MPC
statement, the decision to keep rates unchanged was unanimous. Overall, while the MPC decision was
in-line with expectations the Governor provided significant clarity on the outlook for SA interest rates.
It seems clear that interest rates will remain on-hold for a number of months at least, despite the
forecast sharp decline in headline inflation, unless underlying inflation (core inflation) falls
meaningfully. In addition, interest rates will also not be cut further in an effort to boost economic
growth. This is largely because the constraints on SA growth are unrelated to the level of interest rates.
Furthermore, the inflation benefit of the lower oil price is expected to be relatively temporary. Instead,
the outlook for interest rates is more dependent on the Rand exchange rate coupled with the path of
global interest rates, especially US interest rates, and South Africa’s ability to continue to fund the
current account deficit. This would suggest that SA interest rates are likely to remain on-hold for most
of this year, but with the possibility of a further hike late in 2015.
2. In December 2014, SA growth in broad money supply (M3) was recorded at a mere 7.4%y/y, down
from a growth rate of 8.3%y/y in November 2014. Over the past year, the overall growth in money
supply continues to drift mostly sideways, and is very modest within the context of an inflation target
of 3% to 6%. Conceptually, it is difficult for inflation to move structurally higher given the sustained low
growth in money supply.
Private sector credit fell by R5.65bn (-0.2%m/m) in December 2014, after increasing by a very
substantial R29.8bn (1.1%m/m) in November 2014. The monthly breakdown of credit growth shows
that consumer credit remains extremely subdued, especially unsecured credit to households, after the
flurry of lending in the preceding two years. Mortgage credit, which is the largest component of private
sector credit, rose by only R1.98 billion in December 2014, or 0.2%m/m. On an annual basis mortgage
credit is up 4.3%y/y. This is extremely modest growth, but the highest annual rate of expansion in
mortgages since November 2010. Hopefully the growth in mortgage activity improves over the coming
year helped by still relatively low interest rates, and pend-up demand; there is some evidence of a
steady improvement in residential building plans based. Consumer credit increased by a total of R2.7
billion in December 2014. The latest data on unsecured credit, in particular personal loans, shows that
this element of credit remains extremely subdued. Over the past year, consumer credit has risen by a
mere 3.4%y/y, which is the lowest annual rate of growth since January 2010. Corporate credit declined
by a fairly substantial R13.675 billion or 1.1%m/m (this excludes changes in bills discounted as well as
the investments category) in December 2014. The annual rate of growth remained relatively high at
13.5%y/y, although well down from a recent peak of 17.0%y/y in July 2014.
Corporate activity has been the main credit stimulus in South Africa over the past year, and appears to
reflect a range of factors including commercial property development, the growth in renewal energy
projects, the funding of agricultural activity and the local funding of increased business activity in the
rest of Africa. Unfortunately, the growth in corporate credit does not reflect a pick-up in private sector
fixed investment activity. The annual rate of growth in corporate credit is expected to slow somewhat
over the coming year, given the relatively high base and the lack of capacity expansion within South
Africa’s business sector.
Overall, the rate of expansion in total private sector credit remains modest with a very slight upward
bias developing in the mortgage market. This will not pose any inflation concerns for the Reserve Bank
at this stage of the business cycle.
3. In December 2014, South Africa’s trade balance recorded a much needed surplus R6.848bn. This
compares with a trade deficit of –R5.3bn in November 2014 and a deficit in each of preceding nine
months. The improvement in the trade deficit reflects a sharp decline in imports, coupled with a
welcome pick-up in exports. During December 2014, the value of exports rose by 3.8%m/m (R3.2bn.
South Africa’s exports to the rest of Africa remain encouraging, growing by 13.5% in 2014 compared
with 2013. This makes the rest of Africa, South Africa’s fastest growing export destination and the
second largest export destination (by a narrow margin) after Asia. The latest trade data is much more
encouraging relatively to prior months, although SA’s trade data normally improves each December.
Hopefully, systematically higher world growth, coupled with some improvement in SA labour market
conditions (especially in the mining and motor industries), should help lift SA’s export performance
over the coming 12 to 24 months. Unfortunately, this progress is likely to be slow and relatively
moderate. Equally, given the general weakness in the domestic economy (especially the lack of fixed
investment activity), it is logical to expect import demand to ease somewhat over the coming months;
or at least stagnate relatively to the level of imports a year-ago. This slowdown in imports will depend
heavily on the oil price as well as the timing and strength of South Africa’s promised pick-up in
infrastructural investment. This implies that South Africa’s current account deficit should improve in
2015. Unfortunately, the extent of the improvement is likely to be relatively modest given the still high
propensity to import, meaning South Africa remains highly dependent on foreign capital inflows to stop
the Rand weakening further.
4. The Department of Energy announced that the petrol price (all grades) will decrease by a very
impressive and welcome 93c/l with effect from Wednesday, 4 February 2015. This means that the
price of 95 Octane (ULP, Gauteng) will now cost R10.31 per litre, which is the lowest petrol price since
September 2011. The price of diesel will decrease by an even more impressive 102c/l, while the price of
paraffin will decline by 136c /l (retail price), and gas by 150c/kg. This is the sixth consecutive monthly
decline in the fuel price. Since peaking at R14.33/l in August, the SA petrol price has declined by a total
of R4.02/l or 28.1%. The latest reduction in the fuel price is entirely due to the lower international oil
price. In fact, on its own the lower oil price would have resulted in the SA petrol price falling by 96c/l in
February 2015. Unfortunately, the average R/$ exchange rate weakened somewhat during January
2015, which added 4c/l to the petrol price calculation.
Crucially, the very recent rise in the oil price, coupled with a still weak exchange rate means that the
petrol price will, most likely, quickly move into an under-recovery position in February once the petrol
price reduction occurs on Wednesday. This could easily start to unwind some of the recent petrol price
benefits. The decrease in the SA petrol price in February 2015 will have a fairly significant impact on
the inflation rate, reducing the monthly inflation rate by a further 0.5 percentage points. The impact of
the sharply lower petrol price during the past 6 months, should push SA inflation down dramatically to
around 3.5% in May 2015. It will also significantly boost consumer spending over the coming months.
For example a 70 litre tank of petrol would have cost R1 003 to fill in August 2014.
This has now declined to R721, a drop of R282 per tank. Assuming someone fills their petrol tank twice
a month, the monthly saving would be R564, which is fairly substantial relative to most people’s
monthly income. Unfortunately, the direct benefit of the lower oil price is likely to occur only to those
individuals that drive a car on a regular basis since there is no indication that taxi fares or the cost of
public transport will be reduced. Looking a little further-out, the benefit of the lower petrol price could
be partially offset by a likely increase in SA taxes during the February’s National Budget. In addition, the
cost of electricity is scheduled to rise by almost 13% in the middle of the year, which will also dent the
oil price benefit. Fortunately, SA interest rates are expected to remain unchanged for most of this year.
Overall, although the petrol price windfall in the past few months has been spectacular and should
provide a welcome boost to the SA economy over the coming months, much of these gains are likely to
dissipate as the year progresses.
5. In the final quarter of 2014, US GDP grew by a relatively modest 2.6%q/q, annualised. This compares
with very robust growth of 5.0%q/q in Q2 2014 and 4.6%q/q in Q2 2014. The key areas of strength in
Q4 2014 were personal consumption expenditures (especially healthcare), inventory accumulation and
exports. These contributions were partly offset by a sharp increase in imports and a fall-off in defense
activity. For 2014 as a whole the US economy grew by 2.4%. The US economy is forecast to grow by
3.2% in 2015. This GDP estimate represents an initial assessment of US economic activity in Q4 2013,
and is based on source data that are incomplete or subject to further revision. The "second" estimate for
the fourth quarter of 2014, based on more complete data, will be released on 27 February 2015. The
change in real private inventories added a very substantial 0.82 percentage point to the fourth quarter
real GDP growth rate. This means real final sales of domestic product, which is GDP less change in
private inventories, increased by a very modest 1.8% in the fourth quarter, compared with an increase
rise of 5.0% in the third quarter. Encouragingly, real disposable personal income increased by 3.8%q/q
in the final quarter of 2014, up from growth of 2.0%q/q in Q3 2014. The improvement in personal
income primarily reflected some increase in salaries and wages and in proprietors’ income.
Overall, there is enough evidence to suggest that economic activity is likely to continue to improve
and that the US GDP growth in 2015 will be somewhat higher than in 2014. However, there remains
some doubt that the US economy can accelerate growth meaningfully in 2015. This is partly due to
the ongoing strength of the Dollar, coupled with the fact that salary increases remain extremely
modest by historical standards. Although the rapid increase in the production of natural gas clearly
helped to boost the economy, the recent sharp fall-off in the oil price could materially dampen this
benefit. Fortunately, the sharply lower gasoline price will help, while the most recent drag from fiscal
policy should fade. Critically, in order for US economic growth to breach 3.5% GDP growth on a
sustainable basis there needs to be a step change in job creation, probably to an average monthly job
gain of over 300 000 (job growth averaged 246 000 a month in 2014), coupled with wage increases
consistently above 2.5%y/y, (currently still below 2.0%y/y).
6. Inflation in Kenya came in at a lower than expected 5.5% in January 2015, which was meaningfully
lower than the 6.0% recorded in December 2014, and is the lowest it has been since June 2013. This
was as a result of lower transport and electricity prices. Fuel prices have been on the decline due to
sharp fall in oil prices, while electricity prices have benefited from the cheaper (and cleaner)
geothermal power. Most of the upward pressure came from Food & Non-Alcoholic Beverages, the
biggest category in the CPI basket, which recorded an annual price increase of 7.7%. This gives the
Central Bank of Kenya more space to cut rates, however the dip in inflation could be limited to the first
half of the year, which could make the bank reluctant to cut.
7. Zambian inflation recorded its lowest increase since March 2013. Inflation was measured at 7.7% in
January 2015, down from 7.9% in December 2014. Food and transport inflation fell sharply. There was
a concern that the weaker exchange rate, which was the second worst performer on the continent
after Ghana, would push inflation up. Fortunately, this has not transpired. The lower commodity prices
are not all good news for the economy. In particular, Zambia is a major exporter of copper. Copper
prices have fallen by more than 21% since their peak last year and expected to hurt export revenue.
This could undermine the growth outlook for Zambia in 2015.
Please follow our regular economic updates on twitter @lingskevin
Kevin Lings, Laura Jones & Kganya Kgare
(STANLIB Economics Team)
Rates
These rates are expressed in nominal and effective terms and should be used for indication purposes ONLY.
STANLIB Money Market Fund
Nominal:
6.16% per annum
Effective:
6.33% per annum
STANLIB is required to quote an effective rate which is based upon a seven-day rolling average yield for Money
Market Portfolios. The above quoted yield is calculated using an annualised seven-day rolling average as at 31 January
2015. This seven- day rolling average yield may marginally differ from the actual daily distribution and should not be
used for interest calculation purposes. We however, are most happy to supply you with the daily distribution rate on
request, one day in arrears. The price of each participatory interest (unit) is aimed at a constant value. The total return
to the investor is primarily made up of interest received but, may also include any gain or loss made on any particular
instrument. In most cases this will merely have the effect of increasing or decreasing the daily yield, but in an extreme
case it can have the effect of reducing the capital value of the portfolio.
STANLIB Enhanced Yield Fund
Effective Yield:
6.45%
STANLIB is required to quote a current yield for Income Portfolios. This is an effective yield. The above quoted yield
will vary from day to day and is a current yield as at 31 January 2015. The net (after fees) yield on the portfolio will be
published daily in the major newspapers together with the “all-in” NAV price (includes the accrual for dividends and
interest). This yield is a snapshot yield that reflects the weighted average running yield of all the underlying holdings
of the portfolio. Monthly distributions will consist of dividends and interest. Interest will also be exempt from tax to
the extent that investor’s are able to make use of the applicable interest exemption as currently allowed by the
Income Tax Act. The portfolio’s underlying investments will determine the split between dividends and interest.
STANLIB Income Fund
Effective Yield:
7.29%
Collective Investment Schemes in Securities (CIS) are generally medium to long term investments. The value of
participatory interests may go down as well as up and past performance is not necessarily a guide to the future. A
schedule of fees and charges and maximum commissions is available on request from the company/scheme. CIS can
engage in borrowing and scrip lending. Commission and incentives may be paid and if so, would be included in the
overall costs.” The above quoted yield will vary from day to day and is a current yield as at 31 January 2015.
STANLIB Extra Income Fund
Effective Yield:
6.77%
Collective Investment Schemes in Securities (CIS) are generally medium to long term investments. The value of
participatory interests may go down as well as up and past performance is not necessarily a guide to the future. A
schedule of fees and charges and maximum commissions is available on request from the company/scheme. CIS can
engage in borrowing and scrip lending. Commission and incentives may be paid and if so, would be included in the
overall costs.
Fluctuations or movements in exchange rates may cause the value of underlying international investments to go up or
down.” The above quoted yield will vary from day to day and is a current yield as at 31 January 2015.
STANLIB Flexible Income Fund
Effective Yield:
6.82%
Collective Investment Schemes in Securities (CIS) are generally medium to long term investments. The value of
participatory interests may go down as well as up and past performance is not necessarily a guide to the future. A
schedule of fees and charges and maximum commissions is available on request from the company/scheme. CIS can
engage in borrowing and scrip lending. Commission and incentives may be paid and if so, would be included in the
overall costs.” The above quoted yield will vary from day to day and is a current yield as at 31 January 2015.
STANLIB Multi-Manager Absolute Income Fund
Effective Yield:
5.49%
Collective Investment Schemes in Securities (CIS) are generally medium to long term investments. The value of
participatory interests may go down as well as up and past performance is not necessarily a guide to the future. A
schedule of fees and charges and maximum commissions is available on request from the company/scheme. CIS can
engage in borrowing and scrip lending. Commission and incentives may be paid and if so, would be included in the
overall costs.” The above quoted yield will vary from day to day and is a current yield as at 31 January 2015.
Glossary of terminology
Bonds
A bond is an interest-bearing debt instrument, traditionally issued by governments as part of
their budget funding sources, and now also issued by local authorities (municipalities),
parastatals (Eskom) and companies. Bonds issued by the central government are often
called “gilts”. Bond issuers pay interest (called the “coupon”) to the bondholder every 6
months. The price/value of a bond has an inverse relationship to the prevailing interest rate,
so if the interest rate goes up, the value goes down, and vice versa. Bonds/gilts generally
have a lower risk than shares because the holder of a gilt has the security of knowing that
the gilt will be repaid in full by government or semi-government authorities at a specific
time in the future. An investment in this type of asset should be viewed with a 3 to 6 year
horizon.
Cash
An investment in cash usually refers to a savings or fixed-deposit account with a bank, or to
a money market investment. Cash is generally regarded as the safest investment. Whilst it is
theoretically possible to make a capital loss investing in cash, it is highly unlikely. An
investment in this type of asset should be viewed with a 1 to 3 year horizon.
Collective
Investments
Collective investments are investments in which investors‟ funds are pooled and managed
by professional managers. Investing in shares has traditionally yielded unrivalled returns,
offering investors the opportunity to build real wealth. Yet, the large amounts of money
required to purchase these shares is often out of reach of smaller investors. The pooling of
investors’ funds makes collective investments the ideal option, providing cost effective
access to the world’s stock markets. This is why investing in collective investments has
become so popular the world over and is considered a sound financial move by most
investors.
Compound Interest
Compound interest refers to the interest earned on interest that was earned earlier and
credited to the capital amount. For example, if you deposit R1 000 in a bank account at 10%
and interest is calculated annually; your balance will be R1 100 at the end of the first year
and R1 210 at the end of the second year. That extra R10, which was earned on the interest
from the first year, is the result of compound interest ("interest on interest"). Interest can
also be compounded on a monthly, quarterly, half-yearly or other basis.
Dividend Yields
The dividend yield is a financial ratio that shows how much a company pays out in dividends
each year relative to its share price. The higher the yield, the more money you will get back
on your investment.
Dividends
When you buy equities offered by a company, you are effectively buying a portion of the
company. Dividends are an investor’s share of a company’s profits, given to him or her as a
part-owner of the company.
Earnings per share
Earnings per share is a measure of how much money the company has available for
distribution to shareholders. A company’s earnings per share is a good indication of its
profitability and is generally considered to be the most important variable in determining a
company’s share price.
Equity
A share represents an institution/individual’s ownership in a listed company and is the
vehicle through which they are able to “share” in the profits made by that company. As the
company grows, and the expectation of improved profits increases, the market price of the
share will increase and this translates into a capital gain for the shareholder. Similarly,
negative sentiment about the company will result in the share price falling. Shares/equities
are usually considered to have the potential for the highest return of all the investment
classes, but with a higher level of risk i.e. share investments have the most volatile returns
over the short term. An investment in this type of asset should be viewed with a 7 to 10 year
horizon.
Financial Markets
Financial markets are the institutional arrangements and conventions that exist for the issue
and trading of financial instruments.
Fixed Interest Funds
Fixed interest funds invest in bonds, fixed-interest and money market instruments. Interest
income is a feature of these funds and, in general, capital should remain stable.
Gross Domestic
Product (GDP)
The Gross Domestic Product measures the total volume of goods and services produced in
the economy. Therefore, the percentage change in the GDP from year to year reflects the
country's annual economic growth rate.
Growth Funds
Growth funds seek maximum capital appreciation by investing in rapidly growing companies
across all sectors of the JSE. Growth companies are those whose profits are in a strong
upward trend, or are expected to grow strongly, and which normally trade at a higher-thanaverage price/earnings ratio.
Industrial Funds
Industrial funds invest in selected industrial companies listed on the JSE, but excluding all
companies listed in the resources and financial economic groups.
Investment Portfolio
An investment portfolio is a collection of securities owned by an individual or institution
(such as a collective investment scheme). A funds‛ portfolio may include a combination of
financial instruments such as bonds, equities, money market securities, etc. The theory is
that the investments should be spread over a range of options in order to diversify and
spread risk.
JSE Securities
Exchange
The primary role of the JSE Securities Exchange is to provide a market where securities can
be freely traded under regulated procedures.
Price to earnings
ratio
Price to earnings ratio or p: e ratio is calculated by dividing the price per share by the
earnings per share. This ratio provides a better indication of the value of a share, than the
market price alone. For example, all things being equal, a R10 share with a P/E of 75 is much
more “expensive” than a R100 share with a P/E of 20.
Property
Property has some attributes of shares and some attributes of bonds. Property yields are
normally stable and predictable because they comprise many contractual leases. These
leases generate rental income that is passed through to investors. Property share prices
however fluctuate with supply and demand and are counter cyclical to the interest rate
cycle. Property is an excellent inflation hedge as rentals escalate with inflation, ensuring
distribution growth, and property values escalate with inflation ensuring net asset value
growth. This ensures real returns over the long term.
Resources and Basic
Industries Funds
These funds seek capital appreciation by investing in the shares of companies whose main
business operations involve the exploration, mining, distribution and processing of metals,
minerals, energy, chemicals, forestry and other natural resources, or where at least 50
percent of their earnings are derived from such business activities, and excludes service
providers to these companies.
Smaller Companies
Funds
Smaller Companies Funds seek maximum capital appreciation by investing in both
established smaller companies and emerging companies. At least 75 percent of the fund
must be invested in small- to mid-cap shares which fall outside of the top 40 JSE-listed
companies by market capitalisation.
Value Funds
These funds aim to deliver medium- to long-term capital appreciation by investing in value
shares with low price/earnings ratios and shares which trade at a discount to their net asset
value.
Growth Funds
Growth funds seek maximum capital appreciation by investing in rapidly growing companies
across all sectors of the JSE. Growth companies are those whose profits are in a strong
upward trend, or are expected to grow strongly, and which normally trade at a higher-thanaverage price/earnings ratio.
Sources: Unit Trust and Collective Investments (September 2007), The Financial Sector Charter Council, Personal Finance (30 November 2002),
Introduction to Financial Markets, Personal Finance, Quarter 4 2007, Investopedia (www.investopedia.com) and The South African Financial
Planning Handbook 2004.
Disclaimer
The price of each unit of a domestic money market portfolio is aimed at a constant value. The total return to the investor is primarily made up of
interest received but, may also include any gain or loss made on any particular instrument. In most cases this will merely have the effect of
increasing or decreasing the daily yield, but in an extreme case it can have the effect of reducing the capital value of the portfolio. Collective
Investment Schemes in Securities (CIS) are generally medium to long term investments. The value of participatory interests may go down as well as
up and past performance is not necessarily a guide to the future. An investment in the participations of a CIS in securities is not the same as a
deposit with a banking institution. CIS are traded at ruling prices and can engage in borrowing and scrip lending. A schedule of fees and charges and
maximum commissions is available on request from STANLIB Collective Investments Ltd (the Manager). Commission and incentives may be paid and
if so, would be included in the overall costs. A fund of funds is a portfolio that invests in portfolios of collective investment schemes, which levy
their own charges, which could result in a higher fee structure for these portfolios. Forward pricing is used. Fluctuations or movements in exchange
rates may cause the value of underlying international investments to go up or down. TER is the annualised percent of the average Net Asset Value
of the portfolio incurred as charges, levies and fees. A higher TER ratio does not necessarily imply a poor return, nor does a low TER imply a good
return. The current TER cannot be regarded as an indication of future TERs. Portfolios are valued on a daily basis at 15h30. Investments and
repurchases will receive the price of the same day if received prior to 15h30. Liberty is a full member of the Association for Savings and Investments
of South Africa. The Manager is a member of the Liberty Group of Companies.
As neither STANLIB Wealth Management Limited nor its representatives did a full needs analysis in respect of a particular investor, the investor
understands that there may be limitations on the appropriateness of any information in this document with regard to the investor’s unique
objectives, financial situation and particular needs. The information and content of this document are intended to be for information purposes only
and STANLIB does not guarantee the suitability or potential value of any information contained herein. STANLIB Wealth Management Limited does
not expressly or by implication propose that the products or services offered in this document are appropriate to the particular investment
objectives or needs of any existing or prospective client. Potential investors are advised to seek independent advice from an authorized financial
adviser in this regard. STANLIB Wealth Management Limited is an authorised Financial Services Provider in terms of the Financial Advisory and
Intermediary Services Act 37 of 2002 (Licence No. 26/10/590)
Compliance No.: H241X4
17 Melrose Boulevard, Melrose Arch, 2196
P O Box 202, Melrose Arch, 2076
T 0860123 003 (SA Only)
T+27(0)11 448 6000
E [email protected]
Website www.stanlib.com
STANLIB Wealth Management Limited
Reg. No. 1996/005412/06
Authorised FSP in terms of the FAIS Act, 2002 (Licence
No. 26/10/590)
STANLIB Collective Investments Limited
Reg. No. 1969/003468/06
© Copyright 2026