
Final Revised Paper - Atmospheric Chemistry and Physics
Atmos. Chem. Phys., 15, 973–990, 2015 www.atmos-chem-phys.net/15/973/2015/ doi:10.5194/acp-15-973-2015 © Author(s) 2015. CC Attribution 3.0 License. Influence of aerosol chemical composition on N2O5 uptake: airborne regional measurements in northwestern Europe W. T. Morgan1 , B. Ouyang2 , J. D. Allan1,3 , E. Aruffo4 , P. Di Carlo4 , O. J. Kennedy2 , D. Lowe1 , M. J. Flynn1 , P. D. Rosenberg5 , P. I. Williams1,3 , R. Jones2 , G. B. McFiggans1 , and H. Coe1 1 School of Earth, Atmospheric & Environmental Sciences, University of Manchester, Manchester, UK of Chemistry, University of Cambridge, Cambridge, UK 3 National Centre for Atmospheric Science, University of Manchester, Manchester, UK 4 CETEMPS – Dipartimento di Fisica, Universita di L’Aquila, L’Aquila, Italy 5 School of Earth & Environment, University of Leeds, Leeds, UK 2 Department Correspondence to: W. T. Morgan ([email protected]) Received: 30 June 2014 – Published in Atmos. Chem. Phys. Discuss.: 30 July 2014 Revised: 3 December 2014 – Accepted: 23 December 2014 – Published: 28 January 2015 Abstract. Aerosol chemical composition was found to influence nighttime atmospheric chemistry during a series of airborne measurements in northwestern Europe in summer conditions, which has implications for regional air quality and climate. The uptake of dinitrogen pentoxide, γ (N2 O5 ), to particle surfaces was found to be modulated by the amount of water content and ammonium nitrate present in the aerosol. The conditions prevalent in this study suggest that the net uptake rate of N2 O5 to atmospheric aerosols was relatively efficient compared to previous studies, with γ (N2 O5 ) values in the range 0.01–0.03. This is likely a consequence of the elevated relative humidity in the region, which promotes greater aerosol water content. Increased nitrate concentrations relative to particulate water were found to suppress N2 O5 uptake. The results presented here contrast with previous ambient studies of N2 O5 uptake, which have generally taken place in low-nitrate environments in the USA. Comparison of the N2 O5 uptake derived from the measurements with a parameterised scheme that is based on the ratio of particulate water to nitrate yielded reasonably good agreement in terms of the magnitude and variation in uptake, provided the effect of chloride was neglected. An additional suppression of the parameterised uptake is likely required to fully capture the variation in N2 O5 uptake, which could be achieved via the known suppression by organic aerosol. However, existing parameterisations representing the suppression by organic aerosol were unable to fully represent the variation in N2 O5 uptake. These results provide important ambient measurement con- straint on our ability to predict N2 O5 uptake in regional and global aerosol models. N2 O5 uptake is a potentially important source of nitrate aerosol and a sink of the nitrate radical, which is the main nocturnal oxidant in the atmosphere. The results further highlight the importance of ammonium nitrate in northwestern Europe as a key component of atmospheric composition in the region. 1 Introduction Aerosols play an important role in nighttime atmospheric chemistry, as they provide an effective sink for reactive oxidised nitrogen via the uptake of N2 O5 to particle surfaces (e.g. Chang et al., 2011). During nighttime, N2 O5 maintains an equilibrium with the nitrate radical, NO3 (e.g. Wayne et al., 1991). NO3 serves as one of the most chemically important species in the nocturnal atmosphere by acting as the main oxidant (e.g. Brown and Stutz, 2012). Atmospheric aerosols can serve as an indirect loss of NO3 , via heterogeneous uptake of N2 O5 to their surfaces, resulting in its removal from the gas phase: NO2 + O3 → NO3 + O2 (R1) NO3 + NO2 → N2 O5 (R2) N2 O5 → NO2 + NO3 (R3) N2 O5 + H2 O(het) → 2HNO3 (R4) Net: 2NO2 + O3 + H2 O(het) → 2HNO3 + O2 . (R5) Published by Copernicus Publications on behalf of the European Geosciences Union. 974 W. T. Morgan et al.: Influence of aerosol chemical composition on N2 O5 uptake The hydrolysis reaction between N2 O5 and H2 O (Reaction R4) is very slow in the gas phase, while being far more rapid via heterogeneous uptake to aerosol particles (e.g. Dentener and Crutzen, 1993). Consequently, this has implications for the lifetime of reactive oxidised nitrogen in the nighttime atmosphere, which can impact photochemical reactions involving ozone the following day. Under low-NOx conditions, heterogeneous uptake of N2 O5 leads to a decrease in ozone production but owing to the non-linear relationship in the NOx –O3 system, ozone production increases under highNOx conditions (Riemer et al., 2003). Furthermore, N2 O5 uptake results in the formation of nitric acid, which can potentially lead to the formation of significant amounts of nitrate aerosol (e.g. Riemer et al., 2003). Heterogeneous uptake of N2 O5 can therefore influence regional air quality via modification of ozone and aerosol production rates, both of which have deleterious effects on human health (e.g. Monks et al., 2009). Additionally, these species perturb the radiative balance of the climate system (e.g. Boucher et al., 2013). An increase in nitrate aerosol species has consequences for the aerosol direct effect via additional scattering of incoming solar radiation (e.g. Charlson et al., 1992), particularly given its affinity for water uptake (Morgan et al., 2010a), as well as altering the microphysical properties of clouds (e.g. Haywood and Boucher, 2000). Such impacts have profound consequences on the climate system and greater understanding of how these processes occur is required. The heterogeneous uptake of N2 O5 is known to be highly modulated by aerosol chemical composition. In order to assess the level of uptake of N2 O5 to aerosol particles, a reaction probability is used that defines the fraction of gas– particle collisions that results in net-removal of N2 O5 from the gas phase (e.g. Bertram and Thornton, 2009). Several laboratory and ambient studies have sought to quantify the net N2 O5 uptake rate, γ (N2 O5 ), while attempting to attribute changes in its magnitude with aerosol chemical composition and other atmospheric variables. Acidic sulfate containing particles have been shown to promote uptake in both the laboratory (e.g. Mozurkewich and Calvert, 1988) and during airborne measurements in the northeastern USA (Brown et al., 2006). Chloride containing species have also been shown to enhance uptake, which results in the formation of ClNO2 (Osthoff et al., 2008; Bertram and Thornton, 2009). Pure water droplets have also been shown to be effective for heterogeneous reactions, with γ (N2 O5 ) ranging from 0.04–0.06 with an inverse relationship with temperature (Van Doren et al., 1990). Several laboratory studies (e.g. Wahner et al., 1998; Mentel et al., 1999; Griffiths et al., 2009; Bertram and Thornton, 2009) have demonstrated a suppression in γ (N2 O5 ) by nitrate-containing aerosols. This “nitrate effect” was shown to lower uptake by approximately an order of magnitude when comparing reactions involving NaNO3 with NaSO4 (Wahner et al., 1998; Mentel et al., 1999) and has subsequently received supporting evidence in the ambiAtmos. Chem. Phys., 15, 973–990, 2015 ent atmosphere based on measurements in California, USA (Riedel et al., 2012) and Colorado, USA (Wagner et al., 2013). Various laboratory experiments have shown that organic aerosol species suppress γ (N2 O5 ) (Brown and Stutz, 2012, and references therein), with a strong reduction by over an order of magnitude, which has also been observed in ambient measurements in Seattle where organic aerosol concentrations were 2–12 times greater than sulfate (Bertram et al., 2009). Several laboratory studies (e.g. Folkers et al., 2003; Thornton and Abbatt, 2005; McNeill et al., 2006) have suggested that the organic suppression is due to the formation of a layer of organic coating inhibiting the hydrolysis reaction. Uptake to soot has been reported as being very low, while experiments on dust have shown a broad range in N2 O5 uptake, which is partially a result of the wide range of chemical components present in different dust types (Brown and Stutz, 2012, and references therein). The present study seeks to explore the influence of aerosol chemical composition on heterogeneous N2 O5 uptake in a contrasting chemical environment to previous ambient studies. In addition, the airborne nature of the study allows us to assess the role of heterogeneous N2 O5 uptake throughout the nocturnal boundary layer, which is more representative than measurements at a fixed ground location. While sulfate is still an important component of the aerosol burden in northwestern Europe, its contribution is often comparable to, or even outweighed by, that of ammonium nitrate and organic matter (e.g. Putaud et al., 2004; Morgan et al., 2010b). Furthermore, sulfate is often present in its neutralised form (e.g Morgan et al., 2009, 2010b) due to the abundance of ammonia sources in the region (e.g. Reis et al., 2009). Airborne measurements were conducted as part of the RONOCO (ROle of Nighttime chemistry in controlling the Oxidising Capacity of the atmOsphere) project. Science flights were conducted in the UK region during July 2010 and January 2011 but only the summer measurements are presented here as the full suite of instruments required for this analysis were not fully operational during the winter campaign. A previous study by Stone et al. (2014) using a measurement-constrained box model found that heterogeneous uptake dominated (66 %) the loss of NO3x (N2 O5 +NO3 ) during the summer nighttime during RONOCO. The measurements are representative of a broad range of complex chemical environments, which presents a significant challenge for our ability to constrain the role of aerosol chemical composition on nighttime chemistry in the region. 2 2.1 Method Sampling platform The UK Facility for Airborne Atmospheric Measurements (FAAM) BAe-146 research aircraft has a typical science www.atmos-chem-phys.net/15/973/2015/ W. T. Morgan et al.: Influence of aerosol chemical composition on N2 O5 uptake speed of approximately 120 m s−1 , which equates to a horizontal distance of approximately 7 km for the 1 min sampling time used predominantly in this analysis. Vertical profile ascents and descents are made at approximately 150 m per minute below 1 km and at 300 m per minute above 1 km. Consequently, vertical profiles also include a horizontal gradient within the measurements and instruments with longer sampling times (> 30 s) may not fully account for horizontal variations in concentration gradients with altitude. As the flights generally took place in darkness, the minimum safe altitude was increased compared with usual operating procedures to approximately 600 m when over open bodies of water. Aerosol instruments housed within the aircraft cabin sampled via Rosemount inlets (Foltescu et al., 1995). An experimental study conducted by Trembath et al. (2012) suggests that these inlets enhance aerosol concentrations under certain conditions. The level of enhancement has been shown to be dependent upon the mean bulk density of the aerosol particles sampled, with the effect being strongest in the supermicron size range (up to a factor of 10 for Saharan desert dust) compared to the smaller enhancements for sub-micron aerosols. For pollution aerosol in NW Europe, which is the dominant aerosol type studied here, the enhancement is negligible for particles below an optical diameter of 0.6 µm. According to measured size distributions during this study, the majority of the sampled particles are below 0.6 µm, thus enhancements due to the Rosemount inlets are not expected to perturb our measured aerosol concentrations. 2.2 Instrumentation An Aerodyne compact time-of-flight aerosol mass spectrometer (AMS, Drewnick et al., 2005; Canagaratna et al., 2007) measured the chemical composition of non-refractory aerosol species. Specific details relating to the operation of the instrument on the BAe-146 can be found in Morgan et al. (2009, 2010b). The AMS ionisation efficiency calibration was performed on a daily basis after each flight. An error in the size selection by the differential mobility analyser meant that the standard method was modified, which is detailed in the Supplement. Following the studies by Matthew et al. (2008) and Middlebrook et al. (2012), we estimate the AMS collection efficiency based upon the ammonium nitrate fraction present in the aerosol. Concentrations are reported at standard temperature and pressure (STP, 273.15 K and 1013.25 hPa respectively), which is denoted as micrograms per standard cubic metre (µg sm−3 ). Detection limits were determined based upon zero particle-filter sampling periods and calculated as three times the standard deviation of the measured mass concentrations for a 30 s sampling period. Detection limits were 1 ng sm−3 for chloride, 2 ng sm−3 for nitrate and sulfate, 10 ng sm−3 for ammonium and 20 ng sm−3 for organics. These values represent maximum detection limits as they are based on pre-flight filter pewww.atmos-chem-phys.net/15/973/2015/ 975 riods, where the instrument background in the vacuum chamber is greater than later in the flight. Aerosols sampled by the AMS are assumed to be dry due to ram heating as the air sample enters the aircraft and decelerates, coupled with the cabin temperature of the aircraft exceeding the ambient air temperature. Aerosol number-size distributions were measured by an inboard Scanning Mobility Particle Sizer (SMPS, Wang and Flagan, 1990) and a wing-mounted Particle Measurement Systems (PMS) Passive Cavity Aerosol Spectrometer Probe 100X (PCASP, Liu et al., 1992; Strapp et al., 1992). The SMPS sizes particles according to their electrical mobility, while continually ramping the classifying voltage of a differential mobility analyser. Particles in each mobility bin are then counted using a Aerosol Dynamics Inc. Water-based Condensation Particle Counter (WCPC, Model 3786-LP, which is based on the TSI 3786 model, Hering et al., 2005), which is modified for operation at low pressure. Number– size distributions are then provided from 20–350 nm. The SMPS is fitted within the same aircraft rack as the AMS, so it shares a common inlet. The PCASP is an optical particle counter, which nominally measures particles over a 0.1– 3 µm diameter range. The electronics of the instrument have been upgraded by Droplet Measurement Technology, which increases the number of detection channels resulting in an increase in the size resolution of the instrument. Calibration and operation procedures for the PCASP on the BAe-146 are provided by Rosenberg et al. (2012). Particle diameters are given as Polystyrene Latex Sphere (PSL) equivalent size using a refractive index of 1.588. Post-campaign, a leak was identified between the optical block and the pump of the PCASP, which led to the reported absolute concentrations being reduced. Such a leak would lead to an error in the measured flow rate, which would affect the absolute number concentration reported but not the relative shape of the size distribution. In order to correct for this, the PCASP number distribution was scaled to the SMPS number distribution over a relatively narrow overlap region (0.15–0.23 µm), which typically required a scaling factor of 1.19–1.53 across different flights. This allowed the recovery of the PCASP data, which meant that the SMPS and PCASP data could be combined to calculate the aerosol surface area and volume concentrations from 0.02–3 µm. A comparison of the sub-micron volume concentration with the estimated volume from the AMS is shown in Fig. 1. The comparison is for Straight-and-Level Runs (SLRs) in the boundary layer only as the 1 min sampling time of the SMPS precludes usage of the data during vertical profiles. Following Bahreini et al. (2009), we assume an uncertainty of 30 % in total AMS mass combined with a 7 % uncertainty in aerosol density. This yields an overall uncertainty of 43 % when combined with those from the size distributions. Overall, 94 % of the data points fall within the combined uncertainty range with a correlation coefficient of 0.90 for the whole data set. The AMS volume estimate is typically less Atmos. Chem. Phys., 15, 973–990, 2015 976 W. T. Morgan et al.: Influence of aerosol chemical composition on N2 O5 uptake 0.25 +/- 43% uncertainty All data points B536/B537 datapoints Normalised frequency 0.20 0.15 0.10 0.05 0.00 0.0 0.2 0.4 0.6 0.8 1.0 1.2 1.4 AMS volume/(PCASP+SMPS volume) 1.6 1.8 2.0 Figure 1. Histogram of the ratio between the estimated AMS volume and the combined volume derived from the PCASP and SMPS. Only SLRs are included due to the time resolution of the SMPS making it unsuitable for vertical profiles. The grey area represents the area covered by the ±43 % uncertainty bounds for the ratio. The red histogram represents the data from B536 and B537 which are skewed to larger ratios compared to the full data set. than the combined value from the SMPS and PCASP, aside from B536 and B537. The cause of the different bias in these flights is unknown but one likely cause was the enhanced ambient temperatures during these flights, which caused the cabin temperature of the aircraft to increase relative to the other flights. Consequently, the WCPC had difficulty reaching its saturator temperature set point, which can lead to undercounting of aerosol particles. The comparison suggests that the recovery of the PCASP data has been reasonably achieved for all of the flights to within experimental uncertainties. The comparison suggests that during B536 and B537 there is a potential underestimate of the actual size distribution. Only one SLR from B537 is used in the N2 O5 uptake analysis which follows and is included as there was a large contribution from chloride aerosol. Mixing ratios of NO3 and N2 O5 were measured via a BroadBand Cavity Enhanced Absorption Spectroscopy (BBCEAS) instrument. NO3 is measured directly, while N2 O5 is detected as NO3 after thermal dissociation. Further details regarding the operation of the BBCEAS can be found in Kennedy et al. (2011). The mixing ratio of NO2 was measured via laser-induced fluorescence (LIF, Di Carlo et al., 2013). In-flight comparisons with a chemiluminescence system using a photolytic converter found that NO2 mixing ratios agreed to within 10 % (Di Carlo et al., 2013). Ozone was measured using a TECO 49C UV Photometric Ozone Analyser. A summary of the instrumentation is given in Table 2, including instrumental uncertainties. Only the uncertainty in Atmos. Chem. Phys., 15, 973–990, 2015 particle diameter is given for the PCASP given that the concentration is scaled to the SMPS. 2.3 Steady-state approximation In order to calculate the uptake coefficient for N2 O5 , the reactivity with aerosol particles is required. Following the work of Brown et al. (2003, 2006), Eqs. (1) and (2) show the relationship of the steady-state lifetimes (τss ) to the actual firstorder sink rate coefficients for NO3 and N2 O5 , kNO3 and kN2 O5 , with Keq a temperature-dependent equilibrium constant: τss (NO3 ) ≡ [NO3 ] = (kNO3 + Keq [NO2 ] × kN2 O5 )−1 k1 [NO2 ][O3 ] (1) −1 kNO3 [N2 O5 ] = kN2 O5 + k1 [NO2 ][O3 ] Keq [NO2 ] (2) τss (N2 O5 ) ≡ For these equations to be valid, the NO3 and N2 O5 system has to be in steady state, where the sources and sinks of these species are balanced and the concentration of the relevant species is constant. In addition, NO3 and N2 O5 should be in chemical equilibrium. Equilibrium between NO2 , NO3 and N2 O5 occurs more rapidly than steady state is established; a valid steady state implies that the system is at equilibrium (Brown et al., 2003). An aerosol chemical box model (Lowe et al., 2009) was used to explore this assumption for the conditions specific to this study using standard UK National Atmospheric Emissions Inventory (NAEI) gaseous emissions and a typical background aerosol loading. Gas-phase chemistry is represented by the CRIv2-R5 chemistry scheme (Watson et al., 2008), which includes many reactions between the www.atmos-chem-phys.net/15/973/2015/ W. T. Morgan et al.: Influence of aerosol chemical composition on N2 O5 uptake nitrate radical and volatile organic compounds. The scheme is validated against the Master Chemical Mechanism (MCM, Jenkin et al., 2003), while the performance of the scheme on the regional scale has been assessed in Archer-Nicholls et al. (2014). The photolysis rate profile used in the model was typical of clear-sky conditions in the UK during July. The evolution in the N2 O5 : NO3 ratio is compared when the expected ratio of the reaction is in equilibrium (Keq [NO2 ]) and when the ratio is calculated based on NO3 and N2 O5 mixing ratios given by the box model (shown in Fig. S2 in the Supplement). These can be used as a measure of how strongly the equilibrium Reaction (R2) governs the N2 O5 : NO3 ratio. Once emissions in the model have ceased and the sun has set, the two converge approximately 1 h after sunset (around 21:00 LT or 20:00 UTC), indicating that the system is in nearequilibrium and the steady-state assumption is valid. Consequently, we assume that when we sampled away from emission sources and it is an hour past sunset, the air parcels sampled by the aircraft are suitable for the steady-state analysis. By calculating the first-order sink rate coefficient for N2 O5 , the uptake coefficient of N2 O5 to particle surfaces, γ (N2 O5 ), can be directly determined, via Eq. (3), where A is the ambient aerosol surface area, which is calculated for each SLR used in the analysis: γ (N2 O5 ) ≈ 4kN2 O5 . cg A (3) The mean molecular velocity of N2 O5 is given by cg , which is calculated via Eq. (4), where Mw is the molecular weight of N2 O5 , T is the ambient temperature and k is the Boltzmann constant: s 8kT cg = . (4) π Mw Equation (3) assumes that there is no diffusion limitation to the particle surface and is approximately correct for small uptake coefficients (γ (N2 O5 ) < 0.1) and particles smaller than 1 µm (e.g. Brown and Stutz, 2012). 2.4 Aerosol surface area calculation An important step in the calculation of the N2 O5 uptake coefficient in this study is the accurate determination of the aerosol surface area. The SMPS and PCASP provide number–size distributions over a 0.02–3 µm diameter range in a dry condition. The uptake of N2 O5 to an aerosol surface will be strongly governed by the ambient size distribution of the particles, thus the addition of water content to the aerosol needs to be considered when the ambient relative humidity (RH) is enhanced. Hygroscopicity measurements were not available during RONOCO, so the aerosol water uptake is estimated using the Aerosol Diameter Dependent Equilibrium Model (ADDEM, Topping et al., 2005a, b), which uses the combined dry aerosol size distribution from www.atmos-chem-phys.net/15/973/2015/ 977 the SMPS and PCASP with the chemical composition measurements from the AMS. This produces an estimate of the hygroscopic growth factor for individual chemical species, which can be used to calculate the ambient aerosol surface area. Based on inspection of the organic mass spectra, the organic aerosol sampled during RONOCO resembles that of aged organic material. The hygroscopicity of such material is typically small but not negligible and we assume that it will be similar to that of Suwannee River fulvic acid, which has similar chemical functionalities to aged organic aerosol (e.g. McFiggans et al., 2005). For reference, ADDEM estimates that a 200 nm fulvic acid aerosol particle at 85 % relative humidity would have a growth factor of 1.10, which is significantly lower than the corresponding values for ammonium nitrate (1.61) and ammonium sulfate (1.57). The aerosol was assumed to be internally mixed across the size distribution as aerosol mixing state information was unavailable and the size distributions from the AMS were generally too noisy to discern whether aerosol chemical composition varied significantly with size. Such an assumption is consistent with previous ground-based experiments in the UK that demonstrated that away from near-field sources, pollution aerosol is typically internally mixed (e.g Cubison et al., 2006; Gysel et al., 2007; Liu et al., 2013). The bulk hygroscopic growth factor was estimated by combining the individual chemical component growth factors from ADDEM using a ZSR mixing rule approach (Zdanovskii–Stokes–Robinson, Stokes and Robinson, 1966; Gysel et al., 2007). A study by Gysel et al. (2007) used a similar method to estimate the hygroscopic growth factor and compared it with Hygroscopic Tandem Differential Mobility Analyser (HTDMA) measurements, yielding agreement to within 5 % once an instrumental artifact associated with ammonium nitrate was accounted for. The ambient surface area was estimated for the sub-micron size range only due to the measured super-micron contribution being negligible (often limited by counting statistics in the largest PCASP size bins) and the AMS measurements only being representative of the sub-micron aerosol population. 3 3.1 Results Air mass overview The BAe-146 operated out of East Midlands Airport (52◦ 490 5200 N, 01◦ 190 4100 W) during RONOCO, with the majority of flights occurring over the eastern and southern regions of the UK. B538 was the exception with a transect along the whole of the English Channel and into the Bristol Channel to the west. The flight tracks of the aircraft are shown in Fig. 2. Generally the in situ measurements occurred over open water due to nighttime air traffic restrictions. The only significant in situ measurements over land took place around the Greater London area, which roughly followed the M25 motorway during B536 and B542. In situ measurements Atmos. Chem. Phys., 15, 973–990, 2015 978 W. T. Morgan et al.: Influence of aerosol chemical composition on N2 O5 uptake 58 3500 56 3000 2000 1500 52 Altitude (m) Latitude (°N) 2500 54 1000 500 50 0 48 -8 -6 -4 -2 Longitude (°E) 0 2 4 Figure 2. Flight track summary for the July 2010 flying period. Lines are coloured by altitude. Table 1. Flight summary of the operations included in this study. All flights were conducted during 2010. Flight times and sunset given in local time, which is UTC minus one hour. Flight Date B534 B535 B536 B537 B538 B539 B540 B541 B542 16 July 17 July 19 July 20 July 22 July 24 July 26 July 29 July 29 July Take-off (L) Land (L) Sunset (L) 21:56 22:11 22:06 21:49 21:57 21:58 20:39 00:03 23:34 01:52 02:17 02:21 02:07 02:25 02:25 00:11 04:33 04:03 21:10 21:09 21:07 21:06 21:03 21:00 20:57 20:57 20:53 were mainly performed between 500 and 1000 m, with some higher-level measurements conducted to investigate elevated pollution layers. A variety of air mass types were encountered during the 2 weeks of flying during the July RONOCO period, with the key synoptic meteorological features highlighted in Fig. S3. A summary of the particle and gas phase composition is shown in Fig. 3. The beginning of the campaign was marked by generally zonal flow from the west, which typically brings cleaner pollution conditions into the UK (e.g Abdalmogith and Harrison, 2005; Morgan et al., 2009). This is reflected in the measurements from the AMS, which showed muchreduced concentrations that were typically below 2 µg sm−3 for organics and sulfate, while nitrate was below 0.5 µg sm−3 . Mixing ratios of NO2 were typically between 0.5–2 ppb, with some larger mixing ratios observed in plumes from point sources along the coast. O3 was generally between 30– 40 ppb. Atmos. Chem. Phys., 15, 973–990, 2015 Operating region North Sea North Sea M25/Greater London Southern North Sea English Channel and North Sea North Sea English Channel English Channel M25/Greater London and English Channel From 20 July onwards, high pressure began to influence the UK region as an anti-cyclone established itself over the region. This resulted in air from continental Europe advecting over the UK, with temperatures being elevated and wind speeds reducing. Such air masses typically result in elevated pollution conditions in the UK region (e.g. Morgan et al., 2009, 2010b; McMeeking et al., 2012). In particular, the organic aerosol concentration increased over this period, with measured peak values exceeding 15 µg sm−3 during B537. Ammonium nitrate and ammonium sulfate were also enhanced compared to earlier in the campaign. O3 was significantly enhanced during this period, with peak mixing ratios above 80 ppb, while median mixing ratios were above 70 ppb. NO2 mixing ratios were reduced compared to B535, which was likely a result of dilution and chemical processing as the air mass transit time from the major sources in continental Europe was longer than when operating close to the UK coastline. www.atmos-chem-phys.net/15/973/2015/ W. T. Morgan et al.: Influence of aerosol chemical composition on N2 O5 uptake 979 Table 2. Summary of instrumentation used in this study. Acronyms used are as follows: cToF-AMS (compact Time-of-Flight Aerosol Mass Spectrometer, PCASP (Passive Cavity Aerosol Spectrometer Probe), SMPS (Scanning Mobility Particle Sizer), BBCEAS (BroadBand Cavity Enhanced Absorption Spectrometer) and LIF (laser-induced fluorescence). The size ranges applicable to the aerosol measurements are given in parentheses. Measurement Instrument Accuracy or uncertainty Aerosol composition Aerosol size cToF-AMS ( 0.05–0.8 µm) PCASP (0.2–3 µm) SMPS (0.02–0.35 µm) BBCEAS BBCEAS LIF Ozone Analyser 30 % (see Bahreini et al., 2009) 5 % (diameter) (Rosenberg et al., 2012) 30 % (see Wiedensohler et al., 2012) 15 % (Kennedy et al., 2011) 11 % (Kennedy et al., 2011) 10 % (Di Carlo et al., 2013) 3 ppb for mixing ratios below 100 ppb Mass concentration -3 (µg sm ) N2 O5 NO3 NO2 O3 Organics Nitrate Sulfate Ammonium Chloride N2O5 NO3 NO2 O3 12 8 4 0 80 6 400 40 200 0 B534 B535 B536 B537 B538 B539 B540 B541 B542 4 20 2 0 0 NO2 (ppb) 60 O3 (ppb) N2O5 & NO3 (ppt) 600 Flight Number Figure 3. Summary of particle and gas phase composition for the flights considered by this study. Chloride refers to non-sea salt chloride, in the form of ammonium chloride in this case and is multiplied by a factor of 10. Crosses represent the mean value, while horizontal lines represent the 25th, 50th and 75th percentiles. The whiskers represent the 5th and 95th percentiles. Following B537 on the 20/21 July, a precipitating frontal system passed over the UK region, which led to washout of the significant pollution concentrations that had built up over the preceding days. Aerosol concentrations were duly depressed although they were still greater than at the beginning of the campaign during B535. The following week saw a procession of frontal systems pass over the UK, with less intensive flying taking place. A low-pressure system over Scandinavia to the east of the UK and a high-pressure system to the southeast, led to northwesterly air flow across the UK during the last flight of the July campaign. This led to relatively enhanced aerosol concentrations, with the ammonium nitrate contribution being greater compared with B538. NO2 was also enhanced relative to the rest of the campaign, as www.atmos-chem-phys.net/15/973/2015/ a number of plumes were sampled originating from the UK. O3 mixing ratios were typically between 20 and 40 ppb. 3.2 Calculated N2 O5 uptake coefficients Figure 3 outlines that there is substantial variability in the mixing ratios of NO3 and N2 O5 , which suggests that the sources and sinks for these species differ across the different air masses sampled. Following the methods outlined in Brown et al. (2006), we calculate the first-order rate coefficients, kNO3 and kN2 O5 , for these species using Eqs. (1) and (2). Examples based on B537 and B542 are shown in Fig. 4, where two extremes in steady-state lifetimes are shown. Using Eq. (1), kNO3 and kN2 O5 are calculated as the intercept and slope respectively of the line of best fit. Conversely, Eq. (2) yields the same parameters but the values for the slope and Atmos. Chem. Phys., 15, 973–990, 2015 980 W. T. Morgan et al.: Influence of aerosol chemical composition on N2 O5 uptake (a) (b) 35 4 200 30 = 16 mins -1 k(NO3) = 24 mins -3 -1 τ(N2O5) (10 s ) 3 -1 20 -1 -3 -1 τ(NO3) (10 s ) k(N2O5) 25 15 10 150 100 2 50 1 5 0 -1 k(N2O5) ~ 3 hours 0 -1 k(NO3) = 34 mins 0 0 5 10 15 20 25 30 Keq x [NO2] N2O5 lifetime (minutes) -1 0.0 0.1 0.2 0.3 0.4 0.5 -1 (Keq x [NO2]) Figure 4. Plots of τss (NO3 )−1 against Keq [NO2 ] (a) and τss (N2 O5 )−1 against (Keq [NO2 ])−1 (b), which allows calculation of the first-order rate coefficients kNO3 and kN2 O5 . The two plumes show the extremes in N2 O5 lifetimes observed for the steady-state analysis. Points are coloured according to the N2 O5 lifetime. The slopes with a short lifetime (darker colours) are from B537, while the slopes with a longer lifetime (lighter colours) are from B542. The solid grey lines are the linear fits to the data, with the inverse values for each slope given on the plots in units of time, i.e. minutes or hours. intercept are reversed. In Fig. 4a, the example with the steepest slope is from B537, where the steady-state lifetime for N2 O5 was very short (15±4 min), suggesting a rapid sink for N2 O5 . The much shallower slope in Fig. 4a indicates a much longer lifetime (120 ± 28 min) and a close to negligible sink for N2 O5 , which was observed during B542. The other case studies included in this analysis fall within these two extremes. Case studies were selected during portions of the flight when the aircraft was sampling relatively homogeneous pollution conditions at a constant altitude below 1500 m, which was typically within the residual layer. The case studies were based on individual SLRs performed by the aircraft during each flight. These SLRs are typically 5– 20 min long and this relatively short duration typically means that the pollution conditions are relatively homogeneous, i.e. approximately constant aerosol concentrations and composition. Instances where the slopes and intercepts calculated from the steady-state gradient plots were negative were excluded as these are deemed unphysical, which was the case for all of B536 and B541. B540 was not included as the flight was concluded earlier than planned, which limited the number of measurements after dusk. The chemical box model indicated that the steady-state assumption was valid for measurements more than 1 h after sunset, so only these measurements were used. Values for kN2 O5 were calculated using both Eqs. (1) and (2), with the average of these two values being taken to derive the final value. Atmos. Chem. Phys., 15, 973–990, 2015 Once kN2 O5 has been calculated, Eq. (3) can be used to calculate the uptake coefficient of N2 O5 to particle surfaces, γ (N2 O5 ). Values for γ (N2 O5 ) were obtained on a point-bypoint basis, taking into account the variation in aerosol surface area during the measurements. The mean value and standard deviation was then calculated and used for further analysis. The uncertainty in γ (N2 O5 ) was estimated as approximately 36 % via summing in quadrature using the uncertainty values listed in Table 2. The mean values ranged from 0.0076 to 0.030. The γ (N2 O5 ) and the N2 O5 steady-state lifetime shows a strong negative correlation (R 2 = 0.64), which would be expected if uptake by aerosol is a dominant sink for N2 O5 in these cases. An additional source of uncertainty is the assumed growth factor for organics used in the water uptake calculation; increasing the growth factor by 10 % brings the ADDEM-calculated value close to that observed by Gysel et al. (2007) and results in γ (N2 O5 ) decreasing by approximately 5 % when averaged across the data set. Consequently, the impact is minor when compared to the other uncertainties inherent in the analysis. The ambient aerosol surface area ranged from approximately 100 to 400 µm2 cm−3 , aside from B537 where the ambient surface area was close to 800 µm2 cm−3 . Within this general range, there is no obvious trend between γ (N2 O5 ) and aerosol surface area. This suggests that uptake is not purely driven by the physical properties of the aerosol; the www.atmos-chem-phys.net/15/973/2015/ W. T. Morgan et al.: Influence of aerosol chemical composition on N2 O5 uptake 50 60 70 Relative Humidity (%) 981 80 90 γ(N2O5) 0.030 0.020 0.010 2 2 r =0.30 0.000 0.0 0.1 0.2 0.3 0.4 Sulfate mass fraction 0.5 r =0.004 0.6 0.0 0.1 0.2 0.3 0.4 Organic mass fraction 0.5 0.6 γ(N2O5) 0.030 0.020 0.010 - BT09 w/ Cl 2 r =0.35 0.000 0.0 0.1 0.2 0.3 0.4 Nitrate mass fraction 0.5 - BT09 w/o Cl 0.6 0 20 40 60 80 H2O:NO3 (molar ratio) 100 Figure 5. Relationship between γ (N2 O5 ) and aerosol chemical composition. The markers are coloured by the ambient relative humidity. BT09 w/ Cl− refers to the Bertram and Thornton (2009) parameterisation including chloride, while BT09 wo/ Cl− excludes chloride. aerosol chemical composition likely plays a defining role in controlling uptake. Figure 5 shows the relationship between γ (N2 O5 ) and aerosol chemical composition expressed as mass fractions based on the measurements from the AMS, as well as the H2 O : NO− 3 molar ratio. The organic mass fraction exhibits a very weak relationship (R 2 = 0.004) with γ (N2 O5 ), as does the chloride mass fraction (R 2 = 0.05, not shown). The nitrate mass fraction (R 2 = 0.35) and sulfate mass fraction (R 2 = 0.30) show stronger negative and positive relationships respectively with γ (N2 O5 ). Identifying whether this is a result of either a suppressive effect by nitrate or an enhancement by sulfate is complicated by the strong negative correlation between nitrate and sulfate mass fractions (r = −0.77). The points are also coloured by the ambient RH, which had a very weak relationship (R 2 = 0.05) with γ (N2 O5 ). The relationship between γ (N2 O5 ) with the H2 O : NO− 3 molar ratio broadly follows the parameterisation of Bertram and Thornton (2009), with uptake increasing as the ratio increases. However, there are some deviations from this and there is a general overprediction by the parameterisation. The ability of this and other parameterisations to represent uptake of N2 O5 will be explored in the next section. www.atmos-chem-phys.net/15/973/2015/ 3.3 Parameterised N2 O5 uptake coefficients In order to study the potential controls on γ (N2 O5 ), a range of parameterisations for γ (N2 O5 ) from the existing literature are employed and compared with the calculated values. Bertram and Thornton (2009) identified the H2 O : NO− 3 molar ratio as a controlling factor on N2 O5 uptake using Eq. (5), which is based on laboratory data: 1 0 1 − γ (N2 O5 ) = Ak2f . − k3 [H2 O(l)] + 1 + k4 [Cl ] k2b [NO− 3] (5) k2b [NO− 3] The fit coefficients used are taken from Bertram and Thornton (2009), who also identified that the presence of chloride aerosol enhanced uptake and included this in their parameterisation. This approach is compared with the γ (N2 O5 ) calculated from the steady-state approach in Fig. 6. The parameterisation uses the measured nitrate from the AMS coupled with the estimated water content from the measured size distributions. The mean values are shown along with the standard deviation in the γ (N2 O5 ) values, which reflects the variability in the ambient aerosol surface area and aerosol composition over the duration of the run. The uncertainty in the parameterised γ (N2 O5 ) is estimated as approximately 43 %. The majority of the data points fall within the uncertainty range with a tendency towards overprediction of γ (N2 O5 ) Atmos. Chem. Phys., 15, 973–990, 2015 982 W. T. Morgan et al.: Influence of aerosol chemical composition on N2 O5 uptake - - BT09 wo/ Cl aerosol are tested and summarised in Table 3. Anttila et al. (2006) developed a formulation for the N2 O5 uptake due to a coating of organics, which was applied within a regionalscale model simulation over Europe by Riemer et al. (2009). The formulation based on Riemer et al. (2009) is given by BT09 w/ Cl - - BT09 & GTN13 wo/ Cl BT09 & GTN13 w/ Cl γ (N2 O5 )coat = γ(N2O5) - param. - 0.04 0.03 0.02 0.01 0.00 - BT09 & R09+ wo/ Cl BT09 & R09+ w/ Cl R03 wo/ R09 R03 w/ R09 0.00 0.01 0.02 0.03 0.04 γ(N2O5) - steady state 20 40 60 80 100 - H2O:NO3 (molar ratio) Figure 6. Comparison between γ (N2 O5 ) from selected parameterisations and the steady-state analysis. Each axis has the same scale in each panel. Points are coloured by the H2 O : NO− 3 molar ratio. Points represent the mean value for a plume, while the bars give the standard deviation. Grey dashed lines denote the 1 : 1 line. BT09 refers to Bertram and Thornton (2009), GTN13 refers to Gaston et al. (2014), R03 refers to Riemer et al. (2003), R09 refers to Riemer et al. (2009) using the resistor model and R09+ refers to Riemer et al. (2009) using linear mixing. by the parameterisation (slope = 1.09, R 2 = 0.52, RMSE = 0.0057). Generally, the variation in uptake follows the H2 O : NO− 3 molar ratio with some outliers, particularly when the ratio is low. Inclusion of the chloride pathway in the parameterisation leads to much poorer agreement, with a greater tendency towards overprediction by the parameterisation (slope = 1.44, R 2 = 0.48, RMSE = 0.012). The impact is largest when the H2 O : NO− 3 molar ratio is less, as the sensitivity of the parameterisation to chloride leads to a substantial increase in the predicted uptake as large as a factor of 2. The assumed organic growth factor in the water content estimate represents a source of uncertainty, with an increase of 10 % in the growth factor yielding an increase in γ (N2 O5 ) from the parameterisation of 6 % when averaged across the whole data set. As noted in Sect. 3.2, taking account of this uncertainty reduces the γ (N2 O5 ) calculated from the steady-state method by 5 %, which further compounds the overestimation by the parameterisation. Given the major contribution of organic aerosol, several parameterisations which include suppression by organic Atmos. Chem. Phys., 15, 973–990, 2015 4RTHorg Dorg Rc . cg lRp (6) The universal gas constant is given by R, Horg is the Henry’s Law constant of N2 O5 for the organic coating and Dorg is the diffusion coefficient of N2 O5 in the organic coating. Dorg is calculated following the method described in Riemer et al. (2009), which follows the analysis described in Anttila et al. (2006). They showed that Horg Dorg is approximately 0.03Haq Daq for organic coatings consisting of condensed monoterpene oxidation products, where Haq is the Henry’s law constant for N2 O5 for the aqueous phase (5000 M atm−1 ) and Daq is the diffusion coefficient of N2 O5 for the aqueous phase (10−9 m2 s−1 ). The radius of the particle is given by Rp , the radius of the core is Rc and the thickness of the organic coating is given by l. For application to this data set, the particle radius is estimated as the geometric mean size of the measured surface area distribution. Following the method applied by Riemer et al. (2009), the thickness of the organic coating is then estimated based on the volume ratio of inorganics to the total volume ratio (organics plus inorganics) denoted as β. The thickness is calculated via 1 (7) l = Rp 1 − β 3 . From this the particle core radius is calculated by subtracting the coating thickness from the total particle radius. Gaston et al. (2014) adapted the work of Anttila et al. (2006) based on laboratory experiments identifying that the suppression of γ (N2 O5 ) by organic coatings was dependent upon a range of factors including the O : C ratio, the organic mass fraction and the RH. They suggested polyethylene glycol (PEG) as a potential surrogate for ambient organic aerosol given its similar O : C ratio to the average organic aerosol O : C based on the AMS database described in Ng et al. (2010). Based on the approximation for predicting O : C from unit mass resolution AMS data from Canagaratna et al. (2015), the O : C ranges from 0.49 to 0.66 in this study, which is below the “high” O : C regime defined in Gaston et al. (2014). Furthermore, this represents a narrow range in O : C and there is no obvious relationship with γ (N2 O5 ), O : C and the various aerosol chemical components relevant to this study. In general, including the suppressive effect of organic aerosol in the uptake parameterisation leads to significant underprediction of γ (N2 O5 ) values as summarised in Table 3 and Fig. 6 (only a selection of the parameterisations are shown in Fig. 6 due to the similarity between the results for several of the schemes). Furthermore, the correlation is www.atmos-chem-phys.net/15/973/2015/ W. T. Morgan et al.: Influence of aerosol chemical composition on N2 O5 uptake significantly weaker and the RMSE is greater than in those using only the Bertram and Thornton (2009) schemes. Combining the Anttila et al. (2006) and Riemer et al. (2009) resistor model approach with the Bertram and Thornton (2009) parameterisation for the inorganic core reduces the parameterised uptake by more than an order of magnitude. In comparison, combining the Bertram and Thornton (2009) parameterisation with the organic suppression scheme and coefficients from Gaston et al. (2014) yields a weaker overall impact on the parameterised uptake coefficient (slope = 0.90, R 2 = 0.19, RMSE = 0.0067 for the case without chloride). However, the addition of organic suppression increases the scatter in the comparison between the parameterised and calculated γ (N2 O5 ), which weakens the correlation between them. Given that Gaston et al. (2014) suggest that the organic suppression is partially mediated by the mass fraction of organic aerosol, the Riemer et al. (2009) parameterisation is combined with the Bertram and Thornton (2009) scheme using linear mixing rather than the resistor approach to test this assumption. This yields an improved comparison with the calculated values (slope = 0.31, R 2 = 0.017, RMSE = 0.0014 for the case without chloride) but the parameterisation still significantly underpredicts γ (N2 O5 ). Using the core parameterisation based on the nitrate and sulfate mass fractions from Riemer et al. (2003) yields a reasonable comparison with the calculated values (slope = 0.72, R 2 = 0.32, RMSE = 0.007). However, the parameterised uptake encompasses a relatively narrow range from approximately 0.01–0.02 and does not represent the larger uptake values (> 0.02), which are captured by the Bertram and Thornton (2009) scheme. Similarly to when combining the suppressive effect of organic aerosol using the Riemer et al. (2009) parameterisation with the Bertram and Thornton (2009) scheme, the addition of an organic coating strongly underpredicts γ (N2 O5 ) when combined with the Riemer et al. (2003) core parameterisation. Using the parameterisation from Evans and Jacob (2005), which is based on the organic and sulfate content of the aerosol, results in a substantial overprediction (slope = 1.79, R 2 = 0.084, RMSE = 0.022). The parameterisation from Evans and Jacob (2005) includes a correction for a typographical error in their Table 1, which meant a negative sign was omitted in the publication (Mathew Evans, personal communication, 2014). Overall, the variation and magnitude of the calculated N2 O5 uptake coefficient is best represented by the Bertram and Thornton (2009) parameterisation when only the influence of nitrate and aerosol water content is included. 4 4.1 Discussion Controls on N2 O5 uptake The results presented are consistent with ammonium nitrate being a significant suppressant of N2 O5 uptake, when comwww.atmos-chem-phys.net/15/973/2015/ 983 pared to the amount of water content in the aerosol. The broad features in the uptake of N2 O5 generally follow the parameterisation developed by Bertram and Thornton (2009), with the greatest level of agreement across the whole data set achieved when the effect of chloride is neglected. This observation is consistent with the work of Riedel et al. (2012), who also found that the inclusion of the chloride pathway led to an overestimate of N2 O5 uptake. Chloride concentrations were generally very low with median concentrations ranging from 0.01–0.04 µg sm−3 and a peak concentration of 0.4 µg sm−3 during B537. When chloride was included it had a large impact on the predicted uptake at low H2 O : NO− 3 molar ratios, resulting in poorer agreement with the γ (N2 O5 ) estimated using the steady-state method. However, the chloride that was measured by the AMS was sub-micron, and based on the ion balance with sulfate, nitrate and ammonium, it was in the form of ammonium chloride. Substantial sodium chloride concentrations were not expected to be sampled as the measurements presented here were made on an aircraft outside of the marine mixed layer and wind speeds during the project were generally low. The coarse mode contribution to aerosol surface area was typically only 1–2 % for particles below 3 µm, although without measurements above this size range we cannot eliminate the possibility of particles larger than 3 µm acting as a sink for N2 O5 . Possibly the applicability of the chloride pathway may be questioned in this environment, and without greater measurement constraint it is difficult to assess the role played by chloride in N2 O5 uptake. If the coarse mode contribution to the aerosol surface area is indeed negligible, then the data imply that the chloride enhancement is not as large in the ambient environment as it is in laboratory studies. Future measurements of this type should include nitryl chloride so that comparisons with the abundances observed in the coastal studies off the USA by Osthoff et al. (2008) and Thornton et al. (2010) can be conducted. Bannan et al. (2014) report nitryl chloride peak mean nighttime concentrations of 127 ppt from ground-based measurements in London, which potentially points to the importance of chloride aerosol in N2 O5 uptake in this region. Sulfate mass fraction displayed a positive correlation with N2 O5 uptake but discerning the influence of sulfate is complicated by its strong negative correlation with nitrate. The apparent influence of sulfate could purely be driven by the absence or presence of nitrate in the aerosol. The parameterisations which included sulfate generally failed to replicate the variation and magnitude of the calculated γ (N2 O5 ), which points to sulfate playing a lesser role, which is in contrast to Brown et al. (2006). However, sulfate was typically observed in its neutralised form rather than the acidic form it took in the northeast USA in the Brown et al. (2006) study. Acidic sulfate was only observed on a small number of occasions when sampling close to source in power plant or ship plumes, which were encountered infrequently and were not representative of the general regional aerosol burden observed during the study. This, combined with the prevalence Atmos. Chem. Phys., 15, 973–990, 2015 984 W. T. Morgan et al.: Influence of aerosol chemical composition on N2 O5 uptake Table 3. Summary statistics comparing the parameterised γ (N2 O5 ) with values calculated from the steady-state analysis. Core parameterisation refers to the study used to estimate the uptake due to the assumed core of the particle, while the shell parameterisation (where applicable) refers to the uptake by the assumed coating by organic aerosol. BT09 refers to Bertram and Thornton (2009), GTN13 refers to Gaston et al. (2014), R03 refers to Riemer et al. (2003), R09 refers to Riemer et al. (2009) using the resistor model, R09+ refers to Riemer et al. (2009) using linear mixing and EJ05 refers to Evans and Jacob (2005). Regression slope refers to the line of best fit from an ordinary least squares linear regression between the parameterised uptake and the steady-state-based uptake calculation when the intercept is forced through zero. q Root mean squared error (RMSE): P (Pi −Ci )2 , where P is the parameterised value and C is the calculated value for data point i. N Core parameterisation Shell parameterisation BT09 wo/ chloride BT09 w/ chloride BT09 wo/ chloride BT09 w/ chloride BT09 wo/ chloride BT09 w/ chloride BT09 wo/ chloride BT09 w/ chloride R03 R03 R03 EJ05 None None GTN13 GTN13 R09 R09 R09+ R09+ None R09 R09+ N/A Regression slope R2 RMSE 1.09 1.44 0.90 1.09 0.056 0.057 0.31 0.33 0.72 0.058 0.27 1.79 0.52 0.48 0.19 0.05 0.0004 0.000004 0.017 0.0015 0.32 0.036 0.096 0.084 0.0057 0.012 0.0067 0.0093 0.019 0.018 0.014 0.014 0.007 0.018 0.014 0.022 Table 4. Comparison with other studies. Location NE USA NE USA Texas, USA Seattle, USA Boulder, USA California, USA Weld County, Colorado, USA NW Europe/UK γ (N2 O5 ) 0.017 <0.0016 0.0005–0.006 0.01–0.04 <0.01 <0.001–0.029 0.002–0.1 0.0076–0.030 of nitrate and organics in the aerosol, may mask any potential sulfate enhancement of γ (N2 O5 ). Sulfate may have played an indirect role in the variation in γ (N2 O5 ), given the hygroscopic nature of ammonium sulfate, which would alter the aerosol water content and thus perturb γ (N2 O5 ). Overall, there was a tendency towards overprediction of γ (N2 O5 ) by the Bertram and Thornton (2009) parameterisation compared with those calculated from the steadystate method, although the tendency overall was small (9 %) and the uncertainties are relatively large. The overprediction was particularly evident when the water-to-nitrate ratio was lower, which could point towards a suppression in uptake by additional factors such as organic aerosol. Inclusion of Atmos. Chem. Phys., 15, 973–990, 2015 Description Reference Elevated sulfate region. Sulfate/organic mix. Houston pollution plumes. Sulfate/organic mix. Elevated RH. Sulfate/organic mix. Reduced RH. Polluted coastal site. Sulfate/organic/nitrate mix. Denver pollution plumes. Sulfate/organic/nitrate mix. Clean and polluted conditions. Sulfate/organic/nitrate mix. Elevated RH (50–90%). Brown et al. (2006) Brown et al. (2006) Brown et al. (2009) Bertram et al. (2009) Bertram et al. (2009) Riedel et al. (2012) Wagner et al. (2013) This study various parameterisations of this suppression typically led to substantial underprediction of the calculated γ (N2 O5 ). Furthermore, the variation in the calculated γ (N2 O5 ) was not captured and a greater bias between the parameterisation and calculated values was introduced. Using the resistor model approach detailed in Anttila et al. (2006) led to strong suppression of γ (N2 O5 ), whereas assuming linear mixing based on the proportion of organic aerosol yielded an improved comparison with the calculated values. Combining the Bertram and Thornton (2009) with chloride excluded and the organic suppression scheme outlined by Gaston et al. (2014) resulted in good agreement in terms of overall magnitude between the parameterisation and calculated γ (N2 O5 ), www.atmos-chem-phys.net/15/973/2015/ W. T. Morgan et al.: Influence of aerosol chemical composition on N2 O5 uptake but relative to the Bertram and Thornton (2009) alone, the variation was not as well captured. The parameterisations including organics result in a poorer representation of the calculated γ (N2 O5 ), although the results do suggest that additional suppression is required at lower water-to-nitrate ratios. These parameterisations all assume that the organic material forms a distinct coating on the aerosol – aside from the Evans and Jacob (2005) parameterisation – which may not be the case in reality. If the organics are water soluble, then the suppressive effect would be lessened but we do not have measurements to constrain this in the present study. While the correlation between organic aerosol content and γ (N2 O5 ) is low, organic aerosol usually represents more than 20 % of the sub-micron mass measured by the AMS, which may represent a broad suppressive effect on uptake. As such, organics may still exert a significant impact on uptake. An additional consideration relevant to low waterto-nitrate ratios is that nitrate may be underestimated by the AMS measurements due to heating of the aerosol sample as it enters the cabin, which would introduce a negative artefact. We also neglect the potential suppression due to black carbon, although its contribution to the sub-micron aerosol mass is typically less than 5 % based on previous regional measurements around the UK (e.g. McMeeking et al., 2012). Overall, the best agreement between the calculated and parameterised γ (N2 O5 ) is when only the influence of water and nitrate is included. Including either the suppressive impact of organics or enhancing effect of chloride leads to poorer agreement with the calculated values. Given that the influence of these species is well established in the laboratory environment, this suggests that there is a fundamental gap in our knowledge of how these species interact in the ambient environment and how this modifies N2 O5 uptake. Laboratory studies have typically focused on relatively simple systems that often do not reflect the complexity of ambient aerosol, particularly compared to our measurements here. The inability to extrapolate from these simple laboratory conditions to the ambient environment may be a result of the complexity and competing factors prevalent in ambient aerosol. Future laboratory studies should attempt to replicate more complex aerosol types and link these to past and future ambient studies of N2 O5 uptake. 4.2 Comparison with previous ambient studies The observed values from the steady-state approach are compared with previous studies that have taken place in the USA in Table 4. The observations during RONOCO fall within the range of values previously published, with the most comparable studies being those in Seattle (Bertram et al., 2009), on the Californian coast (Riedel et al., 2012) and in Weld County, Colorado (Wagner et al., 2013). A key similar feature between those studies and RONOCO is the elevated RH conditions, which lead to greater hygroscopic growth of the aerosol in these regions, which results in enhanced aerosol www.atmos-chem-phys.net/15/973/2015/ 985 water content. The chemical composition of the aerosol in California and Colorado was also highly comparable with this study as a mixture of organics, ammonium sulfate and ammonium nitrate was measured. In general, locations in Table 4 where the N2 O5 uptake is suppressed (γ (N2 O5 ) < 0.01) are coincident with drier air mass environments. Furthermore, at the coastal site in California described in Riedel et al. (2012), reduced γ (N2 O5 ) values were observed when continental air flow brought reduced RH compared to the more typically observed values around 70 %. In this study, there is no obvious trend with RH although the lowest average RH value for the uptake analysis was 53 % with the range typically from 60–90 %, which represents relatively moist conditions. These observations point to RH being a major first-order effect on γ (N2 O5 ), due to its association with the aerosol water content, although the number of studies here is relatively limited and biased towards the continental USA. 4.3 Implications The predominance of organic aerosol in this and other polluted regions requires that a thorough understanding of its ability to suppress N2 O5 uptake is required. Current parameterisations developed in the laboratory that were tested in this study were unable to accurately represent the variation in γ (N2 O5 ). A particular challenge relates to how it interacts with other aerosol components that may enhance or suppress uptake. Such mixtures of aerosol components are typical of ambient environments but these are not usually recreated in the laboratory environment. Further ambient studies in a range of environments utilising the ability to directly measure γ (N2 O5 ) using the technique described in Bertram et al. (2009) in combination with detailed measurements of aerosol chemical composition, physical and hygroscopic properties would likely greatly facilitate our understanding of how different chemical mixtures influence N2 O5 uptake. Compared with other environments, the conditions prevalent in this study suggest that uptake of N2 O5 to atmospheric aerosols is relatively efficient. This has implications for aerosol formation in NW Europe as N2 O5 uptake represents a potential source of HNO3 , which combined with the large emissions of ammonia in this region (e.g. Reis et al., 2009), could result in significant ammonium nitrate aerosol formation. This has major implications for regional air quality and climate in NW Europe. Regional (e.g. Riemer et al., 2003) and global (e.g. Bauer et al., 2007; Feng and Penner, 2007) aerosol modelling studies have included the influence of N2 O5 hydrolysis on production of nitrate aerosol. The regional study over southwestern Germany and on the larger European scale showed significant increases in nitrate aerosol throughout the nocturnal boundary layer, dramatically increasing the overall burden in the atmospheric column as a result of N2 O5 uptake. Atmos. Chem. Phys., 15, 973–990, 2015 986 W. T. Morgan et al.: Influence of aerosol chemical composition on N2 O5 uptake If ammonium nitrate is the principal aerosol chemical component (aside from the aerosol water content) that controls N2 O5 uptake, then there is potential for additional feedbacks within this system due to hygroscopic growth associated with ammonium nitrate. Given the semi-volatile properties of ammonium nitrate, whereby it partitions more favourably to the particle phase at reduced temperature and enhanced relative humidity, diurnal and vertical variations in atmospheric temperature can result in increased ammonium nitrate concentrations at nighttime irrespective of N2 O5 uptake. Semi-volatile partitioning of ammonium nitrate has been demonstrated to have a substantial impact on the aerosol direct radiative effect during the daytime (Morgan et al., 2010a; Langridge et al., 2012). A coincident enhancement via N2 O5 uptake during nighttime could amplify such impacts the following day. How such processes combine to impact nitric acid formation and thus the potential for further nitrate aerosol would be an interesting avenue for future research, as nitrate aerosol could serve as a negative feedback on its own formation via the N2 O5 uptake pathway. Such a cycle has implications for assessing the relative proportion of daytime vs. nighttime nitrate formation and its subsequent impacts. In addition, suppression of N2 O5 uptake to aerosol particles would lead to an increase in the lifetime of nitrogen dioxide, which can perturb ozone formation via their associated reactions. Future potential increases in ammonium nitrate content that result from the ongoing significant reductions in SO2 emissions in NW Europe (e.g. Monks et al., 2009) could lead to ammonium nitrate impacting upon atmospheric chemistry via suppression of N2 O5 uptake. Such a suppression perturbs the nighttime nitrogen cycle, which has implications for regional air quality and climate via ozone and aerosol formation, as well as nitrogen deposition in the region. Macintyre and Evans (2010) demonstrated using a global atmospheric model that the strongest sensitivity for NOx removal in the northern extra-tropics, such as NW Europe, was when γ (N2 O5 ) ranged from 0.001–0.02. Given that the observations in this study fall in the upper range of these intermediate values for γ (N2 O5 ), suppression in uptake has the potential for significant perturbation of the nitrogen cycle in the region. Emissions of SO2 have also been decreasing in North America (e.g. Monks et al., 2009), while the emissions landscape in Asia is less clear with a recent decrease in China contrasting with increasing emissions in India, which are the two largest emitters in the region (Klimont et al., 2013). Greater reductions are liable to occur in future in these regions (e.g. Pinder et al., 2007; Klimont et al., 2013). The significant sources of NOx in these regions, combined with the increased availability of ammonia, may lead to an increase in ammonium nitrate content in many polluted environments. As a result, the role that ammonium nitrate plays in nighttime chemistry could increase in importance in these global pollution hot-spots. Consequently, accurate representation of ammonium nitrate in regional and global aerosol models is Atmos. Chem. Phys., 15, 973–990, 2015 required in order to assess the impact of atmospheric aerosols on atmospheric chemistry, air quality and climate. 5 Conclusions The influence of aerosol chemical composition on N2 O5 uptake has been studied based on airborne measurements during nighttime conditions in NW Europe. Aerosol water content and ammonium nitrate were found to be the major controls on N2 O5 , with a suppression of γ (N2 O5 ) in regions containing elevated nitrate concentrations. This study contrasts with previous ambient measurements of N2 O5 uptake, which have generally taken place in low-nitrate environments in the USA. A comparison between γ (N2 O5 ) values derived using the steady-state method developed by Brown and co-workers (Brown et al., 2003, 2006) and a parameterised N2 O5 uptake scheme by Bertram and Thornton (2009) yielded reasonably good agreement in terms of the magnitude and variation in uptake, provided the effect of chloride was neglected. An additional suppression of the parameterised uptake is likely required to fully capture the variation in N2 O5 uptake, which could be achieved via the known suppression by organic aerosol. However, existing parameterisations representing the suppression by organic aerosol were unable to fully represent the variation in N2 O5 uptake. This study represents an important ambient measurement constraint upon laboratory-derived parameterisations that are intended for regional and global chemical transport models. Application of such schemes requires accurate representation of ammonium nitrate formation and the hygroscopic properties of the aerosol, which governs the aerosol water content. Inclusion of such processes in numerical models is required as they have the ability to significantly perturb regional air quality and climate. Data availability Processed data are available through the RONOCO project archive at the British Atmospheric Data Centre (http://badc. nerc.ac.uk/browse/badc/ronoco). Raw data are archived at the University of Manchester and are available on request. The Supplement related to this article is available online at doi:10.5194/acp-15-973-2015-supplement. Acknowledgements. We would like to acknowledge the efforts of the whole RONOCO team during and after the project. Airborne data were obtained using the BAe-146-301 Atmospheric Research Aircraft (ARA) flown by Directflight Ltd and managed by the Facility for Airborne Atmospheric Measurements (FAAM), which is a joint entity of the Natural Environment Research www.atmos-chem-phys.net/15/973/2015/ W. T. Morgan et al.: Influence of aerosol chemical composition on N2 O5 uptake Council (NERC) and the Met Office. The NERC National Centre for Atmospheric Science (NCAS) Atmospheric Measurement Facility (AMF) supported the maintenance of the cToF-AMS. NCAS also supported the development of the data interpretation methods employed here through its Composition Directorate. We thank the British Atmospheric Data Centre (BADC) for access to European Centre for Medium-Range Weather Forecasts (ECMWF) Operational Analysis data, available from http://badc.nerc.ac.uk/data/ecmwf-op/. This work was supported by the NERC RONOCO project NE/F004656/1. Edited by: S. Brown References Abdalmogith, S. S., and Harrison, R. M.: The use of trajectory cluster analysis to examine the long-range transport of secondary inorganic aerosol in the UK, Atmos. Environ., 39, 6686–6695, doi:10.1016/j.atmosenv.2005.07.059, 2005. Anttila, T., Kiendler-Scharr, A., Tillmann, R., and Mentel, T. F.: On the reactive uptake of gaseous compounds by organic-coated aqueous aerosols: theoretical analysis and application to the heterogeneous hydrolysis of N2 O5 , J. Phys. Chem. A, 110, 10435– 10443, doi:10.1021/jp062403c, 2006. Archer-Nicholls, S., Lowe, D., Utembe, S., Allan, J., Zaveri, R. A., Fast, J. D., Hodnebrog, Ø., Denier van der Gon, H., and McFiggans, G.: Gaseous chemistry and aerosol mechanism developments for version 3.5.1 of the online regional model, WRFChem, Geosci. Model Dev., 7, 2557–2579, doi:10.5194/gmd-72557-2014, 2014. Bahreini, R., Ervens, B., Middlebrook, A. M., Warneke, C., de Gouw, J. A., DeCarlo, P. F., Jimenez, J. L., Brock, C. A., Neuman, J. A., Ryerson, T. B., Stark, H., Atlas, E., Brioude, J., Fried, A., Holloway, J. S., Peischl, J., Richter, D., Walega, J., Weibring, P., Wollny, A. G., and Fehsenfeld, F. C.: Organic aerosol formation in urban and industrial plumes near Houston and Dallas, Texas, J. Geophys. Res., 114, D00F16, doi:10.1029/2008JD011493, 2009. Bannan, T. J., Booth, A., Bacak, A., Muller, J. B. A., Leather, K. E., Le Breton, M., Jones, B., Young, D., Coe, H., Allan, J., Visser, S., Lee, J., Holmes, R., Whalley, L. K., Sharp, T., Stone, D., Heard, D. E., Flemming, Z., Shallcross, D. E., and Percival, C. J.: The first UK measurements of nitryl chloride using a chemical ionisation mass spectrometer in central London in the summer of 2012, and an investigation of the role of Cl atom oxidation, submitted, 2014. Bauer, S. E., Koch, D., Unger, N., Metzger, S. M., Shindell, D. T., and Streets, D. G.: Nitrate aerosols today and in 2030: a global simulation including aerosols and tropospheric ozone, Atmos. Chem. Phys., 7, 5043–5059, doi:10.5194/acp-7-5043-2007, 2007. Bertram, T. H. and Thornton, J. A.: Toward a general parameterization of N2 O5 reactivity on aqueous particles: the competing effects of particle liquid water, nitrate and chloride, Atmos. Chem. Phys., 9, 8351–8363, doi:10.5194/acp-9-8351-2009, 2009. Bertram, T. H., Thornton, J. A., Riedel, T. P., Middlebrook, A. M., Bahreini, R., Bates, T. S., Quinn, P. K., and Coffman, D. J.: Direct observations of N2 O5 reactivity on ambient aerosol particles, www.atmos-chem-phys.net/15/973/2015/ 987 Geophys. Res. Lett., 36, L19803, doi:10.1029/2009GL040248, 2009. Boucher, O., Randall, D., Artaxo, P., Bretherton, C., Feingold, G., Forster, P., Kerminen, V.-M., Kondo, Y., Liao, H., Lohmann, U., Rasch, P., Satheesh, S., Sherwood, S., Stevens, B., and Zhang, X.: Clouds and aerosols, in: Climate Change 2013: The Physical Science Basis. Contribution of Working Group I to the Fifth Assessment Report of the Intergovernmental Panel on Climate Change, edited by: Stocker, T. F., Qin, D., Plattner, G.-K., Tignor, M., Allen, S. K., Boschung, J., Nauels, A., Xia, Y., Bex, V., and Midgley, P. M., Cambridge University Press, Cambridge, UK and New York, NY, USA, 571–657, 2013. Brown, S. S. and Stutz, J.: Nighttime radical observations and chemistry., Chem. Soc. Rev., 41, 6405–6447, doi:10.1039/c2cs35181a, 2012. Brown, S. S., Stark, H., and Ravishankara, A. R.: Applicability of the steady state approximation to the interpretation of atmospheric observations of NO3 and N2 O5 , J. Geophys. Res., 108, 4539, doi:10.1029/2003JD003407, 2003. Brown, S. S., Ryerson, T. B., Wollny, A. G., Brock, C. A., Peltier, R., Sullivan, A. P., Weber, R. J., Dubé, W. P., Trainer, M., Meagher, J. F., Fehsenfeld, F. C., and Ravishankara, A. R.: Variability in nocturnal nitrogen oxide processing and its role in regional air quality, Science, 311, 67–70, doi:10.1126/science.1120120, 2006. Brown, S. S., Dubé, W. P., Fuchs, H., Ryerson, T. B., Wollny, A. G., Brock, C. A., Bahreini, R., Middlebrook, A. M., Neuman, J. A., Atlas, E., Roberts, J. M., Osthoff, H. D., Trainer, M., Fehsenfeld, F. C., and Ravishankara, A. R.: Reactive uptake coefficients for N2 O5 determined from aircraft measurements during the Second Texas Air Quality Study: comparison to current model parameterizations, J. Geophys. Res., 114, D00F10, doi:10.1029/2008JD011679, 2009. Canagaratna, M. R., Jayne, J. T., Jimenez, J. L., Allan, J. D., Alfarra, M. R., Zhang, Q., Onasch, T. B., Drewnick, F., Coe, H., Middlebrook, A., Delia, A., Williams, L. R., Trimborn, A. M., Northway, M. J., DeCarlo, P. F., Kolb, C. E., Davidovits, P., and Worsnop, D. R.: Chemical and microphysical characterization of ambient aerosols with the Aerodyne aerosol mass spectrometer, Mass Spectrom. Rev., 26, 185–222, doi:10.1002/mas.20115, 2007. Canagaratna, M. R., Jimenez, J. L., Kroll, J. H., Chen, Q., Kessler, S. H., Massoli, P., Hildebrandt Ruiz, L., Fortner, E., Williams, L. R., Wilson, K. R., Surratt, J. D., Donahue, N. M., Jayne, J. T., and Worsnop, D. R.: Elemental ratio measurements of organic compounds using aerosol mass spectrometry: characterization, improved calibration, and implications, Atmos. Chem. Phys., 15, 253–272, doi:10.5194/acp-15-253-2015, 2015. Chang, W. L., Bhave, P. V., Brown, S. S., Riemer, N., Stutz, J., and Dabdub, D.: Heterogeneous atmospheric chemistry, ambient measurements, and model calculations of N2 O5 : a review, Aerosol Sci. Tech., 45, 665–695, doi:10.1080/02786826.2010.551672, 2011. Charlson, R. J., Schwartz, S. E., Hales, J. M., Cess, R. D., Coakley, J. A., Hansen, J. E., and Hofmann, D. J.: Climate forcing by anthropogenic aerosols, Science, 255, 423–430, doi:10.1126/science.255.5043.423, 1992. Cubison, M. J., Alfarra, M. R., Allan, J., Bower, K. N., Coe, H., McFiggans, G. B., Whitehead, J. D., Williams, P. I., Zhang, Q., Atmos. Chem. Phys., 15, 973–990, 2015 988 W. T. Morgan et al.: Influence of aerosol chemical composition on N2 O5 uptake Jimenez, J. L., Hopkins, J., and Lee, J.: The characterisation of pollution aerosol in a changing photochemical environment, Atmos. Chem. Phys., 6, 5573–5588, doi:10.5194/acp-6-5573-2006, 2006. Dentener, F. J. and Crutzen, P. J.: Reaction of N2 O5 on tropospheric aerosols: impact on the global distributions of NOx , O3 , and OH, J. Geophys. Res., 98, 7149, doi:10.1029/92JD02979, 1993. Di Carlo, P., Aruffo, E., Busilacchio, M., Giammaria, F., DariSalisburgo, C., Biancofiore, F., Visconti, G., Lee, J., Moller, S., Reeves, C. E., Bauguitte, S., Forster, G., Jones, R. L., and Ouyang, B.: Aircraft based four-channel thermal dissociation laser induced fluorescence instrument for simultaneous measurements of NO2, total peroxy nitrate, total alkyl nitrate, and HNO3, Atmos. Meas. Tech., 6, 971–980, doi:10.5194/amt-6-971-2013, 2013. Drewnick, F., Hings, S. S., DeCarlo, P., Jayne, J. T., Gonin, M., Fuhrer, K., Weimer, S., Jimenez, J. L., Demerjian, K. L., Borrmann, S., and Worsnop, D. R.: A new time-of-flight aerosol mass spectrometer (TOF-AMS) instrument description and first field deployment, Aerosol Sci. Tech., 39, 637–658, doi:10.1080/02786820500182040, 2005. Evans, M. J. and Jacob, D. J.: Impact of new laboratory studies of N2 O5 hydrolysis on global model budgets of tropospheric nitrogen oxides, ozone, and OH, Geophys. Res. Lett., 32, 3–6, doi:10.1029/2005GL022469, 2005. Feng, Y. and Penner, J. E.: Global modeling of nitrate and ammonium: interaction of aerosols and tropospheric chemistry, J. Geophys. Res., 112, D01304, doi:10.1029/2005JD006404, 2007. Folkers, M., Mentel, T. F., and Wahner, A.: Influence of an organic coating on the reactivity of aqueous aerosols probed by the heterogeneous hydrolysis of N2 O5 , Geophys. Res. Lett., 30, 2–5, doi:10.1029/2003GL017168, 2003. Foltescu, V., Selin, E., and Below, M.: Corrections for particle losses and sizing errors during aircraft aerosol sampling using a rosemount inlet and the PMS LAS-X, Atmos. Environ., 29, 449–453, doi:10.1016/1352-2310(94)00258-M, 1995. Gaston, C. J., Thornton, J. A., and Ng, N. L.: Reactive uptake of N2O5 to internally mixed inorganic and organic particles: the role of organic carbon oxidation state and inferred organic phase separations, Atmos. Chem. Phys., 14, 5693–5707, doi:10.5194/acp-14-5693-2014, 2014. Griffiths, P. T., Badger, C. L., Cox, R. A., Folkers, M., Henk, H. H., and Mentel, T. F.: Reactive uptake of N2 O5 by aerosols containing dicarboxylic acids. Effect of particle phase, composition, and nitrate content, J. Phys. Chem. A, 113, 5082–5090, doi:10.1021/jp8096814, 2009. Gysel, M., Crosier, J., Topping, D. O., Whitehead, J. D., Bower, K. N., Cubison, M. J., Williams, P. I., Flynn, M. J., McFiggans, G. B., and Coe, H.: Closure study between chemical composition and hygroscopic growth of aerosol particles during TORCH2, Atmos. Chem. Phys., 7, 6131–6144, doi:10.5194/acp-7-61312007, 2007. Haywood, J. and Boucher, O.: Estimates of the direct and indirect radiative forcing due to tropospheric aerosols: a review, Rev. Geophys., 38, 513–544, doi:10.1029/1999RG000078, 2000. Hering, S. V., Stolzenburg, M. R., Quant, F. R., Oberreit, D. R., and Keady, P. B.: A laminar-flow, Water-based Condensation Particle Counter (WCPC), Aerosol Sci. Tech., 39, 659–672, doi:10.1080/02786820500182123, 2005. Atmos. Chem. Phys., 15, 973–990, 2015 Jenkin, M. E., Saunders, S. M., Wagner, V., and Pilling, M. J.: Protocol for the development of the Master Chemical Mechanism, MCM v3 (Part B): tropospheric degradation of aromatic volatile organic compounds, Atmos. Chem. Phys., 3, 181–193, doi:10.5194/acp-3-181-2003, 2003. Kennedy, O. J., Ouyang, B., Langridge, J. M., Daniels, M. J. S., Bauguitte, S., Freshwater, R., McLeod, M. W., Ironmonger, C., Sendall, J., Norris, O., Nightingale, R., Ball, S. M., and Jones, R. L.: An aircraft based three channel broadband cavity enhanced absorption spectrometer for simultaneous measurements of NO3, N2O5 and NO2 , Atmos. Meas. Tech., 4, 1759–1776, doi:10.5194/amt-4-1759-2011, 2011. Klimont, Z., Smith, S. J., and Cofala, J.: The last decade of global anthropogenic sulfur dioxide: 2000–2011 emissions, Environ. Res. Lett., 8, 14003, doi:10.1088/1748-9326/8/1/014003, 2013. Langridge, J. M., Lack, D., Brock, C. a., Bahreini, R., Middlebrook, A. M., Neuman, J. A., Nowak, J. B., Perring, A. E., Schwarz, J. P., Spackman, J. R., Holloway, J. S., Pollack, I. B., Ryerson, T. B., Roberts, J. M., Warneke, C., de Gouw, J. a., Trainer, M. K., and Murphy, D. M.: Evolution of aerosol properties impacting visibility and direct climate forcing in an ammonia-rich urban environment, J. Geophys. Res., 117, D00V11, doi:10.1029/2011JD017116, 2012. Liu, P. S. K., Leaitch, W. R., Strapp, J. W., and Wasey, M. A.: Response of particle measuring systems airborne ASASP and PCASP to NaCl and latex particles, Aerosol Sci. Tech., 16, 83– 95, doi:10.1080/02786829208959539, 1992. Liu, D., Allan, J., Whitehead, J., Young, D., Flynn, M., Coe, H., McFiggans, G., Fleming, Z. L., and Bandy, B.: Ambient black carbon particle hygroscopic properties controlled by mixing state and composition, Atmos. Chem. Phys., 13, 2015–2029, doi:10.5194/acp-13-2015-2013, 2013. Lowe, D., Topping, D., and McFiggans, G.: Modelling multi-phase halogen chemistry in the remote marine boundary layer: investigation of the influence of aerosol size resolution on predicted gas- and condensed-phase chemistry, Atmos. Chem. Phys., 9, 4559–4573, doi:10.5194/acp-9-4559-2009, 2009. Macintyre, H. L. and Evans, M. J.: Sensitivity of a global model to the uptake of N2 O5 by tropospheric aerosol, Atmos. Chem. Phys., 10, 7409–7414, doi:10.5194/acp-10-7409-2010, 2010. Matthew, B. M., Middlebrook, A. M., and Onasch, T. B.: Collection efficiencies in an Aerodyne aerosol mass spectrometer as a function of particle phase for laboratory generated aerosols, Aerosol Sci. Tech., 42, 884–898, doi:10.1080/02786820802356797, 2008. McFiggans, G., Alfarra, M. R., Allan, J., Bower, K., Coe, H., Cubison, M., Topping, D., Williams, P., Decesari, S., Facchini, C., and Fuzzi, S.: Simplification of the representation of the organic component of atmospheric particulates, Faraday Discuss., 130, 341–362, doi:10.1039/b419435g, 2005. McMeeking, G. R., Bart, M., Chazette, P., Haywood, J. M., Hopkins, J. R., McQuaid, J. B., Morgan, W. T., Raut, J.-C., Ryder, C. L., Savage, N., Turnbull, K., and Coe, H.: Airborne measurements of trace gases and aerosols over the London metropolitan region, Atmos. Chem. Phys., 12, 5163–5187, doi:10.5194/acp12-5163-2012, 2012. McNeill, V. F., Patterson, J., Wolfe, G. M., and Thornton, J. A.: The effect of varying levels of surfactant on the reactive uptake of www.atmos-chem-phys.net/15/973/2015/ W. T. Morgan et al.: Influence of aerosol chemical composition on N2 O5 uptake N2 O5 to aqueous aerosol, Atmos. Chem. Phys., 6, 1635–1644, doi:10.5194/acp-6-1635-2006, 2006. Mentel, T. F., Sohn, M., and Wahner, A.: Nitrate effect in the heterogeneous hydrolysis of dinitrogen pentoxide on aqueous aerosols, Phys. Chem. Chem. Phys., 1, 5451–5457, doi:10.1039/a905338g, 1999. Middlebrook, A. M., Bahreini, R., Jimenez, J. L., and Canagaratna, M. R.: Evaluation of composition-dependent collection efficiencies for the Aerodyne aerosol mass spectrometer using field data, Aerosol Sci. Tech., 46, 258–271, doi:10.1080/02786826.2011.620041, 2012. Monks, P., Granier, C., Fuzzi, S., Stohl, A., Williams, M., Akimoto, H., Amann, M., Baklanov, A., Baltensperger, U., Bey, I., Blake, N., Blake, R., Carslaw, K., Cooper, O., Dentener, F., Fowler, D., Fragkou, E., Frost, G., Generoso, S., Ginoux, P., Grewe, V., Guenther, A., Hansson, H., Henne, S., Hjorth, J., Hofzumahaus, A., Huntrieser, H., Isaksen, I., Jenkin, M., Kaiser, J., Kanakidou, M., Klimont, Z., Kulmala, M., Laj, P., Lawrence, M., Lee, J., Liousse, C., Maione, M., McFiggans, G., Metzger, A., Mieville, A., Moussiopoulos, N., Orlando, J., O’Dowd, C., Palmer, P., Parrish, D., Petzold, A., Platt, U., Pöschl, U., Prévôt, A., Reeves, C., Reimann, S., Rudich, Y., Sellegri, K., Steinbrecher, R., Simpson, D., ten Brink, H., Theloke, J., van der Werf, G., Vautard, R., Vestreng, V., Vlachokostas, C., and von Glasow, R.: Atmospheric composition change: global and regional air quality, Atmos. Environ., 43, 5268–5350, doi:10.1016/j.atmosenv.2009.08.021, 2009. Morgan, W. T., Allan, J. D., Bower, K. N., Capes, G., Crosier, J., Williams, P. I., and Coe, H.: Vertical distribution of sub-micron aerosol chemical composition from North-Western Europe and the North-East Atlantic, Atmos. Chem. Phys., 9, 5389–5401, doi:10.5194/acp-9-5389-2009, 2009. Morgan, W. T., Allan, J. D., Bower, K. N., Esselborn, M., Harris, B., Henzing, J. S., Highwood, E. J., Kiendler-Scharr, A., McMeeking, G. R., Mensah, A. A., Northway, M. J., Osborne, S., Williams, P. I., Krejci, R., and Coe, H.: Enhancement of the aerosol direct radiative effect by semi-volatile aerosol components: airborne measurements in North-Western Europe, Atmos. Chem. Phys., 10, 8151–8171, doi:10.5194/acp-10-81512010, 2010a. Morgan, W. T., Allan, J. D., Bower, K. N., Highwood, E. J., Liu, D., McMeeking, G. R., Northway, M. J., Williams, P. I., Krejci, R., and Coe, H.: Airborne measurements of the spatial distribution of aerosol chemical composition across Europe and evolution of the organic fraction, Atmos. Chem. Phys., 10, 4065–4083, doi:10.5194/acp-10-4065-2010, 2010b. Mozurkewich, M. and Calvert, J. G.: Reaction probability of N2 O5 on aqueous aerosols, J. Geophys. Res., 93, 15889, doi:10.1029/JD093iD12p15889, 1988. Ng, N. L., Canagaratna, M. R., Zhang, Q., Jimenez, J. L., Tian, J., Ulbrich, I. M., Kroll, J. H., Docherty, K. S., Chhabra, P. S., Bahreini, R., Murphy, S. M., Seinfeld, J. H., Hildebrandt, L., Donahue, N. M., DeCarlo, P. F., Lanz, V. A., Prévôt, A. S. H., Dinar, E., Rudich, Y., and Worsnop, D. R.: Organic aerosol components observed in Northern Hemispheric datasets from Aerosol Mass Spectrometry, Atmos. Chem. Phys., 10, 4625– 4641, doi:10.5194/acp-10-4625-2010, 2010. Osthoff, H. D., Roberts, J. M., Ravishankara, A. R., Williams, E. J., Lerner, B. M., Sommariva, R., Bates, T. S., Coffman, D., www.atmos-chem-phys.net/15/973/2015/ 989 Quinn, P. K., Dibb, J. E., Stark, H., Burkholder, J. B., Talukdar, R. K., Meagher, J., Fehsenfeld, F. C., and Brown, S. S.: High levels of nitryl chloride in the polluted subtropical marine boundary layer, Nat. Geosci., 1, 324–328, doi:10.1038/ngeo177, 2008. Pinder, R. W., Adams, P. J., and Pandis, S. N.: Ammonia emission controls as a cost-effective strategy for reducing atmospheric particulate matter in the Eastern United States, Environ. Sci. Technol., 41, 380–386, doi:10.1021/es060379a, 2007. Putaud, J.-P., Raes, F., Van Dingenen, R., Brüggemann, E., Facchini, M.-C., Decesari, S., Fuzzi, S., Gehrig, R., Hüglin, C., Laj, P., Lorbeer, G., Maenhaut, W., Mihalopoulos, N., Müller, K., Querol, X., Rodriguez, S., Schneider, J., Spindler, G., ten Brink, H., Tørseth, K., and Wiedensohler, A.: A European aerosol phenomenology 2: chemical characteristics of particulate matter at kerbside, urban, rural and background sites in Europe, Atmos. Environ., 38, 2579–2595, doi:10.1016/j.atmosenv.2004.01.041, 2004. Reis, S., Pinder, R. W., Zhang, M., Lijie, G., and Sutton, M. A.: Reactive nitrogen in atmospheric emission inventories, Atmos. Chem. Phys., 9, 7657–7677, doi:10.5194/acp-9-7657-2009, 2009. Riedel, T. P., Bertram, T. H., Ryder, O. S., Liu, S., Day, D. A., Russell, L. M., Gaston, C. J., Prather, K. A., and Thornton, J. A.: Direct N2O5 reactivity measurements at a polluted coastal site, Atmos. Chem. Phys., 12, 2959–2968, doi:10.5194/acp-12-29592012, 2012. Riemer, N., Vogel, H., Vogel, B., Schell, B., Ackermann, I., Kessler, C., and Hass, H.: Impact of the heterogeneous hydrolysis of N2 O5 on chemistry and nitrate aerosol formation in the lower troposphere under photosmog conditions, J. Geophys. Res., 108, 4144, doi:10.1029/2002JD002436, 2003. Riemer, N., Vogel, H., Vogel, B., Anttila, T., Kiendler-Scharr, A., and Mentel, T. F.: Relative importance of organic coatings for the heterogeneous hydrolysis of N2 O5 during summer in Europe, J. Geophys. Res., 114, 1–14, doi:10.1029/2008JD011369, 2009. Rosenberg, P. D., Dean, A. R., Williams, P. I., Dorsey, J. R., Minikin, A., Pickering, M. A., and Petzold, A.: Particle sizing calibration with refractive index correction for light scattering optical particle counters and impacts upon PCASP and CDP data collected during the Fennec campaign, Atmos. Meas. Tech., 5, 1147–1163, doi:10.5194/amt-5-1147-2012, 2012. Stokes, R. H. and Robinson, R. A.: Interactions in aqueous nonelectrolyte solutions. I. Solute–solvent equilibria, J. Phys. Chem.-US, 70, 2126–2131, doi:10.1021/j100879a010, 1966. Stone, D., Evans, M. J., Walker, H., Ingham, T., Vaughan, S., Ouyang, B., Kennedy, O. J., McLeod, M. W., Jones, R. L., Hopkins, J., Punjabi, S., Lidster, R., Hamilton, J. F., Lee, J. D., Lewis, A. C., Carpenter, L. J., Forster, G., Oram, D. E., Reeves, C. E., Bauguitte, S., Morgan, W., Coe, H., Aruffo, E., DariSalisburgo, C., Giammaria, F., Di Carlo, P., and Heard, D. E.: Radical chemistry at night: comparisons between observed and modelled HOx ,NO3 and N2 O5 during the RONOCO project, Atmos. Chem. Phys., 14, 1299–1321, doi:10.5194/acp-14-12992014, 2014. Strapp, J. W., Leaitch, W. R., and Liu, P. S. K.: Hydrated and dried aerosol-size-distribution measurements from the particle measuring systems FSSP-300 probe and the deiced PCASP-100x probe, J. Atmos. Ocean. Tech., 9, 548–555, doi:10.1175/15200426(1992)009<0548:HADASD>2.0.CO;2, 1992. Atmos. Chem. Phys., 15, 973–990, 2015 990 W. T. Morgan et al.: Influence of aerosol chemical composition on N2 O5 uptake Thornton, J. A. and Abbatt, J. P. D.: N2 O5 reaction on submicron sea salt aerosol: kinetics, products, and the effect of surface active organics, J. Phys. Chem. A, 109, 10004–10012, doi:10.1021/jp054183t, 2005. Thornton, J. A., Kercher, J. P., Riedel, T. P., Wagner, N. L., Cozic, J., Holloway, J. S., Dubé, W. P., Wolfe, G. M., Quinn, P. K., Middlebrook, A. M., Alexander, B., and Brown, S. S.: A large atomic chlorine source inferred from mid-continental reactive nitrogen chemistry., Nature, 464, 271–274, doi:10.1038/nature08905, 2010. Topping, D. O., McFiggans, G. B., and Coe, H.: A curved multicomponent aerosol hygroscopicity model framework: Part 1 – Inorganic compounds, Atmos. Chem. Phys., 5, 1205–1222, doi:10.5194/acp-5-1205-2005, 2005a. Topping, D. O., McFiggans, G. B., and Coe, H.: A curved multicomponent aerosol hygroscopicity model framework: Part 2 – Including organic compounds, Atmos. Chem. Phys., 5, 1223–1242, doi:10.5194/acp-5-1223-2005, 2005b. Trembath, J., Bart, M., and Brooke, J.: FAAM Technical Note 01: Efficiencies of Modified Rosemount Housings for Sampling Aerosol on a Fast Atmospheric Research Aircraft, Tech. Rep. December, Facility for Airborne Atmospheric Measurement (FAAM), available at: http://www.faam.ac.uk/index.php/ component/docman/doc_download/1673-inlet-efficiency (last access: 27 July 2014), 2012. Ulbrich, I. M., Canagaratna, M. R., Zhang, Q., Worsnop, D. R., and Jimenez, J. L.: Interpretation of organic components from Positive Matrix Factorization of aerosol mass spectrometric data, Atmos. Chem. Phys., 9, 2891–2918, doi:10.5194/acp-9-2891-2009, 2009. Van Doren, J. M., Watson, L. R., Davidovits, P., Worsnop, D. R., Zahniser, M. S., and Kolb, C. E.: Temperature dependence of the uptake coefficients of nitric acid, hydrochloric acid and nitrogen oxide (N2 O5 ) by water droplets, J. Phys. Chem.-US, 94, 3265– 3269, doi:10.1021/j100371a009, 1990. Wagner, N. L., Riedel, T. P., Young, C. J., Bahreini, R., Brock, C. A., Dubé, W. P., Kim, S., Middlebrook, A. M., Öztürk, F., Roberts, J. M., Russo, R., Sive, B., Swarthout, R., Thornton, J. A., VandenBoer, T. C., Zhou, Y., and Brown, S. S.: N2 O5 uptake coefficients and nocturnal NO2 removal rates determined from ambient wintertime measurements, J. Geophys. Res., 118, 9331–9350, doi:10.1002/jgrd.50653, 2013. Atmos. Chem. Phys., 15, 973–990, 2015 Wahner, A., Mentel, T. F., Sohn, M., and Stier, J.: Heterogeneous reaction of N2 O5 on sodium nitrate aerosol, J. Geophys. Res., 103, 31103, doi:10.1029/1998JD100022, 1998. Wang, S. C. and Flagan, R. C.: Scanning electrical mobility spectrometer, Aerosol Sci. Tech., 13, 230–240, doi:10.1080/02786829008959441, 1990. Watson, L. A., Shallcross, D. E., Utembe, S. R., and Jenkin, M. E.: A Common Representative Intermediates (CRI) mechanism for VOC degradation. Part 2: Gas phase mechanism reduction, Atmos. Environ. 42, 7196–7204, doi:10.1016/j.atmosenv.2008.07.034, 2008. Wayne, R., Barnes, I., Biggs, P., Burrows, J., Canosa-Mas, C., Hjorth, J., Le Bras, G., Moortgat, G., Perner, D., Poulet, G., Restelli, G., and Sidebottom, H.: The nitrate radical: physics, chemistry, and the atmosphere, Atmos. Environ. A-Gen., 25, 1– 203, doi:10.1016/0960-1686(91)90192-A, 1991. Wiedensohler, A., Birmili, W., Nowak, A., Sonntag, A., Weinhold, K., Merkel, M., Wehner, B., Tuch, T., Pfeifer, S., Fiebig, M., Fjäraa, A. M., Asmi, E., Sellegri, K., Depuy, R., Venzac, H., Villani, P., Laj, P., Aalto, P., Ogren, J. A., Swietlicki, E., Williams, P., Roldin, P., Quincey, P., Hüglin, C., Fierz-Schmidhauser, R., Gysel, M., Weingartner, E., Riccobono, F., Santos, S., Grüning, C., Faloon, K., Beddows, D., Harrison, R., Monahan, C., Jennings, S. G., O’Dowd, C. D., Marinoni, A., Horn, H.-G., Keck, L., Jiang, J., Scheckman, J., McMurry, P. H., Deng, Z., Zhao, C. S., Moerman, M., Henzing, B., de Leeuw, G., Löschau, G., and Bastian, S.: Mobility particle size spectrometers: harmonization of technical standards and data structure to facilitate high quality long-term observations of atmospheric particle number size distributions, Atmos. Meas. Tech., 5, 657–685, doi:10.5194/amt5-657-2012, 2012. www.atmos-chem-phys.net/15/973/2015/
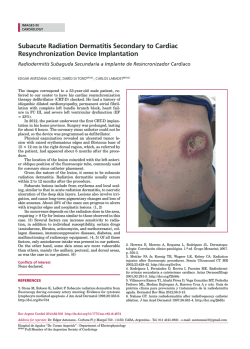
© Copyright 2026