
SARC Report for Vacaville High - Vacaville Unified School District
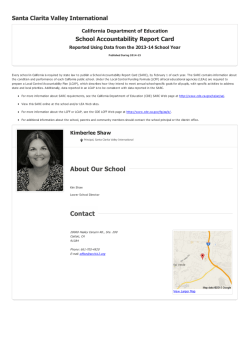
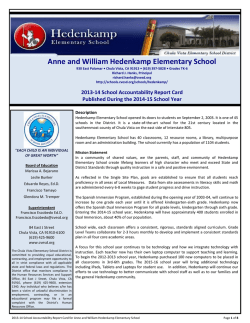
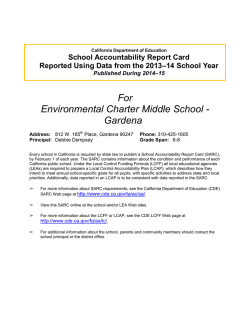
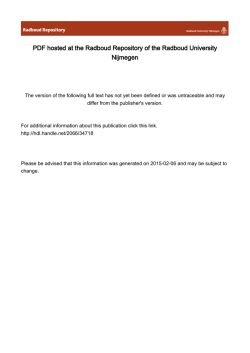
Vacaville High
California Department of Education
School Accountability Report Card
Reported Using Data from the 2013-14 School Year
Published During 2014-15
Every school in California is required by state law to publish a School Accountability Report Card (SARC), by February 1 of each year. The SARC contains information about
the condition and performance of each California public school. Under the Local Control Funding Formula (LCFF) all local educational agencies (LEAs) are required to
prepare a Local Control Accountability Plan (LCAP), w hich describes how they intend to meet annual school-specific goals for all pupils, w ith specific activities to address
state and local priorities. Additionally, data reported in an LCAP is to be consistent w ith data reported in the SARC.
For more information about SARC requirements, see the California Department of Education (CDE) SARC W eb page at http://w w w .cde.ca.gov/ta/ac/sa/.
View this SARC online at the school and/or LEA W eb sites.
For more information about the LCFF or LCAP, see the CDE LCFF W eb page at http://w w w .cde.ca.gov/fg/aa/lc/.
For additional information about the school, parents and community members should contact the school principal or the district office.
Ed Santopadre, Principal
Principal, Vacaville High
About Our School
Contact
100 Monte Vista Ave.
Vacaville, CA
95688-3829
Phone: 707-453-6011
E-mail: [email protected]
View Larger Map
2013-14 SARC - Vacaville High
About This School
Contact Information - Most Recent Year
School
District
School Name
Vacaville High
District Name
Vacaville Unified
Street
100 Monte Vista Ave.
Phone Number
(707) 453-6117
City, State, Zip
Vacaville, Ca, 95688-3829
Web Site
http://w w w .vacavilleusd.org
Phone Number
707-453-6011
Superintendent
First Name
Ken
Principal
Ed Santopadre, Principal
Superintendent
Last Name
Jacopetti
E-mail Address
[email protected]
E-mail Address
[email protected]
Web Site
vhs.schoolloop.com
Last updated: 1/27/2015
County-District48705734837803
School (CDS) Code
School Description and Mission Statement (Most Recent Year)
Bulldog Family,
Thank you for taking just a few minutes of your time to read about our recent progress.
Every six years, all California schools are evaluated by an accreditation committee (W ASC). In preparation for this evaluation, VHS began its ow n “self-assessment”
process. W hen w e reexamined our educational mission and goals five years ago, w e recognized that they w ere not meeting the needs of our students
sufficiently. Our educational mission had grow n too complicated and our school goals w ere not suited to 21st century learning needs.
Therefore, w e sought the input of our students, parents, teachers, and other stakeholders in redefining our mission and goals. Regarding our mission, w e needed
to simplify. After much thought and debate, w e revised our mission to state simply that “Learning is our core purpose.”
As the poet Ralph W aldo Emerson once w rote “Be an opener of doors for such as come after thee.” As educators, opening the doors of learning is our true
educational mission. It is our job to open as many doors as possible for students so that they may find new opportunities w ithin themselves and in the w orld
around them.
For each student, that door may take a different form. One door may lead to a four-year college. Another door may lead to a career pathw ay, such as the
Medical Sciences or Biotechnology. No matter w hich door a student chooses, they can only be prepared for w hat is behind it if they have received a rigorous
education. Therefore, ensuring maximum rigor at VHS became our first school goal.
If our students choose a path that leads to a four-year college, w e must provide the guidance to get them there. Our counselors w ork closely w ith all our
students to make certain that they are meeting the a-g requirements necessary to go to college. In recent years, w e have increased the percentage of students
meeting a-g requirements from 39% to 49%. Our ultimate goal is to have at least 70% of our students meeting a-g requirements, providing them w ith that
direct pathw ay to college.
To enable their success once in college, w e have elevated the rigor of existing courses. W e have provided professional development to our teachers in this area.
W e have w orked w ith instructional specialists to implement Explicit Direct Instruction strategies and daily learning objectives. Teachers w ork together during
collaborative time to increase rigor in their classrooms.
Rigor has also intensified at VHS as a result of our expanded number of honors and advanced placement courses. W e are offering more rigorous course
Page 2 of 24
2013-14 SARC - Vacaville High
sequences, such as starting Biology in the ninth grade, w hich allow s for more advanced science options later. In AP courses in 2013, w e took more tests (396),
passed more tests (246), w ith a higher percentage passed (62%). Compare that to 2007 w hen w e took 280 tests, passed 132 of them for a 47% pass rate.
This trend is likely to continue since w e have recently added seven new AP courses. One curricular area in w hich our grow th in rigor is most evident is in
mathematics. Like many schools across the country, our students have struggled in math. After analyzing student achievement data, it w as clear that major
changes w ere necessary. Therefore, improving student achievement in math became another school goal.
In the past five years, the math department has undergone a nearly complete makeover, w ith the hiring of many new math teachers. This department has
embraced many new teaching methods and practices that allow more students to be successful.
Since improving achievement in math became a major educational goal, student achievement has increased in all major areas and on all major assessments,
including the CAHSEE, CST, AP, SAT, etc. W e have also increased the number of our students taking more advanced math later in their high school experience.
This additional experience in math enables our students to be better prepared for college or other post-secondary options. W e still have a long w ay to go and
believe this w ill continue to be a major area of focus.
W hile being prepared for college is important, not all students are going to choose that path. Some students seek options that allow them to establish a
meaningful career. Therefore, it is our goal that at least 30% of our students follow a CTE (Career and Technical Education) pathw ay in their four years at VHS.
Upon graduation, these students w ill have acquired the depth of know ledge and skills linked w ith specific post-secondary programs that w ill lead to a certificate or
degree and/or career. W e currently feature pathw ays in Medical Science, Biotechnology, Engineering Design, and soon Culinary Arts. W e are also exploring
possible pathw ays, including Agricultural Resources. All of these pathw ays are contingent upon our students and business community’s interests and needs.
In order for VHS to claim that learning is our core purpose, w e must make sure that all of our students are succeeding. As part of our self assessment, it w as
evident that an achievement gap existed betw een our general school population and our English Language Learners and Special Education students.
Therefore our next school goal sought to close this gap. Over the past five years, w e have implemented many curricular and program changes in this effort. For
both of these groups, w e have expanded our use of Co-Teaching classes. These classes have been successful because our students have access to both a
content specialist and a strategies specialist.
In addition to the specific training given to teachers in Co-Teaching classrooms, VHS has offered additional professional development for all our teachers on how
best to close this achievement gap. W orkshops on the use of common formative assessments and technology have allow ed teachers to more quickly identify
struggling students. Faster identification allow s for greater re-teaching time in order to achieve mastery. In the past three years, w e have reclassified 105 English
Learners. This is more than double the number of students (43) w e reclassified in the three years prior to that.
Faster identification is the key to helping all of our students. One group of students w e need to better identify and support is our low income students. W e must
better advertise the reduced price meal applications. The guidelines are generous and w e receive additional funding for students w ho qualify. These students
often face larger challenges and therefore need support earlier. One program w e hope w ill help is AVID, a college readiness program.
W e are also w orking in conjunction w ith the AP College Board Capstone program, w hich provides students w ith an opportunity to acquire the core academic skills
necessary for successful college completion. Finally, w e have included more students (491 in 2013) in the Practice SAT test (PSAT) and this allow s more students
to be identified as AP ready. W e w ill have students taking and passing more AP classes and tests.
As w e look to defining VHS for the next six years, learning w ill continue to be our core purpose. W e w ill also continue to be guided by Emerson’s appeal to be
“an opener of doors.” W e w ant to ensure as many doors are open as possible for our students. Thus, in the next few w eeks, w e w ill be sending out a survey
asking for your recommendations on the direction of our future grow th.
W e w ant to open the right doors for VHS students. Our new state funding requirements mandate that w e connect all dollars spent w ith all students’ learning.
The plan is called Local Control Accountability Plan, or LCAP for short. W e need the assistance of staff, students, parents, and community members to prioritize
our needs and connect them to our funding.
Please give us your feedback. W hich doors should w e be opening for your students?
Last updated: 1/27/2015
Page 3 of 24
2013-14 SARC - Vacaville High
Page 4 of 24
2013-14 SARC - Vacaville High
Student Enrollment by Grade Level (School Year 2013-14)
Grade Level
Number of Students
600
Grade 9
557
Grade 10
525
Grade 11
488
Grade 12
424
Total Enrollment
1994
500
400
300
200
100
0
Grade 9
Grade 10
Grade 11
Grade 12
Last updated: 1/27/2015
Student Enrollment by Student Group (School Year 2013-14)
Group
Percent of Total Enrollment
Black or African American
7.1
American Indian or Alaska Native
0.9
Asian
2.4
Filipino
2.4
Hispanic or Latino
28.8
Native Haw aiian or Pacific Islander
1.0
2% 7%
W hite
54.3
Tw o or More Races
2.6
Socioeconomically Disadvantaged
31.1
English Learners
3.0
Students w ith Disabilities
8.7
2%
2%
28%
Black or African 54%
American
American Indian or Alaska Native
Asian
1%
Filipino
Hispanic or Latino
Native Hawaiian or Pacific Islander
White
Two or More Races
Last updated: 1/27/2015
Page 5 of 24
2013-14 SARC - Vacaville High
A. Conditions of Learning
State Priority: Basic
The SARC provides the follow ing information relevant to the Basic State Priority (Priority 1):
Degree to w hich teachers are appropriately assigned and fully credentialed in the subject area and for the pupils they are teaching;
Pupils have access to standards-aligned instructional materials; and
School facilities are maintained in good repair.
Teacher Credentials
Teachers
School
201213
201314
District
201415
201415
90
Teachers with Full Credential
80
W ith Full Credential
82
79
76
Teachers without Full Credential
Teachers Teaching Outside Subject Area of Competence
506
70
W ithout Full Credential
1
0
0
5
Teachers Teaching Outside Subject
Area of Competence (w ith full
credential)
3
0
1
9
60
50
40
30
20
10
0
2012-13
2013-14
2014-15
Last updated: 1/27/2015
Teacher Misassignments and Vacant Teacher Positions
Indicator
201213
201314
201415
3
0
0
3.5
Misassignments of Teachers of English Learners
Misassignments of Teachers of English
Learners
Total Teacher Misassignments
3.0
Total Teacher Misassignments*
3
0
0
Vacant Teacher Positions
0
0
0
Vacant Teacher Positions
2.5
2.0
1.5
1.0
0.5
0.0
2012-13
2013-14
2014-15
Note: “Misassignments” refers to the number of positions filled by teachers w ho lack legal authorization to teach that grade level, subject area, student group, etc.
* Total Teacher Misassignments includes the number of Misassignments of Teachers of English Learners.
Last updated: 1/27/2015
Page 6 of 24
2013-14 SARC - Vacaville High
Core Academic Classes Taught by Highly Qualified Teachers (School Year 2013-14)
Percent of Classes In Core Academic Subjects Taught by
Highly Qualified Teachers
Percent of Classes In Core Academic Subjects Not Taught by
Highly Qualified Teachers
This School
96
4
All Schools in District
95
5
High-Poverty Schools
in District
96
4
Low -Poverty Schools
in District
94
6
Location of Classes
Note: High-poverty schools are defined as those schools w ith student eligibility of approximately 40 percent or more in the free and reduced price meals program. Low poverty schools are those w ith student eligibility of approximately 39 percent or less in the free and reduced price meals program.
Last updated: 1/27/2015
Quality, Currency, Availability of Textbooks and Instructional Materials - Most Recent Year
Year and month in w hich data w ere collected: June 2014
Subject
Textbooks and Instructional Materials/year of
Adoption
Reading/Language Arts
From Most Recent
Adoption?
Percent Students Lacking Own
Assigned Copy
Yes
0.0
Yes
0.0
Yes
0.0
Yes
0.0
Yes
0.0
SpringBoard English Language Arts (College Board,
2014)
Mathematics
Core Connections Integrated Math I (CPM 2013)
Science
Biology CA Edition (Prentice Hall 2007)
History-Social Science
W orld History: Connections to Today (Prentice Hall,
2003)
U.S. History: The American Vision Modern Times
(Glencoe, 2003)
Economics Principals in Action (Prentice Hall 2003)
American Government (Prentice Hall 2003)
Foreign Language
Avancemos 1-3 (Holt McDougal 2013)
Discovering French 1-3 (Holt McDougal 2013)
Health
0.0
Various
Visual and Performing Arts
0.0
Various
Science Laboratory Equipment
(grades 9-12)
0.0
Various
Last updated: 1/27/2015
Page 7 of 24
2013-14 SARC - Vacaville High
School Facility Conditions and Planned Improvements - Most Recent Year
Summary of Most Recent Site Inspection
The district takes great efforts to ensure that all schools are clean, safe, and functional. To assist in this effort, the district uses a facility survey instrument
developed by the State of California Office of Public School Construction. The results of this survey are available at the Maintenance Department Office, 353
Brow n Street, Vacaville, CA, 95688, and at the Facilities Department Office at 401 Nut Tree Road, Vacaville, CA 95687. Below is more specific information on the
condition of the school and the efforts made to ensure that students are provided w ith a clean, safe, and functional learning environment.
Repairs Needed
Repairs are needed w here specified below .
Corrective Actions Taken or Planned
All items identified below have been repaired or are planned to be repaired through our district w ork order process.
Last updated: 1/28/2015
School Facility Good Repair Status - Most Recent Year
System Inspected
Rating
Systems: Gas Leaks,
Mechanical/HVAC, Sew er
Good
Interior: Interior Surfaces
Good
Repair Needed and Action Taken
or Planned
Rooms 45-49, 50-54 – stained
ceiling tiles. Boys locker room portables 100-106, 109, 111 –
carpet stained; Portables 120-130 –
carpet replacement needed.
Cleanliness: Overall
Cleanliness, Pest/Vermin
Infestation
Good
Electrical: Electrical
Good
Restrooms/Fountains:
Restrooms, Sinks/Fountains
Good
Safety: Fire Safety, Hazardous
Materials
Good
Structural: Structural
Damage, Roofs
Good
External: Playground/School
Grounds,
W indow s/Doors/Gates/Fences
Rooms 20-29, 30-33 – trash. Monte
Vista Gym – pigeons all over w est
aw ning. Zunino Field – pigeons
roosting on electrical boxes.
Restrooms by room 53 at Boys &
Girls locker room, and across from
English office not cleaned to district
standards.
Room 34 – paint peeling.
Fair
Rooms 3, 21 and 43 cracked
w indow s. Asphalt needs repair or
replacement; Rooms T-8, T-14 –
fencing needs repair
Overall Facility Rate - Most Recent Year
Overall Rating
Good
Last updated: 1/28/2015
Page 8 of 24
2013-14 SARC - Vacaville High
B. Pupil Outcomes
State Priority: Pupil Achievement
The SARC provides the follow ing information relevant to the Pupil Achievement State Priority (Priority 4):
Statew ide assessments (i.e., California Assessment of Student Performance and Progress and its successor the Standardized Testing and Reporting Program);
The Academic Performance Index; and
The percentage of pupils w ho have successfully completed courses that satisfy the requirements for entrance to the University of California and the California
State University, or career technical education sequences or programs of study.
California Assessment of Student Performance and Progress/ Standardized Testing and Reporting Results for All
Students in Science – Three-Year Comparison
Percent of Students Scoring at Proficient or Advanced (meeting or exceeding the state standards)
School
Subject
Science (grades 5, 8, and 10)
District
State
2011-12
2012-13
2013-14
2011-12
2012-13
2013-14
2011-12
2012-13
2013-14
51
43
53
58
58
60
60
59
60
Note: Science assessments include California Standards Tests (CSTs), California Modified Assessment (CMA), and California Alternate Performance Assessment (CAPA).
Note: Scores are not show n w hen the number of students tested is ten or less, either because the number of students in this category is too small for statistical
accuracy or to protect student privacy.
Last updated: 1/27/2015
California Assessment of Student Performance and Progress Results by Student Group in Science (School Year
2013-14)
Group
Percent of Students Scoring at Proficient or Advanced
All Students in the LEA
60
All Students at the School
53
Male
51
Female
55
Black or African American
45
American Indian or Alaska Native
Asian
41
Filipino
42
Hispanic or Latino
39
Native Haw aiian or Pacific Islander
W hite
61
Tw o or More Races
77
Socioeconomically Disadvantaged
35
English Learners
13
Students w ith Disabilities
14
Students Receiving Migrant Education Services
Note: Science assessments include CSTs, CMA, and CAPA in grades 5, 8, and 10.
Note: Scores are not show n w hen the number of students tested is ten or less, either because the number of students in this category is too small for statistical
accuracy or to protect student privacy.
Page 9 of 24
2013-14 SARC - Vacaville High
Last updated: 1/27/2015
Standardized Testing and Reporting Results for All Students - Three-Year Comparison
Percent of Students Scoring at Proficient or Advanced (meeting or exceeding the state standards)
School
Subject
District
State
2010-11
2011-12
2012-13
2010-11
2011-12
2012-13
2010-11
2011-12
2012-13
English-Language Arts
51%
52%
52%
54%
57%
56%
54%
56%
55%
Mathematics
21%
23%
20%
47%
47%
48%
49%
50%
50%
History-Social Science
52%
55%
56%
48%
50%
54%
48%
49%
49%
Note: STAR Program w as last administered in 2012–13. Percentages are not calculated w hen the number of students tested is ten or less, either because the number of
students in this category is too small for statistical accuracy or to protect student privacy.
Last updated: 1/27/2015
Academic Performance Index Ranks – Three-Year Comparison
API Rank
2011
2012
2013
Statew ide
5
5
5
Similar Schools
2
2
2
Note: For 2014 and subsequent years, the statew ide and similar schools ranks w ill no longer be produced.
Last updated: 1/27/2015
Academic Performance Index Growth by Student Group – Three-Year Comparison
Group
Actual API Change 2011
Actual API Change 2012
Actual API Change 2013
21
17
-8
46
-28
41
34
-1
14
12
-4
Socioeconomically Disadvantaged
32
42
-11
English Learners
40
42
-27
Students w ith Disabilities
68
11
-1
All Students at the School
Black or African American
American Indian or Alaska Native
Asian
Filipino
Hispanic or Latino
Native Haw aiian or Pacific Islander
W hite
Tw o or More Races
Note: “N/D” means that no data w ere available to the CDE or LEA to report. “B” means the school did not have a valid API Base and there is no Grow th or target
information. “C” means the school had significant demographic changes and there is no Grow th or target information.
Last updated: 1/27/2015
Page 10 of 24
2013-14 SARC - Vacaville High
Career Technical Education Programs (School Year 2013-14)
Vacaville High School encourages students to prepare for a variety of options upon graduation. W e’d like most students (70%) to be a-g qualified, but w e also
have Career Tech programs that prepare students for careers in specific fields or to pursue more education in those Career fields. The five that w e have at Vaca
High are:
• Agriculture Services (just received a planning grant of $35,000)
• Culinary Arts
• Biotechnology
• Medical Sciences
• Drafting and Robotics
It is our goal that every student at Vacaville High School graduate w ith the skills to immediately attend college (a-g qualified) or have a CTE plan in place for
graduation. W e are w orking w ith our district, county and community partners to develop meaningful pathw ays that lead directly to meaningful careers.
Last updated: 1/27/2015
Career Technical Education Participation (School Year 2013-14)
Measure
CTE Program Participation
Number of pupils participating in CTE
593
Percent of pupils completing a CTE program and earning a high school diploma
30.0
Percent of CTE courses sequenced or articulated betw een the school and institutions of postsecondary education
27.0
Last updated: 1/29/2015
Courses for University of California and/or California State University Admission
UC/CSU Course Measure
Percent
2013-14 Students Enrolled in Courses Required for UC/CSU Admission
77.8
2012-13 Graduates W ho Completed All Courses Required for UC/CSU Admission
48.9
Page 11 of 24
2013-14 SARC - Vacaville High
Last updated: 1/27/2015
State Priority: Other Pupil Outcomes
The SARC provides the follow ing information relevant to the Other Pupil Outcomes State Priority (Priority 8):
Pupil outcomes in the subject areas of English, mathematics, and physical education.
California High School Exit Examination Results for All Grade Ten Students – Three-Year Comparison (if
applicable)
Percent of Students Scoring at Proficient or Advanced
School
Subject
District
State
2011-12
2012-13
2013-14
2011-12
2012-13
2013-14
2011-12
2012-13
2013-14
English-Language Arts
66%
61%
60%
65%
62%
40%
56%
57%
56%
Mathematics
68%
61%
60%
65%
61%
41%
58%
60%
62%
Note: Percentages are not calculated w hen the number of students tested is ten or less, either because the number of students in this category is too small for
statistical accuracy or to protect student privacy.
English-Language Arts Percent of Students Scoring at Proficient or
Advanced
Mathematics Percent of Students Scoring at Proficient or Advanced
70
70
60
60
50
50
40
40
30
30
20
20
10
10
0
2011-12
0
2011-12
2012-13
2012-13
2013-14
2013-14
Last updated: 1/27/2015
Page 12 of 24
2013-14 SARC - Vacaville High
California High School Exit Examination Grade Ten Results by Student Group (School Year 2013-14) (if
applicable)
English-Language Arts
Mathematics
Percent Not
Proficient
Percent
Proficient
Percent
Advanced
Percent Not
Proficient
Percent
Proficient
Percent
Advanced
All Students in the LEA
39%
26%
35%
36%
38%
25%
All Students at the School
40%
26%
34%
40%
34%
26%
Male
46%
25%
29%
41%
31%
28%
Female
35%
26%
39%
39%
37%
23%
Black or African American
41%
31%
28%
48%
24%
27%
American Indian or Alaska Native
N/A
N/A
N/A
N/A
N/A
N/A
Asian
50%
17%
33%
42%
25%
33%
Filipino
42%
33%
25%
50%
8%
42%
Hispanic or Latino
56%
23%
21%
53%
34%
13%
Native Haw aiian or Pacific Islander
N/A
N/A
N/A
N/A
N/A
N/A
W hite
33%
26%
41%
32%
37%
31%
Tw o or More Races
20%
33%
47%
36%
50%
14%
Socioeconomically Disadvantaged
67%
21%
12%
63%
26%
11%
English Learners
100%
N/A
N/A
79%
21%
N/A
Students w ith Disabilities
85%
12%
2%
85%
11%
4%
Students Receiving Migrant Education
Services
N/A
N/A
N/A
N/A
N/A
N/A
Group
Note: Percentages are not calculated w hen the number of students tested is ten or less, either because the number of students in this category is too small for
statistical accuracy or to protect student privacy.
Last updated: 1/27/2015
California Physical Fitness Test Results (School Year 2013-14)
Percent of Students Meeting Fitness Standards
Grade level
Four of Six Standards
Five of Six Standards
Six of Six Standards
5
N/A
N/A
N/A
7
N/A
N/A
N/A
9
17.6%
22.7%
35.6%
Note: Percentages are not calculated w hen the number of students tested is ten or less, either because the number of students in this category is too small for
statistical accuracy or to protect student privacy.
Last updated: 1/27/2015
Page 13 of 24
2013-14 SARC - Vacaville High
C. Engagement
State Priority: Parental Involvement
The SARC provides the follow ing information relevant to the Parental Involvement State Priority (Priority 3):
Efforts the school district makes to seek parent input in making decisions for the school district and each schoolsite.
Opportunities for Parental Involvement - Most Recent Year
Contact: Ed Santopadre, Principal (707) 453-6011
Vacaville High School desires to become increasingly more pro-active in creating partnerships w ith the parents and community members that make up the Vacaville
school support systems. W e seek to increase active parent and community participation in the decision-making process. Parents are encouraged to become
involved in the educational decision-making process through Site Council and English Learners Advisory Committee (ELAC). Parent involvement can benefit our
school in countless w ays through membership in PTC, Music and Athletic Boosters and various other organizations. Parental input is important in the full range of
educational activities, and their involvement is key in the development of literate, life-long learners and productive citizens.
W e also have a parent conference night specifically for parents of EL students. W e have translators and all EL teachers meet w ith parents at specific times.
English Learner Advisory Committee: The
English Language Advisory Committee (ELAC) is a collaborative effort focusing on addressing the needs of English Learner (EL) students. Parents, Vacaville High
School staff, community stakeholders, and students meet four times a year to share information, analyze current services, and discuss w ays to get parents and
students more involved in the educational process. ELAC is a place w here parents learn how to support EL students to help them successfully graduate high
school and plan for a successful future. Additionally, VHS is lucky to have a number of booster organizations that raise money for the school, including the
Quarterback Club, Music Booster Club, and the Bulldog Fan Club.
Parent Teacher Club (PTC): The objective of the VHS PTC is to support Vacaville High School; to encourage communication betw een parents and staff of VHS,
to raise and administer funds and provide support and volunteers at school functions. Below is a small list of PTC contributions to VHS:
• Granted $3,000 in scholarships to graduating VHS Seniors
• W orks and supplies concessions at the Pow er Puff football game
• Sponsors 4 seniors for Grad Night • Provides and serves refreshments for W inter Ball and Black & Orange Aw ards • Equipment purchases: projection screen in the
gym, quad lunch tables, banner
• Design, order, buy and sell VHS Spirit Clothes
• Relies solely on volunteers, membership dues, and donations
Grad Nite: This is an organization of parents w hose goal is to raise enough funds all of our graduates are able to attend a safe, sober, and fun party at a minimum
cost. Their motto is “No Drugs, No Booze, No Tragedy for our Graduating Seniors...” Grad Nite offers celebrating teens an alternative to alcohol and drugs.
State Priority: Pupil Engagement
Last updated: 1/27/2015
The SARC provides the follow ing information relevant to the Pupil Engagement State Priority (Priority 5):
High school dropout rates; and
High school graduation rates.
Page 14 of 24
2013-14 SARC - Vacaville High
Dropout Rate and Graduation Rate (Four-Year Cohort Rate)
School
Indicator
Dropout Rate
Graduation Rate
District
State
2010-11
2011-12
2012-13
2010-11
2011-12
2012-13
2010-11
2011-12
2012-13
9.4
7.7
6.7
14.1
9.0
9.4
14.7
13.1
11.4
87.17
89.21
91.23
79.68
82.56
84.25
77.14
78.87
80.44
Dropout/Graduation Rate (Four-Year Cohort Rate) Chart
100
Dropout Rate
Graduation Rate
80
60
40
20
0
2010-11
2011-12
2012-13
Last updated: 1/27/2015
Page 15 of 24
2013-14 SARC - Vacaville High
Completion of High School Graduation Requirements
Graduating Class of 2013
Group
School
District
State
All Students
107
107
84
Black or African American
123
114
75
American Indian or Alaska Native
100
100
77
Asian
115
102
92
Filipino
100
100
92
Hispanic or Latino
111
109
80
Native Haw aiian or Pacific Islander
100
142
84
W hite
105
104
90
Tw o or More Races
118
123
89
Socioeconomically Disadvantaged
109
111
82
English Learners
80
64
53
Students w ith Disabilities
111
112
60
Page 16 of 24
2013-14 SARC - Vacaville High
Last updated: 1/27/2015
State Priority: School Climate
The SARC provides the follow ing information relevant to the School Climate State Priority (Priority 6):
Pupil suspension rates;
Pupil expulsion rates; and
Other local measures on the sense of safety.
Suspensions and Expulsions
School
Rate
District
State
2011-12
2012-13
2013-14
2011-12
2012-13
2013-14
2011-12
2012-13
2013-14
Suspensions
7.00
6.10
4.90
6.70
5.20
5.00
5.70
5.10
4.40
Expulsions
0.40
0.30
0.30
0.10
0.10
0.20
0.10
0.10
0.10
Suspensions
Expulsions
8
0.45
School Suspensions
District Suspensions
7
School Expulsions
District Expulsions
0.40
State Suspensions
State Expulsions
0.35
6
0.30
5
0.25
4
0.20
3
0.15
2
0.10
1
0.05
0
0.00
2011-12
2012-13
2013-14
2011-12
2012-13
2013-14
Last updated: 1/27/2015
School Safety Plan - Most Recent Year
The North Bay Schools Insurance Authority acts as the lead agency in school safety. This agency and school custodians conduct periodic inspections and review s.
Accident report summaries are provided by the NBSIA to site administration and these are review ed annually. Accident reports are also maintained in the nurse's
office and the office of the Principal's secretary. Vacaville maintenance personnel w ork extremely hard to maintain the building and grounds. Periodic safety
inspections are conducted by custodians, district maintenance officials, North Bay Insurance, and Vacaville Fire Department. Over the past decade, the school has
received construction updates of the gym and many classrooms. A school-w ide intercom and bell system allow s administration to notify students and teachers of
emergencies. All classrooms are equipped w ith telephones, w hich permit classroom teachers and other staff to communicate w ith the office and access
emergency services. A video camera system gives administrators the ability to view and record various campus locations, allow ing for improved supervision on our
campus. Classrooms are fitted w ith appropriate fire extinguishers as a result of the aforementioned construction. Science classrooms are outfitted w ith safety
blankets, eye w ash stations, and chemical hazard supplies. School security and safety is monitored by four full-time campus supervisors, four full-time
administrators, a youth services officer, and the staff of Vacaville High. Procedures for receiving verification from law enforcement In the event of a crime or
emergency on campus that w ould require the campus to be on lockdow n, staff w ould be notified immediately through the intercom system and/or through email. Parents w ould be notified through Parent Link (phone calls, e-mails, and/or text) and/or Schoolloop. Crime data is published on an annual basis in this Safe
School Plan document w hich is made available on the school and district w ebsite.
Staff members all w ear photo identification card, and visitors must all check into the office to get a visitor’s pass sticker to w ear. Individuals w ho do not belong on
campus are immediately reported to administration. Vacaville High School is fortunate to have a Youth Service Unit of the Vacaville Police Department on campus,
w hich includes one sw orn officer and a Master Social W orker. These resources assist in the management of our student population. In addition to a police
presence on campus, four campus supervisors monitor the campus. These campus supervisors are trained in conflict mediation strategies, identifying levels of
behavior, and de-escalating strategies. Vacaville Police personnel, Vacaville High School administrators and campus supervisors, and district personnel meet monthly
as part of a Gang Task Force committee that addresses gang, graffiti, and safety issues that the schools and community have in common. From time to time,
Page 17 of 24
2013-14 SARC - Vacaville High
members of the Vacaville Police Force present gang information to teachers at faculty meetings. Vacaville High School administrators w ork closely w ith the on-site
police officer during hostile act drills to ensure that the campus is secure. Staff practice locking dow n the campus at least tw ice per year. Staff has also received
training from a Vacaville police officer in how to handle an intruder on campus (“run-hide-fight”).
Vacaville High School’s Link Crew program has received recognition throughout the state and nation. Link Crew is a pow erful transition program designed to help
incoming freshmen find success as they move from middle school to high school. Before the school year begins, all incoming freshmen are linked w ith trained
upper-class mentors (Link Crew Leaders) w ho orient their “links” to our Bulldog culture. This support netw ork of upperclassmen helps incoming students make the
social, emotional, and academic adjustment to the high school setting. In addition, Vacaville High School students have had the opportunity to participate in
Breaking Dow n the W alls (BDTW ). BDTW is a pow erful bullying/violence prevention program that teaches students how to communicate w ith each other, giving
them the tools to w ork together in times of question or conflict. BDTW is also a leadership development program as it empow ers positive leaders from a variety of
peer groups to help create a school climate that is safe, comfortable and supportive for everyone. Approximately 450 students participated in this program in
October 2012. This program has been offered on a bi-yearly basis for many years.
Vacaville High School students have the opportunity to develop leadership skills by participating in YTOT (Youth Takin’ on Tobacco and other Drugs). YTOT takes
their strong anti-drug message directly to VHS students in their health classes. Either as a participant in YTOT or as a recipient of the YTOT message, students
can develop social competencies, particularly the resistance skills that have been proven to help young people avoid negative peer pressure and dangerous
situations. Students w ho are caught on campus (or at school events) in possession of or under the influence of alcohol or other drugs or students w ho are
know n to be experiencing problems w ith alcohol or other drugs are offered an opportunity to receive counseling by school counseling staff w ho are trained in the
Brief Intervention model. In many cases, the student receives a reduced consequence (e.g., few er days of suspension) if he/she and their parent agree to
participate in Brief Intervention sessions. Students can also be referred to programs through Youth Services such as Insight, and 8 w eek program for students
w ho are dabbling in drug/alcohol use, or A.D.A.P.T, a Saturday event in w hich students and their families engage in a variety of activities that help them
understand the consequences of drug and alcohol abuse.
The Safe School Plan w as revised and approved on November 20, 2014
Last updated: 1/27/2015
Page 18 of 24
2013-14 SARC - Vacaville High
D. Other SARC Information
The information in this section is required to be in the SARC but is not included in the state priorities for LCFF.
Adequate Yearly Progress Overall and by Criteria (School Year 2013-14)
AYP Criteria
School
District
Made AYP Overall
No
No
Met Participation Rate - English-Language Arts
Yes
Yes
Met Participation Rate - Mathematics
Yes
Yes
Met Percent Proficient - English-Language Arts
No
No
Met Percent Proficient - Mathematics
No
No
Met Graduation Rate
Yes
Yes
Last updated: 1/27/2015
Federal Intervention Program (School Year 2014-15)
Indicator
Program Improvement Status
School
District
Not in PI
In PI
First Year of Program Improvement
2004-2005
Year in Program Improvement *
Year 3
Number of Schools Currently in Program Improvement
N/A
5
Percent of Schools Currently in Program Improvement
N/A
31.2%
Note: Cells w ith NA values do not require data.
* DW (determination w aiver) indicates that the PI status of the school w as carried over from the prior year in accordance w ith the flexibility granted through the federal
w aiver process.
Last updated: 1/27/2015
Average Class Size and Class Size Distribution (Secondary)
2011-12
2012-13
Number of Classes *
Subject
2013-14
Number of Classes *
Number of Classes *
Average Class Size
1-22
23-32
33+
Average Class Size
1-22
23-32
33+
Average Class Size
1-22
23-32
33+
English
23.6
30
45
13
23.0
37
38
23
21.0
40
55
12
Mathematics
27.5
13
25
30
26.0
18
26
29
24.0
20
48
9
Science
31.1
2
30
18
27.0
12
24
19
27.0
12
22
22
Social Science
31.3
3
23
24
23.0
25
15
32
23.0
21
46
7
* Number of classes indicates how many classrooms fall into each size category (a range of total students per classroom). At the secondary school level, this information is
reported by subject area rather than grade level.
Last updated: 1/27/2015
Page 19 of 24
2013-14 SARC - Vacaville High
Academic Counselors and Other Support Staff (School Year 2013-14)
Title
Number of FTE* Assigned to School
Average Number of Students per Academic Counselor
4.0
498.0
Academic Counselor
Counselor (Social/Behavioral or Career Development)
N/A
Library Media Teacher (librarian)
N/A
Library Media Services Staff (paraprofessional)
1.0
N/A
Psychologist
2.0
N/A
Social W orker
N/A
Nurse
0.3
N/A
Speech/Language/Hearing Specialist
0.5
N/A
Resource Specialist (non-teaching)
N/A
Other
N/A
Note: Cells w ith N/A values do not require data.
* One Full Time Equivalent (FTE) equals one staff member w orking full time; one FTE could also represent tw o staff members w ho each w ork 50 percent of full time.
Last updated: 1/27/2015
Expenditures Per Pupil and School Site Teacher Salaries (Fiscal Year 2012-13)
Total Expenditures Per
Pupil
Expenditures Per Pupil
(Supplemental/Restricted)
Expenditures Per
Pupil
(Basic/Unrestricted)
Average Teacher
Salary
$4,736
$705
$4,031
$60,022
District
N/A
N/A
$5,613
$61,732
Percent Difference – School Site and
District
N/A
N/A
28.20%
2.80%
State
N/A
N/A
$4,690
$69,360
Percent Difference – School Site and State
N/A
N/A
14.00%
13.50%
Level
School Site
Note: Cells w ith N/A values do not require data.
Last updated: 1/27/2015
Page 20 of 24
2013-14 SARC - Vacaville High
Types of Services Funded (Fiscal Year 2013-14)
Total Unrestricted Expenditures $8,041,546.79
Instruction $5,426,136.93
Supervision of Instruction $257.95
Curriculum Development $81.03
Instructional Media & Library $58,705.42
Other Instructional Resources $191.99
Parent Participation $1,267.24
School Administration $955,829.45
Guidance & Counseling Services $482,599.36
Attendance & Social W ork Services $85,272.54
Pupil Testing Services $2,131.58
Other Pupil Services $212.29
School Sponsored Athletics $53,098.38
Plant M & O $48,133.05
Mtce: Grounds $1,160.00
Operations $323,716.56
Operations - Buildings $419,770.62
Security $182,582.40
Other Plant M & O $400.00
Total Restricted Expenditures $1,405,925.00
Child Nutrition $393,805.85
Special Education $894,773.88
Page 21 of 24
2013-14 SARC - Vacaville High
Agricultural Vocational Ed. $5,512.00
Genentech $7,467.90
Donations $95,302.01
Last updated: 1/27/2015
Teacher and Administrative Salaries (Fiscal Year 2012-13)
Category
District Amount
State Average For Districts In Same Category
Beginning Teacher Salary
$35,433
$41,318
Mid-Range Teacher Salary
$57,443
$65,615
Highest Teacher Salary
$80,882
$84,981
Average Principal Salary (Elementary)
$97,619
$107,624
Average Principal Salary (Middle)
$107,040
$112,817
Average Principal Salary (High)
$107,104
$121,455
Superintendent Salary
$31,020
$206,292
Percent of Budget for Teacher Salaries
40.0%
40.0%
Percent of Budget for Administrative Salaries
6.0%
5.0%
For detailed information on salaries, see the CDE Certificated Salaries & Benefits W eb page at http://w w w .cde.ca.gov/ds/fd/cs/ .
Teacher Salary Chart
Principal Salary Chart
90000
120000
80000
100000
70000
80000
60000
50000
60000
40000
40000
30000
20000
20000
10000
0
Beginning Teacher Salary
Mid-Range Teacher Salary
Highest Teacher Salary
0
Average Principal Salary
(Elementary)
Average Principal Salary
(Middle)
Average Principal Salary
(High)
Last updated: 1/27/2015
Page 22 of 24
2013-14 SARC - Vacaville High
Advanced Placement Courses (School Year 2013-14)
Subject
Number of AP Courses Offered*
Computer Science
English
Percent of Students In AP Courses
N/A
7
Fine and Performing Arts
N/A
N/A
Foreign Language
1
N/A
Mathematics
3
N/A
Science
5
N/A
Social Science
2
N/A
All Courses
18
0.8
Note: Cells w ith N/A values do not require data.
*W here there are student course enrollments.
Last updated: 1/27/2015
Professional Development – Most Recent Three Years
Vacaville Unified School District (VUSD) provides professional development opportunities for educators and staff at all stages of their careers. Beginning Teacher
Support and Assessment (BTSA) and Title II of the No Child Left Behind Act are the primary funding sources.
BTSA is a tw o-year program of induction. Through a series of after school meetings, peer observations, and release time meetings, new teachers learn about The
California Standards for the Teaching Profession. BTSA is essential for new teachers in order to complete their credential. Our district is a member of the
Yolo/Solano BTSA consortium w hich provides mentoring and support for all new teachers.
VUSD has adopted a standards-based Reading Language Arts and Mathematics series for K-6. Other areas of professional development include: Accelerated
Reader training, technology training, English language development instruction, First Aid and CPR, family life training, substitute teacher training sessions,
differentiated instruction, instructional strategies (Checking for Understanding), Explicit Direct Instruction, and training for Special Education teachers.
Many teachers serve on district CAMP committees. These collaborative groups w ork together to discuss best practices, identify essential standards and create
effective pacing guides and assessments for student success and district-w ide consistency. VUSD Staff Development opportunities are driven by a combination of
Common Core State Standards (CCSS), student achievement data, input from BTSA and staff surveys. All teachers participate in site-based professional
development via collaborative planning time once per w eek. This time is utilized to discuss topics related to student achievement. Instructional assistants w ho
w ork w ith students are invited to attend after school sessions in any subject area that applies to their job requirements. Clerical staff receives technology inservices in areas of job requirements, such as attendance programs, library inventories, w ord processing and email. Professional development opportunities take
place during summer, on release time, after school, evenings and w eekends. Sites may use decentralized funds for professional development specific to their site
as part of their single plan.
Certificated staff members meet w eekly in collaborative grade level teams to focus on student achievement. The agenda for these w eekly meetings focus on the
four essential questions:
• W hat is it that our students need to learn?
• How w e w ill w e assess if they have learned the content?
• How w ill w e provide extra support for those w ho have learned the content?
• W hat enrichment can w e provide for those w ho have learned the content?
Our primary focus during this Collaborative Professional Time (CPT) has been the creation of common formative assessments. It is our goal to align tw o formative
assessments per month, across the curricula, at every grade level. These short, formative assessments provide snapshots of w hat our students can and cannot
Page 23 of 24
2013-14 SARC - Vacaville High
do.
To w rite these formative assessments, w e encourage teachers to w ork backw ards, beginning w ith the CCSS, unpacking the standard into discrete learning
targets, and w riting lessons w ith multiple formative assessments to gauge how w ell students are understanding and applying the learning targets—the Common
Core skills.
To that end, w e’re also designing experiences for teachers to share ideas about grading. Specifically, w e’d like teachers to try skills-based grading, a system w here
students focus on proficiency levels of Common Core skills instead of an accumulation of points and extra credit. W e feel this w ill grant teachers, students,
parents, and administrators a clear picture of w hat Common Core skills our students have learned. It w ill make learning more visible, and student learning is our
core purpose.
Last updated: 1/27/2015
Page 24 of 24


© Copyright 2026